Confined water in the low hydration regime.
Abstract
Molecular dynamics results on water confined in a silica pore in the low hydration regime are presented. Strong layering effects are found due to the hydrophilic character of the substrate. The local properties of water are studied as function of both temperature and hydration level. The interaction of the thin films of water with the silica atoms induces a strong distortion of the hydrogen bond network. The residence time of the water molecules is dependent on the distance from the surface. Its behavior shows a transition from a brownian to a non-brownian regime approaching the substrate in agreement with results found in studies of water at contact with globular proteins.
pacs:
61.20.Ja, 61.20.-p, 61.25.-fI Introduction
Thin films of water confined in restricted geometries play an important role in many different phenomena in geology, chemistry, biology. Important processes taking place in minerals, plants, biological membranes are determined by the presence of water confined in nanopores inside the system or at contact with the surface. debenedetti ; robinson ; israe In biology for instance the enzymatic activity of globular proteins or the function of biological membranes are due to the interaction with water debenedetti , and the decrease of the hydration level may inhibit their biological functionality. biol It is still difficult to predict accurately how the properties of water are modified when it is at contact with the various substrates or confined in different geometries. Nevertheless recent theoretical and computational work on water confined in hydrophobic rigid environments indicate strong changes in its thermodynamical behavior. truskett ; meyer
A strong reduction of the tetrahedral order with consequent distortion of the hydrogen bond network has been evidenced by neutron scattering experiments with isotopic substitution performed on water confined in Vycor mar1 ; mar2 , by experiments performed on freezing of water confined in an hydrophilic environment of mica raviv and in water confined in vermiculite clay. bergman These findings are in agreement with recent computer simulation results. brovchenko ; jmoliq ; gr-jcp Particularly relevant are the observations in experiments and computer simulation of the formation of distinct layer of water with different structural and dynamical properties: an interfacial layer close to the substrate, where water molecules show a slow dynamics, and a layer far from the surface with almost bulk like properties. melni ; kremer ; barut ; mckenna ; noi-epl ; noi-prl ; noi-jcp The layering effect is expected to be relevant in many phenomena associated with confined water. There are experimental evidences of a slow relaxation of water at contact with proteins doster ; bizzarri1 ; bizzarri2 ; bizzarri3 ; bizzarri4 , while signatures of a similar behavior has been found in water confined in Vycor for low hydrations. venturini
As long as a detailed description of the microscopic properties of water at interface with complex materials like biological macromolecules is difficult to be obtained it could be appropriate to use model systems with well defined geometry and interaction between water and substrate. We present here the results obtained by a molecular dynamics (MD) study of a model of water confined in Vycor at low hydration levels. By computer simulation we can freely vary temperature and hydration level and make an accurate study of the changes induced in the properties of water by the confinement. This work is part of a detailed study of the structural and dynamical properties of confined water. jmoliq ; gr-jcp ; noi-epl ; noi-prl ; noi-jcp
The low hydration regime is somehow more important to be explored at least for two main reasons: (i) the effect of the substrate on the confined water is expected to be enhanced; (ii) the experimental observations are the result of an averaging over different water layers and an accurate analysis of the low hydration regime is the only way to gain some insight on the water-substrate interaction.
An accurate layer analysis enables us to examine the modifications of the main structural properties of confined water and to make connection with recent experimental and computer simulation results which concern water at contact with proteins.
In Sec. II we briefly describe our simulation method, in Sec. III, IV and V we present the main results of our calculation. Sec. VI is devoted to conclusions.
II Computer simulation of confined water
The computer simulation is performed in the microcanonical ensemble on water molecules described by the simple point charge/extended (SPC/E) site model potential inserted in a cylindrical cavity of radius Å. The cavity has been carved in a cubic cell of silica glass obtained by computer simulation, as described in previous work. jmoliq ; gr-jcp ; noi-jcp The system is modeled to represent water confined in Vycor, the internal surface of the cylindrical cell is corrugated and composed by silicon atoms (Si), bridging oxygens (BO) which are bonded to two silicons and non-bridging oxygens (NBO) connected only to one silicon. The NBO are saturated with acidic hydrogens (AH). The interaction of water with the substrate is modeled by assigning different charges to the sites representing the atoms of Vycor. A Lennard-Jones interaction is assumed between the oxygens of water and the BO and NBO of the confining system. jmoliq Periodic boundary conditions are applied along the axis of the cylinder assumed as the direction. The motion is confined in the plane, where the distance from the axis is defined in terms of the radius . During the simulation the substrate is kept rigid.
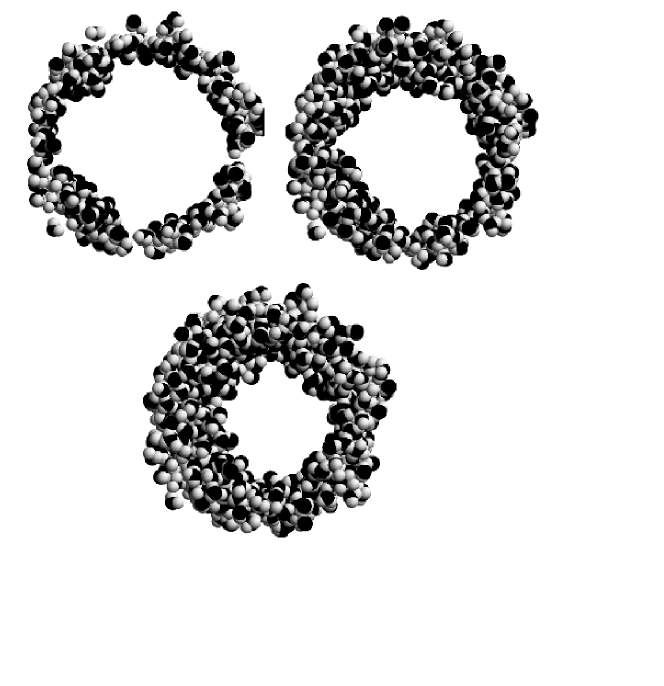
The density of the full hydration in the experiments mar1 Å-3 corresponds in our system to roughly molecules. We performed our simulation at three different hydration levels which corresponds to % of hydration, ( %) and ( %). In Fig. 1 the snapshots of the configurations at the three different hydration levels show the hydrophilic character of the substrate.

III Density profiles
In the density profiles reported in Fig. 2 it is evident for all the hydrations the formation of a well defined first layer of molecules close to the surface, while a second layer grows up with the hydration level. Few molecules penetrate and are trapped inside the substrate ( Å). We notice that at the highest hydration () the density in the double layer structure increases above the value of density of water at ambient conditions. The decrease of temperature has very little effect on the density profiles, apart from the sharpening of the second layer at the hydration .
It is clear from Fig. 1 that the arrangement of the molecules close to the Vycor surface is not uniform and the formation of clusters of different sizes is observed, this is even more evident in Fig. 3 where we report an histogram of the distribution of the molecules in the plane along a circumference at distance Å where the density profile reaches the maximum. The cluster sizes fluctuate up to hundred molecules with an average value of molecules, this is in agreement with neutron diffraction experiments agamalian where clusters of the same size are observed at similar value of the hydration.
IV Layer analysis of the hydrogen bond
Figure 4 shows the average number of hydrogen bond(HB) per molecule along the pore radius for the different hydration levels. We assume that two neighbors water molecules are hydrogen bonded if the angle is less than . jedlov Two water molecules are considered neighbors if their O-O separation is less than Å. The number of water-water HB decreases approaching the surface, while inside the double layer structure it grows up the number of HB of the water with the Vycor surface . The water molecules form preferentially hydrogen bonds with the bridging oxygens. The arrangement of the clusters close to the Vycor surface is mainly determined by this type of bonds. The number of HB between water molecules and the acidic H atoms is negligible on the scale of the figure. The curves do not show substantial differences as function of hydration level of the pore.

In Fig. 5 the radial profile of the water-Vycor bonds is compared with the density profile of the bridging oxygens at the surface; by considering that the bond length is approximately Å there is a clear correspondence between the two profiles. It is evident that the bridging oxygens substitute as acceptors the water oxygens approaching the surface since the total number of HB , also reported in Fig. 4, remains practically constant. The maximum number of water-water HB grows with increasing hydration level since more water molecules become available for the formation of bonds. The maximum is located around Å where the density profile shows a minimum (see Fig. 2), in agreement with the fact that the hydrogen bonds increase with decreasing density at room temperature and upon supercooling. geiger
At lower temperatures the number of water-water and water-Vycor hydrogen bonds increases but the profiles are similar to those shown in Fig. 4 at K.

In Fig. 6 we report the radial profiles of the average number of water-water hydrogen bonds compared with the profiles of the average number of neighbors . The ratio between the two quantities estimates the number of molecules forming hydrogen bonds between the neighbors. It can be considered as a measure of the rigidity of the hydrogen bond network and it is reported in Fig. 7 for selected values of the hydration and temperature. The ratio is smaller close to the surface ( Å) where the hydrogen bonds are made mainly with the Vycor surface. Below Å each molecule is able to make hydrogen bonds with almost all its neighbors.
The network becomes more rigid on lowering the temperature (see Fig. 7) since the number of hydrogen bonds increases while the number of neighbors is almost insensible to the variation of temperature, like in the density profiles in Fig. 2. This might be possibly related to the recently proposed fragile to strong transition for strongly confined water. bergman
We can conclude that the water molecules rearrange themselves at decreasing temperature in order to maximize the number of hydrogen bonds. We observe moreover that the rigidity increases at decreasing hydration (see inset of Fig. 7) with some important consequences for the residence times, as discussed later.
We investigated how the short range order present in bulk liquid water is modified upon confinement by looking at the distribution of the hydrogen bond angles. Fig. 8 shows the distribution of , where is the angle between the intramolecular bond O-H and the intermolecular OO vector, for and different temperatures. The water-water linear hydrogen bonds are still favored like in bulk water, there is however a more pronounced tail toward large angle with respect to bulk water. By lowering the temperature the distribution peak becomes sharper indicating an increase in the rigidity of the bonds. The distortion in the angular distribution with respect to the bulk is due to the water molecules close to the pore surface, as clearly appears in the inset of Fig. 8, where for the separated contributions from the layer Å and Å are shown. For the molecules close to the surface the peak of the angular distribution is depressed while there is a large increase of the tail at high angle, the angular distribution of the molecules closer to the interior of the pore is similar to the one of the bulk water.


The distortion of the hydrogen bonds is confirmed by experimental studies on water confined in Vycor mar1 ; mar2 and at contact with other surfaces. raviv
We studied by layer analysis the local arrangement of the nearest neighbor molecules by looking to the distribution of the angle between the two vectors joining the oxygen atom of a water molecule with the oxygen atoms of the two closest water neighbors. This distribution in the computer simulation of bulk water at ambient condition has a well defined peak around (), this peak is a signature of the tetrahedral order present in liquid water at short range distance. There is also a secondary peak at corresponding to interstitial neighbor molecules. These findings are in agreement with experimental results on water at ambient conditions.jedlov In Fig. 9 we report a layer analysis of the distribution function of of water in Vycor for different hydrations. The molecules in the layer Å for and show a distribution very similar to what found in the simulation of bulk water, the distributions become sharper at lower temperature. For the peak shifts toward , the value at which the maximum is located for K. This behavior for the lowest hydration is in agreement with experimental results indicating that in confined water freezing in a cubic crystalline phase could be favored. rrgrenoble
As a matter of fact a good short range order is present for all the hydrations in the layer Å where the water molecules are able to form hydrogen bonds with almost all their neighbors as discussed above (see Fig. 6).
In the layer closest to the Vycor surface Å the tetrahedral arrangement is completely lost due to the formation of hydrogen bonds between water molecules and the substrate. The temperature has very little effect on these distributions. In the layer Å the specific shape of the distribution is not very significant and indicates the strong distortion of the hydrogen bonds formed by the molecules found in the inner surface of the pore.


V Residence time
The dynamics of the molecules of confined water is strongly determined by the interaction with the substrate. In Fig. 10 is reported the trajectory of the center of mass of a molecule which resides at the beginning in the first layer at roughly Å from the surface for the case . At ambient temperature the molecule oscillates mainly between the two layers and persists in a position for fractions of nanoseconds, at lower temperature the molecule oscillates for all the time explored around the same position and does not go out from its initial layer.
Fig. 11 shows how the average residence time of the water molecules changes along the pore radius for different hydrations and temperatures. The residence time for each region is calculated as
| (1) |
where is the fraction of time that the molecule spent during the -th visit in the region. For all hydrations oscillations are present which are particularly marked for . The residence time reaches the maximum values at the surface. The structure of the residence time profiles around the two main peaks is reminiscent of the double layer structure of the density profiles (see Fig. 2). Apart for the layer attached to the Vycor surface the molecules have longer residence time in the regions where the density profiles have local maximal values, while the residence time minimum is found roughly at the minimum of the density distribution between the two layers. The water molecules stay for a shorter time in the range between the two layers where the maximum of the water-water HB profile is located. So in the region of minimum density the HB formed are not very stable.
The maxima of the residence time are enhanced by decreasing the hydration. As discussed in Sec. IV this effect can be explained in terms of an increase of the rigidity of the hydrogen bond network at decreasing hydration.
Close to the substrate where an elevated number of water-Vycor hydrogen bonds are present a comparison of the average residence time in the zone Å with shows that the two quantities are proportional in the range of temperature explored
| (2) |
where the constant increases at decreasing hydration level going from for to for .


The distributions of the residence times in the different layers show peculiar features, as illustrated in Fig. 12 for at room temperature. The distributions for the layers more close to the surface are well described by a power law
| (3) |
where for the molecules in layer Å , while by considering the layer Å . This behavior is a signature of a non brownian motion of the particles and it is observed at all the hydration levels explored in this work. Non brownian diffusion has been found recently in neutron scattering experiment and MD simulation on water at contact with a globular protein bizzarri3 where the distribution of the residence times of the water molecules in the layers close to the protein surface is fitted to Eq. (3) with exponents in fairly good agreement with the exponents found in the present work.
For water molecules far from the protein surface it is found bizzarri3 that the brownian regime is established with an exponential decays of the residence time distribution. In the inset of Fig. 12 the residence time distribution is reported for the internal layer Å of our system, also in our case the decay at long time can be fitted with an exponential
| (4) |
VI Summary and Conclusions
The structural properties of water confined in a cavity representing the average properties of the pores of Vycor glass have been studied by computer simulation. Water molecules are attracted by the hydrophilic surface and form a double layer structure of Å. In this region it is found that the local properties of water are strongly dependent on the hydration level and the distance from the substrate.
The hydrogen bond network is deformed with respect to bulk water, in agreement with experimental results. mar1 ; mar2 ; raviv At a distance greater than Å from the surface for the highest hydrations investigated ( and ) the water molecules are arranged in a local tetrahedral order similar to bulk water, while approaching the substrate the water-Vycor hydrogen bonds substitute the water-water hydrogen bonds and the tetrahedral order is completely lost. At the lowest studied hydration () the local order far from the surface is compatible with nucleation of a cubic crystalline phase at low temperature. Experimental evidences for nucleation of cubic ice has been indeed found for water under confinement. rrgrenoble
At a given hydration the average number of water-water HB increases with decreasing temperature while the number of nearest neighbors remains constant, this implies that the hydrogen bond network becomes more rigid upon supercooling. The effect is accentuated by decreasing the hydration. This findings are consistent with the recently proposed fragile to strong transition for strongly confined water. bergman
The analysis of the residence time of the water molecules along the pore radius evidenced connections between this quantity and the density profiles, the water molecules persist for longer time in the regions of the maxima of the double layer structure and very close to the Vycor surface.
The residence time distributions show an anomalous non brownian behavior in the layers close to the substrate with a power law decay for long time. On the contrary the distributions decay exponentially in the layers far from the surface. Experimental and computer simulation studies on water at contact with a globular protein bizzarri3 show a similar behavior. This agreement indicates that there are useful analogies between the behavior of water confined in Vycor and the behavior of water at contact with proteins. This is confirmed by a more refined analysis of the dynamical properties of confined water in the low hydration regime. lowhdyn
VII Acknowledgments
We thank M. A. Ricci for critical reading of the manuscript.
References
- (1) P. G. Debenedetti, Metastable Liquids: Concepts and Principles (Princeton University Press, Princeton, 1997).
- (2) G. W. Robinson, S. B. Zhu, S. Singh and M. W. Evans, Water in Biology, Chemistry and Physics, World Scientific Publishing.
- (3) J. Israelachvili and H. Wennerstrom, Nature 379, 219 (1996).
- (4) G. Careri, Prog. Biophys. and Molec. Biol. 70, 223 (1998).
- (5) T.M. Truskett and P.G. Debenedetti J. Chem. Phys. 114, 2401 (2001).
- (6) M. Meyer and H.E. Stanley, J. Phys. Chem. B 103, 9728 (1999).
- (7) F. Bruni, M. A. Ricci, and A. K. Soper, J. Chem. Phys. 109, 1478 (1998).
- (8) A. K. Soper, F. Bruni and M. A. Ricci, J. Chem. Phys. 109,1486 (1998).
- (9) U. Raviv, P. Laurat and J. Klein, Nature 413, 51 (2001).
- (10) R. Bergman and J. Svenson, Nature (London) 403, 283 (2000);R. Bergman, J. Svenson, L. Börjesson, and P. Jacobsson, J. Chem. Phys. 113, 357 (2000).
- (11) I. Brovchenko, A. Geiger, and D. Paschek, J. Chem. Phys. 113, 5026 (2000).
- (12) E. Spohr, C. Hartnig, P. Gallo and M. Rovere, J. Mol. Liq. 80, 165 (1999).
- (13) P. Gallo, M.A. Ricci and M. Rovere, J. Chem. Phys. 116, 342 (2002).
- (14) Yu. B. Mel’nichenko, J. Schüller, R. Richert, B. Ewen and C. K. Loong C. K., J. Chem. Phys. 103, 2016 (1995).
- (15) M. Arndt, R. Stannarius, H. Groothues, E. Hempel, and F. Kremer, Phys. Rev. Lett. 79, 2077 (1997).
- (16) G. Barut, P. Pissis, R. Pelster and G. Nimtz, Phys. Rev. Lett. 80, 3543 (1998).
- (17) J.-Y. Park and G. B. McKenna, Phys. Rev. B 61, 6667 (2000).
- (18) P. Gallo, M. Rovere, M. A. Ricci, C. Hartnig, E. Spohr, Europhys. Lett. 49, 183 (2000).
- (19) P. Gallo, M. Rovere, E. Spohr, Phys. Rev. Lett. 85, 4317 (2000).
- (20) P. Gallo, M. Rovere, E. Spohr, J. Chem. Phys. 113, 11324 (2000).
- (21) M. Settles M. and W. Doster, Faraday Discussion of the Chem. Soc. 103, 269 (1996).
- (22) A. R. Bizzarri and S. Cannistraro, Phys. Rev. E 53, 3040 (1996).
- (23) A. R. Bizzarri and S. Cannistraro, Europhys. Lett. 37, 201 (1997).
- (24) C. Rocchi, A. R. Bizzarri and S. Cannistraro, Phys. Rev. E 57, 3315 (1998) and references therein.
- (25) A. Paciaroni, A. R. Bizzarri and S. Cannistraro, Phys. Rev. E 62, 3991 (2000).
- (26) F. Venturini, P. Gallo, M.A. Ricci, A.R. Bizzarri, S. Cannistraro, J, Chem. Phys. 114, 10010 (2001).
- (27) M. Agamalian, J. M. Drake, S. K. Sinha and J. D. Axe, Phys. Rev. E 55, 3021 (1997).
- (28) P. Jedlovszky, J. P. Brodholt, F. Bruni,, M. A. Ricci, A. K. Soper and R. Vallauri, J. Chem. Phys. 108, 8528 (1998).
- (29) A. Geiger and H. E. Stanley, Phys. Rev. Lett. 49, 1749 (1982).
- (30) see for instance: M. A. Ricci, and M. Rovere, J. Phys. IV France. 10, 187 (2000) and reference therein.
- (31) P. Gallo, M. Rapinesi and M. Rovere, in preparation.