Modelling diffusion of innovations in a social network
Abstract
A new simple model of diffusion of innovations in a social network with upgrading costs is introduced. Agents are characterized by a single real variable, their technological level. According to local information agents decide whether to upgrade their level or not balancing their possible benefit with the upgrading cost. A critical point where technological avalanches display a power-law behavior is also found. This critical point is characterized by a macroscopic observable that turns out to optimize technological growth in the stationary state. Analytical results supporting our findings are found for the globally coupled case.
pacs:
87.23.Ge, 87.23.Kg, 05.65.+b, 45.70.HtThere has recently been much interest in modeling social and economical systems from a physical point of view[1, 2, 3]. Most of these studies have fallen into two classes: statistical analysis of time series and agent based microscopic models. Among the latter, most of them have been proposed in order to mimic financial markets behavior[4, 5, 6]. Despite this, several authors have, on their turn, developed models to simulate other sort of social behaviors such as the adoption of competing products[7], innovation and collaboration[8, 9] or group decision-making[10]. The main goal of all these models is to reproduce real world behavior while simplifying the theoretical models retaining as less parameters as possible.
Keeping this in mind, we have tackled the problem of diffusion of innovations in a social network. In order to understand the complex behavior of technology adoption dynamics one should consider how the stimulus for change spreads by gradual local interaction through a social network. Most of the times, these “waves” of change come in terms of intermittent bursts separating relatively long periods of quiescence, in other words, the system exhibits “punctuated equilibrium” behavior. Certainly some technologies, like cellular phones or VCR’s, seem to lurk in the background for years and then suddenly explode into mass use[11].
There are two main mechanisms involved in the diffusion of innovations in a social network that any mathematical model should take into account. On the one hand, there is a pressure for adopting a new product or technology coming from marketing campaigns and mass media. These external processes are essentially independent of the social network structure and one can view their effects as a random independent process on the individuals (hereafter called agents). On the other hand, there is the influence of the surrounding agents who define the social network. Once an agent decides to adopt a new technology, those who are in contact with him can evaluate the new payoff the agent has got from acquiring the new technology and compare it with their current benefits. This propagating mechanism stands for interpersonal, such as word of mouth, communication processes. By balancing the payoff increment with the associated upgrading cost, they may decide to adopt, or not, the new technology. In this way, the local flux of information plays a key role in diffusing new products. It is important to notice that we are not considering any compatibility constraint among the agents. Links only account for the flux of information among agents who decide to take an action or another for their exclusively own benefit.
In this letter we propose a simple model of diffusion of technological innovations with costs. In the simplest version of the model, a population of agents lie in a one-dimensional chain with periodic boundary conditions. Each agent is characterized by the real variable . This variable stands for their technological level, that is, the higher , the more advanced (technologically speaking) he is . We will assume that the payoff that an agent receives from possessing a certain technological level is simply proportional to it. The model is then simulated as follows:
(i) at each time step, a randomly selected agent updates his technological level
| (1) |
where is a random variable exponentially distributed with mean , that is, . This driving process accounts for the external pressure that may lead to a spontaneous new technology adoption by any of the population agents. In all numerical simulations shown in this letter we have used . However, all results are robust against other noise choices, as long as they have a finite variance.
(ii) all agents ( being the set of neighbors of agent ) decide whether they also want to upgrade or not, according to the following rule
| (2) |
where (cost) is a constant parameter that stands for the price an agent must pay in order to upgrade his technology as well as his personal “resistance” to change.
(iii) if any has decided to also upgrade his level, we let their neighbors also choose whether to upgrade or not. This procedure is repeated until no one else wants to upgrade, concluding a technological avalanche. Whenever an agent decides to upgrade, their neighbors become aware of the new technology and balance the profit they may obtain in case of also adopting it () with its cost . It may well happen that if the technological innovation spontaneously adopted by the seed of the avalanche is high enough compared with the cost, the avalanche may end up spanning a large portion of the population.
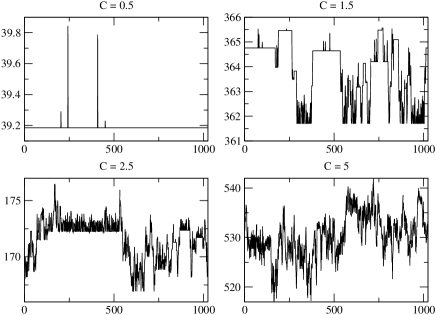
According to the cost value it is possible to distinguish several regimes. In Fig. 1 we can see some examples of the technology profile (the interface defined by the technology level of all agents) for several values of the cost . For , once there is an external random update, a system size avalanche is immediately triggered so that all agents end up sharing the same technological level, or in other words, the system is always in an almost synchronized state. For values of upgrading is so expensive that agents do not care about their neighbors technology, and large avalanches are not triggered any more (almost all avalanches are of size ). In this regime the technological profile is quite rough (actually, in the limit we should recover the random deposition model[12]). In between these two regimes, there is a region showing a rich dynamics where one finds technological avalanches of all possible sizes. Actually, for some values of the probability density of having an avalanche of size shows a power-law behavior
| (3) |
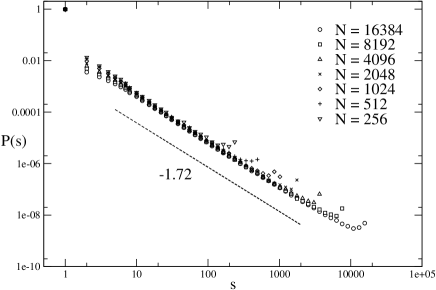
Fig. 2 shows for several system sizes and . The appearance of power-law distributed quantities is usually related to the existence of some critical point. Nevertheless, it is difficult to locate the critical point by looking at since finite-size effects provide a whole region of the parameter space where behavior is compatible with a power-law. Actually, the same problem appears in some SOC[13] models and the question of whether there is critical point or a whole critical region in some parameter space has been largely debated[14]. We need another signature of criticality that may help us in locating the critical point.
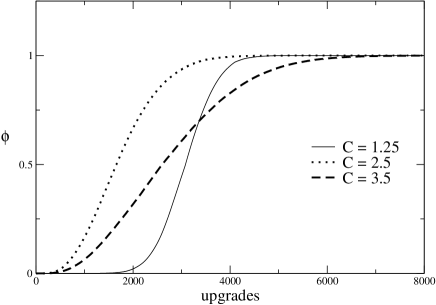
A possible answer comes from the social interpretation of the model. Social science researchers usually work with aggregated data such as the adopting curve[15], that is, the evolution in time of the total number of people who adopts a certain product or technology. Analogously, in our model we can set an arbitrary threshold and then calculate how many agents posses a technology as the upgrading process goes on. Let us label the fraction of agents with . Fig. 3 shows three adopting curves for three different values of . For large avalanches (made of a lot of agents acquiring the same new product or technology) are triggered. In this way, the technological profile advances uniformly and, the system must pay a lot of costs. This situation is clearly inefficient. In the plot this is reflected by the fact that the curve for is the last one to reach (at least one of the agents), but once it begins the whole population crosses very fast (because of the uniform advance). On the other hand, for very few avalanches are triggered, meaning that the profile grows in a very non-uniform way, and its fluctuations are quite important. That is why the curve begins crossing the threshold earlier than the case . However, it takes much more time the whole population to cross the threshold and it is clearly inefficient in terms of how many times a cost is paid. As result, there is an intermediate value of ( in the plot) where this weighted growth process is optimized and the curve is always greater than for larger and smaller cost values. That corresponds to the critical region, where avalanches of all possible sizes are triggered. In other words, there are some intermediate values that let the population reach a given average technological level with a minimum number of upgrades (and their associated costs). Therefore, we can speak of an efficient cost region leading to an optimal growth rate.
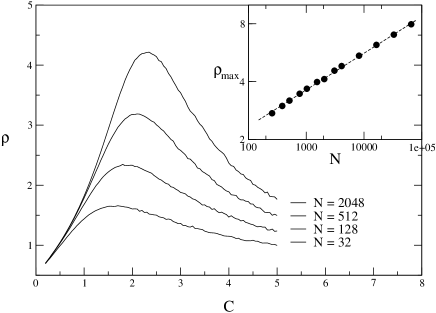
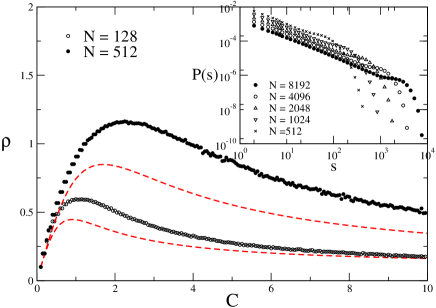
We can quantify this effect by computing the so-called mean velocity of progress[8] defined as ratio of the total technology advance and the total number of upgrades. It can also be computed as , where stands for the average total technological advance induced by an avalanche (the interface area increment caused by an avalanche) and is the average avalanche size. This quantity, , gives an idea of how fast the technological profile grows. Fig. 4 shows several plots of against for several system sizes. The first thing one can see is that has a maximum for an intermediate value of . Moreover, scales with the system size as , diverging in the thermodynamic limit . The location of allows us to define the finite size critical point of the model . A proper and detailed characterization of this critical point will be published elsewhere. It is also possible to exactly calculate the assymptotic value of . For , almost all avalanches are of the size of the system , and the total advance induced by them is, in average, . Therefore, . Moreover, for the avalanches are of unit size and advance , so that as well.
In the view of all this, one can assert that it is near the critical point where the technological profile grows more efficiently. This leads to the following paradoxal result: upgrading costs should be neither cheap nor expensive in order to have an optimal technological growth. Obvioulsy, our concept of efficiency is related to the number of times a cost is paid, that is, from the point of view of the population but not the companies who sell the products. Sellers will always look for a scenario where agents acquire as many new products as often as possible.
In order to complete our study, we have also analysed the globally coupled case, where some analytical results have been found.
In the globally coupled version of the model information about the technological level of all agents is available to any agent. Now, agents technological level is confined in a band of width since whenever there is a difference between any two agents, the one with the lowest level immediately adopts the highest technological level. Moreover, the system still displays a peak for the mean velocity of progress as Fig. 5 shows. What is, indeed, also quite amazing, is that the globally coupled case also has also a power-law avalanche probability distribution at the efficient region (Fig. 5).
In order to give an estimation of in the stationary state, let us make some mean-field assumption (that is, restricting to average values and neglecting fluctuations). Let us assume that the agents technological levels are uniformly distributed over the band of width , so that there is a density of levels . In order to keep things simple we also assume that random spontaneous updates are of fixed size . Then, there is going to be an avalanche whenever any of the agents having a technological level (where the origin has been set at the base of the band) decides to, spontaneously, adopt a new technology. This will happen with a probability every time step. The agents involved in such avalanche will be those who lie in the lowest region of the band , and, in average, half of them will take part in the avalanche, so that the number of agents involved is . These agents will advance their technological levels by . Therefore, after time steps, in average there will be avalanches and simple spontaneous updates. Now, we can calculate , the global technological advance after time steps, as well as the total number of upgrades (spontaneous and induced by the avalanches)
| (4) |
| (5) |
Then is imply given by the ratio . In terms of the adimensional variables and we find the relation
| (6) |
This formula holds whenever , otherwise the above assumptions are not valid, and one trivially finds that . Notice that in the limit we also recover . Fig. 5 shows a comparison between Eq. (6) and simulation data. Although the formula gives a correct estimation for and , there is some discrepancy near the peak of the . A plausible explanation for this is the existence of large fluctuations (as Fig. (5) shows) so that a mean-field approach only provides a crude estimation of .
Now, it is possible to study the asymptotic behavior of that results from maximizing Eq. (6). We find that
| (7) |
In the thermodynamic limit , and . Therefore, for the globally coupled case the critical point goes to infinity and diverges as .
In conclusion, we have presented a simple model of diffusion of innovations in a social network displaying rich dynamics ranging from global synchronization to critical behavior. Costs are responsible of blocking the flux of information over the network, but, at the same time, they are necessary to guarantee an optimal growth of the technology profile. In order to show this, we have computed the value of , mean velocity of progress, a quantity that is maximized at the critical point of the model. We have also analytically solved a mean-field version of the globally coupled case and showed the existence of a maximum value of that diverges in the thermodynamic limit. Also in this case, a power-law avalanche distribution leading to a critical behavior has also been found at the efficient region of the model. Therefore, one of the most interesting things of our model is that all its most intriguing features are qualitatively the same regardless of the systems connectivity.
We kindly acknowledge F. Vega-Redondo, J. J. Ramasco, M. A. Rodríguez and J. M. López for helpful comments. Financial support has been provided by DGES of the Spanish Government through grant BFM2000-0626 and EU TMR Grant No ERBFMRXCT980183. X. G. and M. Ll. also acknowledge financial support from the Generalitat de Catalunya and the MCT of the Spanish government, respectively.
REFERENCES
- [1] R. N. Mantegna and E. Stanley, An introduction to Econophysics: Correlations an Complexity in Finance (Cambridge University Press, Cambridge, England, 1999).
- [2] J. P. Bouchaud and M. Potters, Theory of Financial Risk (Cambridge University Press, Cambridge, England, 2000).
- [3] S. M. de Oliveira, P. M. C. de Oliveira, and D. Stauffer, Evolution, Money, War and Computers (Teubner, Stuttgart-Leipzig, 1999).
- [4] V. M. Eguíluz and M. G. Zimmermann, Phys. Rev. Lett. 85, 5659 (2000).
- [5] T. Lux and M. Marchesi, Nature 397, 498 (1999).
- [6] D. Challet, M. Marsili, and Y.-C. Zhang, Physica A 276, 284 (2000).
- [7] J. Goldenberg et al., Physica A 284, 335 (2000).
- [8] A. Arenas, C. J. Pérez, A. Díaz-Guilera, and F. Vega-Redondo, Phys. Rev. E 61, 3466 (2000).
- [9] A. Arenas, A. Díaz-Guilera, C. J. Pérez, and F. Vega-Redondo, J. of Economic Dynamics and Control , (In Press).
- [10] S. Galam and J.-D. Zucker, Physica A 287, 644 (2000).
- [11] P. R. Krugman, The self-organizing economy (Blackwell, Malden, Massachusetts, 1996).
- [12] A.-L. Barabási and H. E. Stanley, Fractal concepts in surface growth (Cambridge University Press, Cambridge, 1995).
- [13] H. J. Jensen, Self-Organised Criticality (Cambridge University Press, Cambridge, 1998).
- [14] S. Lise and M. Paczuski, Phys. Rev. E 63, 036111 (2001).
- [15] T. W. Valente, Social Networks 18, 69 (1996).