Electoral surveys influence on the voting processes: a cellular automata model
Abstract
Nowadays, in societies threatened by atomization, selfishness, short-term thinking, and alienation from political life, there is a renewed debate about classical questions concerning the quality of democratic decision-making. In this work a cellular automata (CA) model for the dynamics of free elections based on the social impact theory is proposed. By using computer simulations, power law distributions for the size of electoral clusters and decision time have been obtained. The major role of broadcasted electoral surveys in guiding opinion formation and stabilizing the “status quo” was demonstrated. Furthermore, it was shown that in societies where these surveys are manipulated within the universally accepted statistical error bars, even a majoritary opposition could be hindered from reaching the power through the electoral path.
S. G. Alves N. M. Oliveira Neto M. L. Martins111mmartins@mail.ufv.br
Departamento de Física, Universidade Federal de Viçosa
36571-000, Viçosa, MG, Brazil
key word: cellular automata, voting process, power laws, phase transitions
1 Introduction
During the last decades there has been a great interest in applications of statistical physics in social sciences [1, 2]. Indeed, inherently probabilistic social phenomena such as riots, wars, economic depressions, electoral landslides, and collapses of governmental coalitions seems to exhibit self-organized criticality [3]. A prime example is the observed scale-free distribution for the number of votes obtained by distinct candidates in the 1998 general elections in Brazil [4]. Among a widely range of complex dynamical systems, two classical problems, namely, opinion formation and voting processes, essential to the quality of democracy, received particular attention from physicists [5, 6, 7, 8, 9]. In particular, CA models of opinion formation in a society with a strong leader showed clustering phenomena, homogenization, and hysteresis, as observed in real social systems [5]. Furthermore, real-space renormalization methods applied to a simple model of voting process in hierarchical organizations revealed the paradoxal result that democratic elections can lead to totalitarism [8].
One of the basic prerequisites for the democracy is the electoral dispute for the power, characterized by free choices and a playfield at least moderately equilibrated. So, democracy demands a wider access of the citizens to relevant information, not only to the programs and proposals of the candidates, but also to an evaluation of their chances in the political processes. In universes marked by some electoral fragmentation and strong competitivity, it is reasonable to assume that certain choices are made, through a strategic and complex way, based on criteria that take into account both affinity and pragmatism at different degrees. Electoral surveys represent an effective tool to provide the informations needed to carry out similar political calculations. From the democratic standpoint, it is unacceptable that such possibility of evaluation should be suppressed from the citizens, assert the republican tradition and the mass media. However, due to the allegated inductive power of the electoral surveys, the citizens’ choices without them might take into account more authentic personal convictions about the candidates and proposals, advocate some others.
This democratic controversy acquires a particular relevance in Latin America which, despite its poverty and inequalities, represents a huge market for the mass media. Indeed, television networks reach more than of the homes in its most populated countries. Also, since in Latin America the reading tradition is constrained to limited social segments, the contrast between television and press is significantly greater than that observed in the developed world. Moreover, where the television is private and successful – as in Brazil and Mexico –, it is either slavish to the government or totally irresponsible. Where the television is public, it is influenced, propagandist and hardy accessible to the political opposition. In these countries the monitoring mechanisms of campaign advertisements and electoral surveys in the media are fragile or inexistent. Besides, the people education levels in Latin American nations are in general low, as was demonstrated by surveys carried out during the 1989 general elections in Brazil, which revealed that almost of the electors have only fundamental education, if so.
In the present work, we report on the simulation results obtained via a CA model designed to address basic issues concerning the effects of electoral surveys on the dynamics of democratic voting. Specifically, the following questions were investigated: 1. what role do electoral surveys play on the voting processes in societies with different levels of education? 2. Under what conditions can the “status quo” be preserved through subtle manipulations of the opinion formation mechanisms? It is worth emphasizing that we do not expect to give definitive answers to these questions or make predictions about any particular political system. Instead, we believe that the results, obtained using algorithmic models built upon precise hypotheses, simple dynamical variables and evolution rules, can be used as plausibility probes relevant to the actual events. This is the way CA or agent-based modeling can be effective tools to the advancement for the social sciences [2].
2 The model
The CA model consists of electors distributed on the sites of a square lattice with linear size and periodic boundary conditions. Every voter () can choose among one of three classical political options: left, center or right, denoted as and , respectively. In addition, each citizen has an ideology (left), (center) or (right), fixed in time. At each time step, the political preferences of all the electors are simultaneously updated. It is assumed, in agreement with the social impact theory [10], that the vote intention of each elector is influenced by the opinions of the citizens on his Moore neighborhood, including himself, and by an external field associated to the results of electoral surveys. These effects are included in a deterministic field used by every elector to make their political evaluations. The CA rules used are the following:
Rule 1: An elector subjected to a social impact updates his vote intention with probability
| (1) |
which describes the randomness affecting the process of individual opinion formation. The parameter measures the sensitivity to changes in the society. Clearly, the citizen’s current vote intention is maintained, i. e., , with the complementary probability .
The probability is a sigmoid curve that saturates at the unity for large values of and vanishes when the social impact is null. Therefore, the larger is the social impact on the elector , greater is the chance of this elector update his preference.
Rule 2: The social impact determines the local political preference evaluated by the elector . The form of depends on the elector ideology and is a function of the local information only.
For a leftist or rightist, is calculated through the expression:
| (2) |
with . The first term corresponds to the effect of electoral surveys, with being the mass media inductive power over elector and the survey result (see rule 4). The second term represents the tendency of an individual to vote according his political ideology, being his ideological strength. The last term accounts for the social neighbors influence, each one with persuasive power . It considers only the net influence due to all the leftist and rightist neighbors. So, a citizen to the left (or right) build his voting strategy comparing the local persuasive power of his ideological group and that of the opposite extreme, independently of his neighbors of center. If , the left tendency is locally majoritary and . If the right tendency dominates and . Finally, if , there is an equilibrium between the local preferences to the political extremes, the social impact on elector vanishes, and his current vote intention is maintained according to rule 1.
In turn, an elector of center compare the social impact to the extreme , given by eq.(2), with the local impact of the moderates
| (3) |
If then, as evaluated by the moderate elector , the center is majoritary, and . If then one of the political extremes is majoritary, and . Finally, if , there is no social impact on elector and, according to rule 1, his current vote intention is maintained.
Rule 3: Vote intention update: (a) an elector of center assumes the local majoritary preference indicated by . (b) A leftist always votes for the left unless the right becomes the local major tendency, case in which the elector migrates to the center. Similarly, (c) a rightist votes for the right, migrating to the center only if his evaluation of indicates the left as majoritary. In mathematical terms, the rules (a), (b) and (c) can be written as
| (4) |
where is the integer division by .
It is worth noting that the CA dynamics try to minimize the conflict between each elector and his social environment constituted by his neighbors and mass media information. However, each citizen follows distinct strategies depending on his political ideology. Electors of center vote with the majority, moving either to the left or to the right if necessary. In contrast, since individuals at the ideological extremes exhibit a limited motility in the political spectrum, they cannot minimize this conflict. Indeed, if the right is the majoritary, the leftist has a single political strategy: change his vote to the center, trying to prevent the victory of his ideological enemy, and vice-versa.
Rule 4: Electoral surveys: periodically the total number of vote intentions to left , center and right are counted. The greatest of these values defines the electoral survey result: (left), center and (right). Since the mass media does not necessarily represents a way towards a democratic government, factors , and multiplying , and , respectively, can be introduced in order to simulate possible manipulations of the electoral surveys. Thus, the case corresponds to electoral surveys without bias, whereas the set , , and introduces a bias to the right within the accepted error bars for opinion surveys.
Exposed the CA rules, some additional comments about the features and social interactions of the model are necessary. Differently from most of the previous opinion formation models, the present one does not involve binary choices since, in general, electoral processes are not constrained to two political options only. Clearly, this detail complicates the model because an Ising-like dynamics is inappropriate. The model assumes that each elector has a bounded rationality, i. e., does not have detailed global information and infinite computational power. Also, as claimed by Althusser [11], the elector ideology acquires a material character since it guides the actions (political calculations and eventual choices) executed by each voter. It is evident that citizen’s political convictions can evolve in time under the influence of multiple internal and collective factors. However, this is typically a slow dynamics if compared to the periods of electoral campaigns and thus it is reasonable to associate a fixed ideology to any voter. At last, the relevance of the mass media is evident from the fact that it became, above the parties and electoral systems, a major actor in actual contemporary politic [12].
Concerning social couplings, the persuasive power , ideological strength , and susceptibility to mass media influence are complex functions of the elector’s ideology, as assumed in eqs. (2) and (3). Indeed, at the political extremes there is some fraction of the electors that aggressively seeks to convince (high ) while strongly resisting being influenced (low , high ). In contrast, it is more probable that some moderate electors absorb information and experience persuasion (high , low ) without seeking to influence their neighbors (low ). In turn, the relative values of these parameters , and also depend on highly complex psycological and social phenomena. In societies with low education levels, decreasing political participation and where familiar, friendship and aiding relationships predominate, as in Latin America, one might conjecture an average value of greater than that of . But, in moderate societies with satisfactory levels of education, citizens’ openness to reasoned arguments, as in Europe, again the value of might be greater than in average. The opposite may happen if the society is characterized by fanaticism, exclusivism or political polarization. In summary, the interpretation of the model interactions , and , as well as their relationship, in terms of the underlying psychological and social phenomena is an open problem. Finally, the influence of mass media seems to be greater in societies where education levels are low, political alienation is high and the individualism dominates.
3 Simulational results
The initial CA configuration is composed of randomly distributed electors voting to the center, left and right with probabilities , and , respectively. For the sake of simplicity, the same probabilities were independently used to determine the fixed electors ideology . At the beginning of the simulations, the electors’ persuasive powers and ideological strengths were chosen, and fixed, from piecewise uniform probability distributions on the unitary interval. Again, for simplicity, these distributions were assumed independent of the voter’s ideology. The social sensitivity and the average value for the persuasive power of the electors were fixed and distinct tested. The simulations were performed on a lattice of linear size and the results averaged over independent samples.
The CA simulations have been implemented using the following procedure. Specified the initial configuration, the result of the electoral survey is determined according to rule 4. This result is fixed for time steps until a next survey is made. Then, all voters simultaneously evaluate, using rule 2, their local social impact. According to rule 1, if the social impact on the elector vanishes, his vote intention is maintained. Otherwise (), the voter can update his vote, with probability , applying rule 3. After visit all the electors, a new time step begins and the entire procedure (electoral surveys at , , evaluation of the social impact on each elector and application of the vote update rules) is iterated. In the simulations a period was used and thus, since electoral surveys are often broadcasted weekly, a time step corresponds to a week.
3.1 The ideological strength


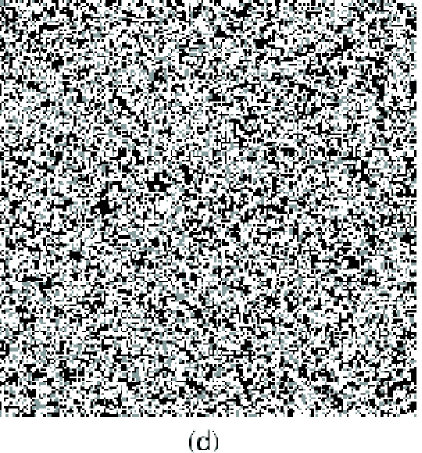
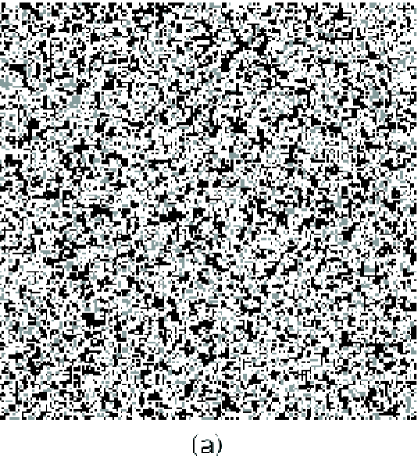
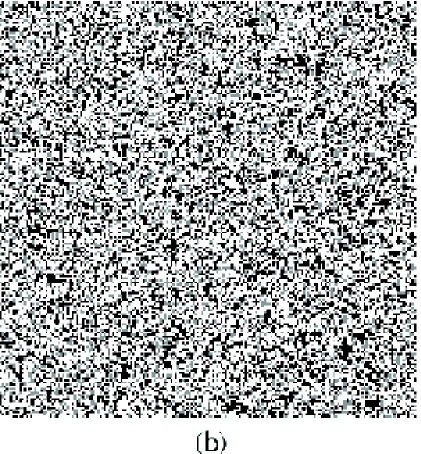
Initially, the role of the ideological strength in a society free from the mass media influence () was analysed. Figure 1 shows the temporal evolution and the stationary spatial distributions of vote intentions obtained from a random initial configuration in which , , and . As the system evolves the electors aggregate in clusters sharing a common vote intention. For small values of the majoritary group percolates the lattice, becoming less dense and non-percolating as the value of increases. In Figure 2 it is shown that, excluding the eventual percolating cluster, the cluster size distribution of the majoritary groups obeys a power law, whereas for the minoritary political groups an exponential decay can be observed. The exponents of the power laws depend on the average ideological strength . The smaller is, greater is the exponent and faster is the decay of the cluster size distribution for the majoritary tendency. In contrast, the characteristic size of the exponentially distributed minoritary aggregates seems to be independent of the ideological strength. So, agreement clustering, indicating convergence of vote intention, rises when ideological strength decreases.


The central role of the ideological strength is exhibited in Figure 3, in which the society is initially polarized between the political extremes (majoritary groups), the liberals (center) represent a minoritary fraction of the electorate, and the vote intentions are built taking into account only the local interactions among the individuals (). For a low , the conflict between the extremes can be progressively resolved via an option to the center, as shown in Figure 3a. This scenario is reminscent of the political affairs occurred in Portugal in 1974, known as the Cravos’ revolution, in which the liberals and the extremes walk rapidly towards a national political consensus of center [12]. In contrast, for a high and, therefore, constrained possibilities of conciliation, democratic elections seems to be, as shown in Figure 3b, unable to overcome the polarization between radically opposed tendencies. In such extreme situation it is often the case that the solution for the political conflict arises from a rupture of the democratic process. A noticeable historical example for this scenario was provided by the Spanish civil war [12]. Thus, in societies with high values of , dangerous situations of strong political polarization become more probable, since the extremism or fanaticism prevents the spreading of convincing arguments. It is often the case that the fanaticism can be dominant in populations with very low education levels. However, there is no simple or linear relationship between education level of the citizens and their ideological strength.


In Figure 4 it is shown the CA phase diagram for voting processes without electoral surveys (). Since the leftists and rightists has a limited motility in the political spectrum and the electors of center update their vote intention according to the majoritary preference indicated by the local social impact , it is possible to an initial minority becomes majoritary at the end of the electoral process. This possibility, i. e., the final victory of a minoritary group, depends on the average value of the ideological strength and the initial difference of vote intention between the initial majority and the largest minoritary groups. In order to demonstrate this possibility, several initial scenarios in which the majority, center, and the largest minority, left, are separated by a difference of vote intention were simulated. (Notice that there is a perfect symmetry between left and right in the CA evolution rules.) Throught these simulations the probability of an initial minoritary group wins the election was estimated. As shown in Figure 4, the initial majority (center) wins the election, with certainty , if , a critical value dependent on . Otherwise, the minority (left) is the winner. As a result, in societies where apathy, alienation and low education levels prevail, it is possible to a minority attains the political power. Our simulations suggest that these two regions are separated by a sudden transition. In contrast, if the center isthe minoritary initial group, the minority never wins the elections.
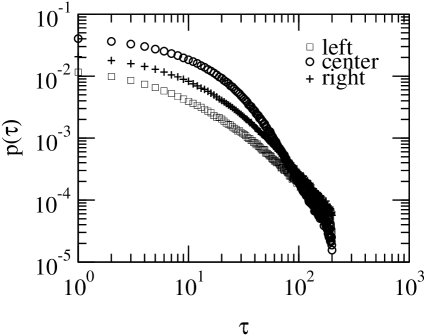
Finally, in Figure 5 the distribution of decision time is shown. is the time each elector spent to change his vote intention and it is distributed as a power law whose exponents decrease as the average ideological strength increases. These results indicate that in populations alienated from political life the electors change more rapidly and frequently their vote intention, as expected. Such power laws for the decision time were also observed in the Sznajd model of opinion formation [13] in which small sets of voters influence their nearest neighbours if and only if all of them within the given set agree. However, for the Sznajd model the exponents characterizing have a constant value .
3.2 The mass media influence
Here, the mass media influence () on the dynamics of the democratic voting is analyzed. The stationary spatial distributions of vote intentions shown in Figure 6 reveal that the density of the majoritary group is largely increased as compared to its counterpart in Figure 1. Also, as shown in Figure 7, the exponents describing the power law decays of the majoritary cluster size distributions increase significantly for both small and large values of . So, outside the larger percolating clusters, the remaining isolated clusters of the majoritary tendency have a sharper distribution. Thus, agreement clustering rises and the levels of political diversity fall sharply. Furthermore, for small the power law decay for the time each elector spent to change his vote intention is governed by greater exponents as compared to those for , meaning that the electors change more rapidly their vote intention in response to the mass media influence. Summarizing, in all societies, from low to high ideological strength , the electorate is susceptible to the effects of electoral surveys broadcasted by the mass media. Clearly, these effects are larger in societies with small , as evidenced by the faster power decay of both cluster size and decision time distributions.

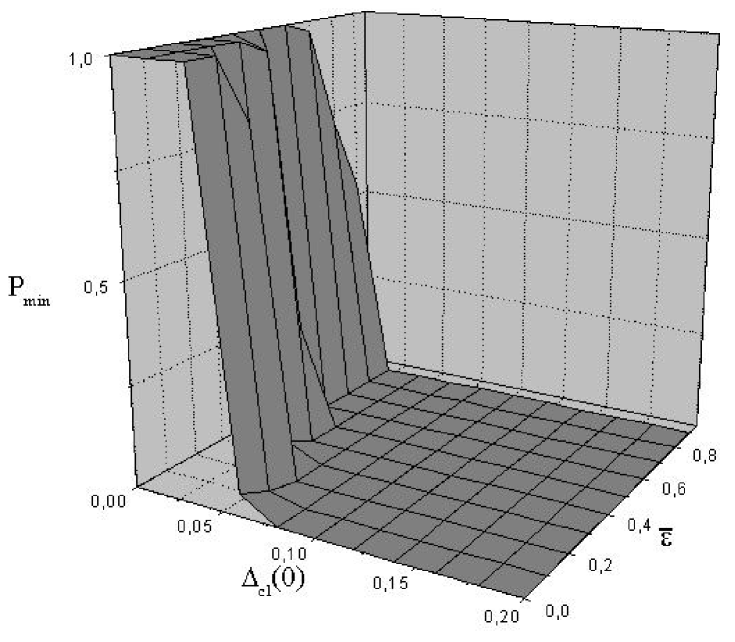
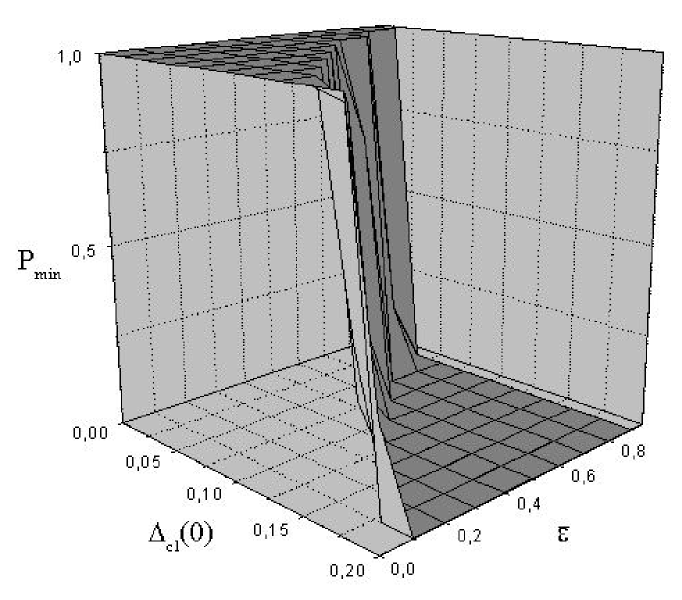
In consequence of increasing the agreement clustering, decreasing the levels of political diversity and reducing the “volatility” of electors vote intention, the free flow of information concerning current public opinion via broadcasted electoral surveys has a stabilizing effect on the political “status quo”. Indeed, as shown in Figure 8, the CA phase diagram for the voting process changes for : the possibility of victory of an initial minoritary group falls sharply if compared with the case (Figure 4). Moreover, the simulation results indicate that beyond a given threshold value the chance of a minoritary vitory vanishes. Indeed, for the phase diagram in figure 4b reduces to a flat surface everywhere. Thus, the social resistence to political changes rises significantly when external interactions associated to mass media information are allowed. In contrast, an electorate constrained to small group interactions is more openness to collectively changing its political opinion by diffusive-like propagation.
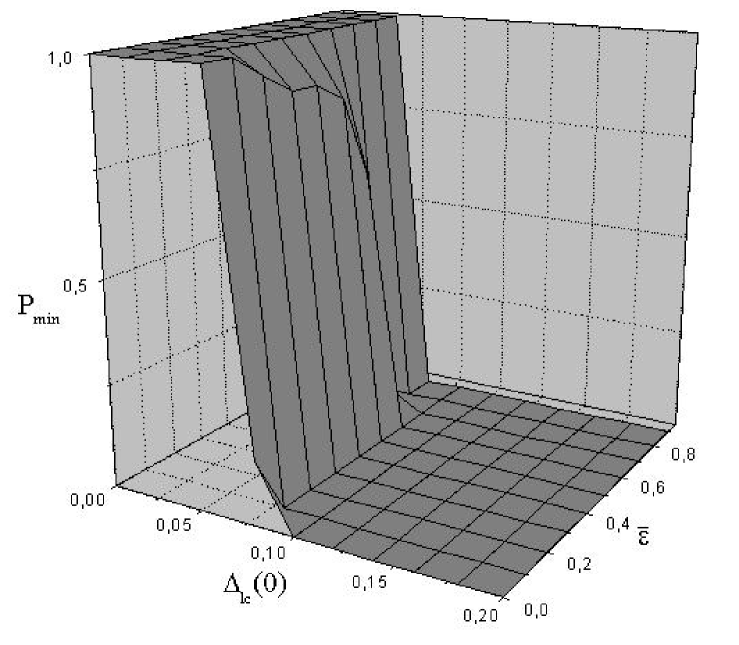
These results naturally lead to the issue: what are the effects on the voting process of broadcast manipulated electoral surveys? In order to answer this question, a scenario in which the left is majoritary, overcoming the center by an initial difference in vote intention , was simulated. As shown in Figure 9, the strategy of the minority (center) manipulate pool results —within the universally accepted statistical error bars— in its own benefit produces a paramount chance in the phase diagram of figure 4b. The region in which the minority is successfull enlarges dramatically mainly in societies where the average ideologycal strength is small. Indeed, where the minoritary victory was impossible before (), now the victory is a certainty if the initial difference in vote intention pro left is small then around . The reason is that, since the diffusive spread of arguments is difficult because the voters are unable to sustain their arguments (small ), populations with low education levels and/or significative political alienation are more susceptible to external influences reinforcing the weight of a particular group. So, by manipulating the electoral surveys, it is possible in these societies to hinder a majoritary opposition reach the power through the electoral path. In Latin America, where representative democracy was almost always deprived of meaning, manipulated electoral surveys seems to be the rule. Such unscrupulous political strategies are promptly justified: any “informed” people can not support a comunist or revolutionary government, elected or not [14]
4 Conclusions
A stochastic cellular automata model for the dynamic of democratic voting processes have been studied through computer simulations. In the model, each voter updates his vote intention according to distinct political strategies which depend on his own ideology (left, center or right) and the social impact affecting him. The social impact includes the interactions between every elector and his social neighbours, his ideological strength or capacity to sustain his choices, and the influence of mass media through the broadcast of electoral surveys.
Starting from initial disordered configurations, progressive political agreement clustering as well as complex changes in vote intention, characterized by power law distributions for the size of electoral clusters and decision time, have been obtained. In the absence of mass media influence, societies with small ideological strength, maybe associated to low education levels and/or high political alienation, exhibit smaller agreement clustering and higher diversity, allowing that dangerous situations of strong political polarization can be resolved through the voting process. In contrast, since the extremism or fanaticism prevents the spreading of convincing arguments, greater agreement clustering, smaller diversity and persisting dangerous polarizations are observed in societies with high ideological strength.
A central result of this work is the demonstration that electoral surveys play a major role in guiding opinion formation and stabilizing the “status quo”. Indeed, the possibility of victory of an initial minoritary group falls sharply if compared to the case where these surveys are absent. Moreover, in societies where these surveys are manipulated within the universally accepted statistical error bars, even a majoritary opposition can be hindered to reach the power through the electoral path. Finally, societies with low ideological strengths revealed more susceptible to the mass media influence, whereas societies with higher are unable to resolve dangerous polarization events. Therefore, the model suggests that the most desirable balance among agreement clustering, diversity levels and low susceptibility to mass media influences seems to be exhibited in the mid-range of ideological strength.
Acknowledgments: this work was partially supported by the Brazilian Agencies CAPES and CNPq.
References
- [1] Complexity, Metaphors, Models and Reality, G. A. Cowan, D. Pires, D. Meltzer, eds. (Addison-Wesley, Santa Fe, 1994).
- [2] J. M. Epstein, Complexity 4, 41 (1999), and references therein.
- [3] G. S. Brunk, Complexity 5, 26 (2000).
- [4] R. N. Costa-Filho, M. P. Almeida, J. S. Andrade Jr., and J. E. Moreira, Phys. Rev. E. 60, 1067 (1999).
- [5] K. Kaperski and J. A. Holyst, J. Stat. Phys. 84, 169 (1996).
- [6] J. A. Holyst, K. Kacperski, and F. Schweitzer, Physica A 285, 199 (2000).
- [7] D. A. Meyer and T. A. Brown, Phys. Rev. Lett. 81, 1718 (1998).
- [8] S. Galam, Physica A 285, 66 (2000).
- [9] D. H. Zanette, adap-org/9905006.
- [10] B. Latané, Am. Psychol. 36, 343 (1981); M. Lewenstein, A. Nowak, and B. Latané, Phys. Rev. A 45, 763 (1992).
- [11] L. Althusser, Essays on ideology (Verso, London, 1984).
- [12] E. Hobsbawm, Age of extremes. The short twentieth century: 1914-1991 (Pantheon Books, London, 1994).
- [13] K. Sznajd-Weron and J. Sznajd, Int. J. Mod. Phys. C 11, 1157 (2000).
- [14] J. G. Castañeda, Utopia unarmed: The Latin American left after the Cold War (Alfred A. Knopf, Inc., ,1993)