Evolution of percolating force chains in compressed granular media
Abstract
The evolution of effective force chains percolating through a compressed granular system is investigated. We performed experiments by compressing an ensemble of spherical particles in a cylindrical container monitoring the macroscopic constitutive behavior and the acoustic signals emitted by microscopic rearrangements of particles. As a novel approach, we applied the continuous damage model of fiber bundles to describe the evolution of the array of force chains during the loading process. The model provides a nonlinear constitutive behavior in good quantitative agreement with the experimental results. For a system of hard particles the model predicts a universal power law divergence of stress when approaching a critical deformation. The amplitude distribution of acoustic signals was found experimentally to follow a power law with exponent which is in a good agreement with the analytic solution of the model.
Recently, the behavior of granular materials has been extensively studied under various conditions due to their scientific and technological importance. Huge experimental and theoretical efforts have been devoted to obtain a better understanding of the global behavior of granular media in terms of microscopic phenomena which occur at the level of discrete particles [1, 2, 3, 4, 5, 6, 7]. Subjecting a confined granular packing to an uniaxial compression a rather peculiar constitutive behavior can be observed: for small strains a strong deviation from the linear elastic response can be found implying that the system drastically hardens in this regime [2, 7]. Linear elastic behavior can only be achieved asymptotically at larger deformations when the system gets highly compacted. When the external load is decreased again the system shows an irreversible increase in its effective stiffness, furthermore, under cyclic loading hysteretic behavior is obtained.
Microscopically, inside a compressed granular packing, stresses are transferred by the contact of particles. Under gradual loading conditions the particles get slightly displaced changing their contacts and the local load supported by them, which can be experimentally visualized using photoelastic materials for grains. These experiments revealed that in a compressed granular system the stresses are transmitted along the direction of the external load by force chains which can branch at the grains and form a complex network [1]. Particles lying between lines of the force network do not support any load and can even be removed from the packing without changing its mechanical properties. Increasing the external load, more and more force lines appear and they all undergo erratic changes until the system reaches a saturated state when all the particles hold typically the same load and the system behaves as a bulk material. The creation and restructuring of percolating force chains implies relative displacements of particles which can be followed experimentally by recording the acoustic waves emitted, however, up to now no such experiments have been performed systematically. Theoretically, this problem has been mainly studied by means contact dynamics simulations using spherical or cylindrical particles, and cellular automata [5, 6, 7]. Computer simulations also revealed the generation and evolution of force chains in compressed granular materials, however, the statistics of microscopic restructuring events, the emergence of the array of force chains and their relation to the macroscopic constitutive behavior remained unclarified.
In the present letter the generation and evolution of percolating force chains is studied experimentally and theoretically in granular packings subjected to an uniaxial external load. We measured experimentally the macroscopic constitutive behavior and the acoustic signals emitted by microscopic restructuring events compressing an ensemble of spherical glass bead confined in a cylinder. Based on the analogy of force lines percolating through the system and fibers of a fiber composite we propose a novel theoretical approach, namely, an inversion of the Continuous Damage Model (CDM) of fiber bundles [8, 9] to describe the stress transmission through granular assemblies. The model naturally captures the emergence and gradual hardening of force chains and provides analytic solutions for the constitutive behavior and acoustic activity as well. We also propose an efficient Monte Carlo simulation technique.
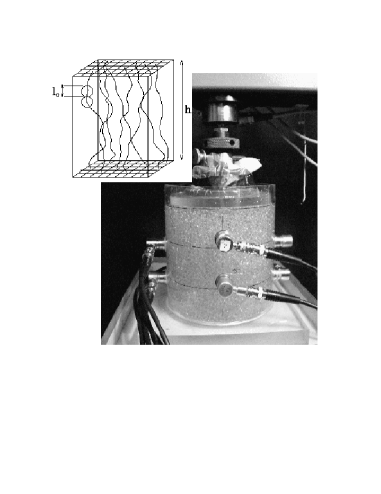
In our experiments a cylindrical container made of PMMA was filled with glass beads of 5 mm diameter and water. The cylinder has a thickness of 5 mm and a diameter of 140 mm. A punch test was carried out applying monotonically increasing displacements at the top level of the glass beads. Eight acoustic sensors were placed at the container wall to record the signals emitted during the compression of the beads, as can be seen in Fig. 1. The actual force and the displacement, measured at the traverse of the loading machine, and the acoustic signals were recorded simultaneously. An eight channel transient recorder was used as an analogue-digital converter to enable the storing of the acoustic emission waveforms and a signal-based data. Experiments were performed under strain controlled conditions at a fixed strain rate, i.e. moving the traverse at a constant speed of 1 mm/minute.
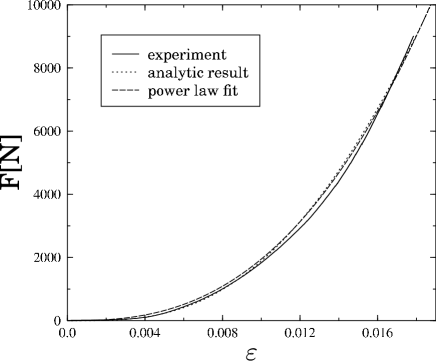
The nonlinear elastic response of the system can be observed in Fig. 2 where the measured force is presented as a function of strain imposed. A power law of an exponent 2.6 was obtained as a best fit to the measured data in reasonable agreement with former experiments of Ref. [2].
The emergence and gradual hardening of force chains is responsible on the microscopic level for the strong non-linearity observed macroscopically. To obtain information about microscopic processes, the acoustic waves emitted due to sudden relative displacements of particles were monitored. Typically several hundred signals were recorded during the experiment. The inset of Fig. 3 shows the automatically extracted peak amplitudes of the burst signals versus time. The energy is defined as the integral of the acoustic emission signal amplitude following the onset time. The energy values of the acoustic emissions are summed up in intervals of 30 seconds to elucidate the time dependent evaluation of acoustic emission activity. More details of acoustic emission data analysis and especially signal-based techniques can be found in [10, 11]. The statistics of restructuring events is characterized by the distribution of the height of peaks , which is presented in Fig. 3 on a double logarithmic plot. It can be seen that shows a power law behavior over two orders of magnitude, the exponent of the fitted straight line is .

Based on the analogy of force chains in granular packings and fibers of fibrous materials or fiber reinforced composites, we propose a novel theoretical approach, namely, an inverted fiber bundle model, to describe the gradual emergence and hardening of force chains occurring under uniaxial compression. Fiber bundles are composed of parallel fibers of identical elastic properties but stochastically distributed breaking thresholds. A fiber fails during the loading process when the local load on it exceeds its breaking threshold. Fiber failures are followed by a redistribution of load on the remaining intact fibers according to the range of interaction in the system. The so-called Continuous Damage Model introduced recently [8, 9], is particularly suited to model granular materials since it captures gradual stiffness changes of elements of the model. In our model of compressed packings, force lines formed by particles are represented by an array of lines organized in a square lattice as illustrated in the inset of Fig. 1. A randomly distributed rearrangement thresholds is assigned to each line of the array from a cumulative probability distribution , where denotes the characteristic strength of force lines. During the compression process, when the local load on a line exceeds its threshold value the line undergoes a sudden restructuring as a result of which it becomes stiffer and straighter. The lines’ stiffness increases in a multiplicative manner, i.e. the stiffness is multiplied by a factor at each restructuring so that the constitutive equation of a single line after suffering restructurings reads as . Here denotes the stiffness characterizing single particle contacts, and the exponent takes into account possible non-linearities of a single contact like for Hertz law . After each rearrangement the force chain gets a new threshold value (annealed disorder) from a distribution of the same functional form, but the characteristic strength of the distribution is increased in a multiplicative way so that after rearrangement events the disorder distribution takes the form . The maximum value of possible restructurings is proportional to the number of contacts and therefore to in the nomenclature of the inset of Fig. 1. The ratio is a very important parameter of the model, it decides whether the force chain becomes more fragile () or more ductile () as a result of restructuring. Essentially, is material dependent and determined by the stability of contacts. Calculations showed that the most interesting behavior of the model can be found when , hence, in the present letter our investigation is restricted to this case. The full complexity of the model will be explored in a forthcoming publication [12].
Experiments and discrete element simulations [1, 7] have revealed that the number of effective force chains increases during the compression process until it reaches a saturation value. To capture this effect in our model, for the number of elements we prescribe the form , where denotes the saturation number of chains, and the profile has the property with increasing . Hence, the number of force lines emerging due to an infinitesimal deformation increment from to is , where . Following the derivation of the constitutive behavior of the continuous damage model of fiber bundles [8, 9], the macroscopic constitutive equation of the compressed granular system can be cast into the form
| (2) | |||||
| (3) |
Eq. (2) takes also into account that the local strain of force lines is different from the externally imposed strain value since it also depends on the initial strain . The integral is performed over the whole loading history to take into account all the lines generated. For explicit calculations we imposed an exponential form for the number of chains. The best fit obtained to the experimental data is presented in Fig. 2 where the force is plotted against deformation . It can be seen that a good fit was achieved with physically reasonable parameter values. The maximum possible number of percolating force chains that can emerge in the system was estimated as the ratio of the total area of the container to the cross section of a single particle , i. e. . The value of the other parameters are , and . The value of falls close to one indicating that a single restructuring gives rise only to a slight increase of stiffness of a force chain. Model calculations revealed that the zero derivative at the starting part of the constitutive curve is due to the gradual creation of load bearing force chains. The small value of implies that the generation of new force chains stops at a relatively small strain value, and hence, the later rapid increase of as function of is mainly caused by the hardening of the existing force lines. Further information can be gained about the constitutive behavior for larger strains by simplifying Eq. (2) assuming a fixed number of force chains from the beginning of the process. Under this assumption Eq. (2) can be reformulated as
| (4) | |||||
| (5) |
It can be seen from Eq. (4) that if the maximum number of possible restructuring events goes to infinity the stress has finite values only for . In this case the summation can be performed in the first term, while the second term tends to zero, and the constitutive equation takes the form
| (6) |
It follows that the stress diverges when approaches a critical value , where satisfies the equation . Expanding into a Taylor series at as , and substituting it into Eq. (6) the behavior of in the vicinity of reads as
| (7) |
It means that the stress shows a power law divergence when approaches the critical value . The value of the exponent is universal; it does not depend on the form of disorder distribution , while the value of depends on it. It is interesting to note that in Ref. [6] the same power law divergence was found in large scale molecular dynamic simulations of a hard sphere system.
When the number of force lines is fixed it is possible to obtain analytic results also for the statistics of restructuring events. Restructuring occurs during the compression process when the local load on a force line exceeds its threshold value. Since loading is performed under strain controlled conditions, there is no load redistribution among existing force lines, i.e. restructuring of a force line does not affect other elements of the system. If the new threshold value, assigned to the force line after rearrangement, is smaller than the local load, the force line undergoes successive restructurings until it gets stabilized. The number of steps to reach the stable state defines the size of the restructuring event, which is the analog of the acoustic signals measured experimentally. The number of restructuring events of size starting in force chains which have already suffered restructurings can be deduced as
| (8) |
for , and
| (9) |
for (see also Ref. [9]). The number of events of size can be determined by integrating over the entire loading history and summing over all possible values
| (10) |
Finally, substituting Eqs. (8,9) into Eq. (10) and performing the calculations yields
| (11) |
i.e. the distribution of microscopic restructuring events exhibits an universal power law behavior with an exponent 1, which is completely independent on the disorder distribution. Numerical simulations revealed that the universal power law behavior also holds when the gradual creation of force chains is taken into account, i.e. when the system is described by the full Eq. (2). The statistics of restructuring events obtained by Monte Carlo simulations is presented in Fig. 4, where simulations were performed under the assumption . The inset shows local events of different sizes that occurred during the loading process, and their distribution is presented in the main figure. The power law behavior of the analytic prediction of eq. 11 is verified. It is important to emphasize that the theoretical results on event statistics (Fig. 4) are in a very good quantitative agreement with the experimental findings (Fig. 3).

Note, that the functional form and the value of the exponent of in the analytic calculations is mainly the consequence of the locality of restructurings due to the absence of load redistribution. The excellent agreement observed indicates that this is likely the microscopic mechanism responsible for the power law statistics of acoustic signals observed experimentally.
This work was supported by the project SFB381, and by the NATO grant PST.CLG.977311. F. Kun acknowledges financial support of the Bólyai János Fellowship of the Hungarian Academy of Sciences and of the Research Contract FKFP 0118/2001.
REFERENCES
- [1] C. Liu, S. R. Nagel, D. A. Schecter, S. N. Coppersmith, S. Majumdar, O. Narayan, and J. P. Witten, Science 259, 513 (1995).
- [2] T. Travers, D. Bideau, A. Gervois, J. P. Troadec, and J. C. Messager, J. Phys. A 74, 19 (1986).
- [3] B. Miller, C. O’Hern, and R. P. Behringer, Phys. Rev. Lett. 77, 3110 (1996).
- [4] H. J. Herrmann, D. Stauffer, and S. Roux, Europhys. Lett. 3, 265 (1987).
- [5] F. Radjai, M. Jean, J.-J. Moreau, and S. Roux, Phys. Rev. Lett. 77, 274 (1996).
- [6] M. D. Rintoul and S. Torquato, Phys. Rev. Lett. 77, 4198 (1996).
- [7] H. A. Makse, D. L. Johnson, and L. M. Schwartz, Phys. Rev. Lett. 84, 4160 (2000).
- [8] F. Kun, S. Zapperi, and H. J. Herrmann, Eur. Phys. J. B 17, 269 (2000).
- [9] R. C. Hidalgo, F. Kun, and H. J. Herrmann, Phys. Rev. E 64, 066122 (2001).
- [10] C. U. Grosse, H. W. Reinhardt, and T. Dahm, NDT&E Intern. 30, 223 (1997).
- [11] C. U. Grosse, B. Weiler, H. W. Reinhardt, J. of Acoustic Emission 14, 64 (1997).
- [12] R. C. Hidalgo, C. U. Grosse, F. Kun, H. W. Reinhardt, and H. J. Herrmann. unpublished (2002)