Ferroelectric Dynamics in the Perovskite Relaxor PMN
Abstract
We review results obtained from recent neutron scattering studies of the lead-oxide class of perovskite relaxors PMN and PZN. A ferroelectric soft mode has been identified in PMN at 1100 K that becomes overdamped near 620 K. This is the same temperature at which polar nanoregions (PNR) begin to form, denoted by , and suggests that a direct connection exists between the soft mode and the PNR. The appearance of diffuse scattering intensity at reported by Naberezhnov et al. lends further support to this picture. At lower temperature the soft mode in PMN reappears close to K (defined only for ). These results are provocative because the dynamics below are characteristic of an ordered ferroelectric state, yet they occur in a system that remains cubic on average at all temperatures. We discuss a coupled-mode model that successfully describes these data as well as those from earlier lattice dynamical studies of other perovskites such as BaTiO3.
1 Introduction - Soft Modes and PNR
Recent neutron scattering studies of the perovskite (O3) relaxors Pb(Mg1/3Nb2/3)O3 (PMN) and Pb(Zn1/3Nb2/3)O3 (PZN) have focused on the low-energy ( meV) lattice dynamics to determine whether or not a soft mode picture is relevant to these chemically-disordered systems. pmg_prl1 ; pmg_prb ; pmg_prl2 The answer to this question is not obvious in spite of the similarities between PMN and PZN, and the displacive ferroelectric PbTiO3, which exhibits a phase transition to a tetragonal structure at K. The occupation of the -site by either Mg2+ or Zn2+, and Nb5+ cations creates a local charge imbalance, and gives rise to rapidly varying random fields. ye Therefore anomalies in the lattice dynamics of both PMN and PZN are to be expected. Of particular interest is the role played by the polar nanoregions (PNR), which for PMN form between 600 and 650 K. burns Given their polar nature they ought to couple strongly to polar phonon modes, including any soft modes if present, in the relaxors PMN and PZN.
The existence of a soft transverse optic (TO) phonon mode has been documented in numerous perovskites including PbTiO3, BaTiO3, SrTiO3, and KTaO3. In the case of PbTiO3, the frequency of the lowest-lying TO mode drops when cooled from high temperature and condenses at the (first-order) transition temperature K, transforming the system into a tetragonal state. shirane Unlike those in other perovskites, the soft mode in PbTiO3 is well defined except for a limited range of reduced wave vectors . The zone center mode is, however, rather broad and well defined only at temperatures far above . shirane
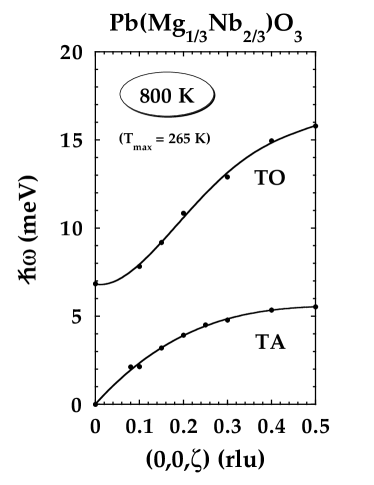
Pioneering lattice dynamical studies were carried out by Naberezhnov et al. on PMN from 300 K to 900 K. naberezhnov Fig. 1 shows the TO and TA phonon dispersions for PMN measured at 800 K around (221). A well defined zone center TO mode is observed at this temperature. However, it was identified as a hard TO1 mode in this study because its structure factor was inconsistent with those obtained from neutron diffuse scattering measurements by Vakhrushev et al. vakhrushev95 Prior Raman scattering studies had also found no evidence of a soft mode in PMN. Siny
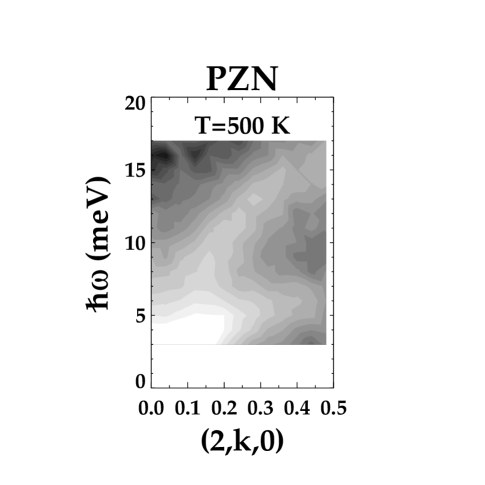
Subsequent experiments by Gehring et al. were done on PZN and PZN doped with 8% PbTiO3 (PZN-8%PT) for which large good quality single crystals were readily available. Fig. 2 combines a series of constant- spectra measured on a 4.2 gm single crystal of PZN at 500 K, nearly 100 K above , into a greyscale contour plot (see reference for experiment details). pmg_prb These data show an unusual feature in which the TO branch appears to drop into the TA branch around a of just under 0.15 reciprocal lattice units (1 rlu = 1.545 Å-1), which is a measure of the average size of the PNR. This anomaly, termed “the waterfall” because of its vertical appearance, occurs as a result of a -dependent damping in which the TO phonon mode becomes increasingly damped with decreasing wave vector , i. e. increasing wavelength. No phonon peaks are observed in constant- scans for near the zone center, which indicates that these TO modes are overdamped. Thus the waterfall feature is not a true dispersion because the scattering does not come from propagating modes. The waterfall is seen in PMN as well as in solid solutions of both PZN and PMN and PbTiO3 (PZN-PT and PMN-PT), suggesting it may be common to all relaxor systems. koo ; gop
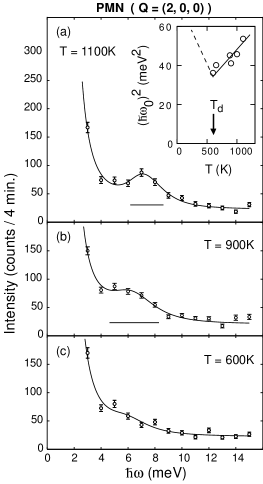
In comparison to PbTiO3, these results on PZN reveal the presence of a new damping mechanism that effectively freezes out the longest-wavelength TO modes and produces the unusual waterfall feature. The PNR are the most plausible cause of this damping. To test this idea would require heating the PZN crystal to temperatures well in excess of K where the PNR are no longer present. Because this was deemed too close to the decomposition temperature of PZN, this experiment was performed on PMN, for which K as first determined by the optical measurements of Burns and Dacol. burns As was the case in PZN, an overdamped response was observed in PMN at at 500 K. However the data in Fig. 3 show unambiguous evidence of a well defined peak at at 1100 K that softens upon cooling. At the same time the mode becomes increasingly damped (broader energy linewidth). Within experimental uncertainty the soft mode becomes overdamped at , thereby establishing a definite connection between it and the PNR. Equally interesting is the fact that the square of the zone center TO mode energy varies linearly with temperature () as shown in the inset. This is the hallmark of a ferroelectric soft mode. While the softening of this mode is clear, the uncertainties in the data obtained from this small 0.1 cm3 sample do not permit a reliable determination of , which should be close to 400 K. viehland Data obtained on a much larger crystal (0.4 cm3) are discussed in a later section and are combined with the data shown in Fig. 3 (see Fig. 5).
2 The Connection to the PNR
If the PNR are in fact the result of the condensation of the soft TO mode in PMN, then the ionic displacements that characterize the diffuse scattering intensities below must be consistent with those that characterize the soft mode above . In particular, since the ionic motions associated with the zone center TO vibrational mode cannot shift the center of mass of the PMN unit cell, the static displacements observed below must also satisfy this constraint. But they do not. Vakhrushev et al. measured the neutron diffuse scattering intensities near 16 reciprocal lattice points on a single crystal of PMN, and obtained the following relative ionic displacments (normalized such that ): , , . vakhrushev95 These displacements do not satisfy the center-of-mass constraint. Yet if one believes that the static and dynamic ionic displacements are related to the same polar state, then one is faced with an unavoidable discrepancy that must be resolved.
This apparent contradiction was recently resolved by Hirota et al. who noticed that if a uniform shift of the proper magnitude were subtracted from each of the ionic displacments, then the remaining displacements satisfied the center-of-mass constraint. In other words, for each ion they assumed , where is the ionic index. Using this model, the size of the uniform shift was determined to be , assuming an average oxygen displacement of . The corresponding values for the are: , , . hirota
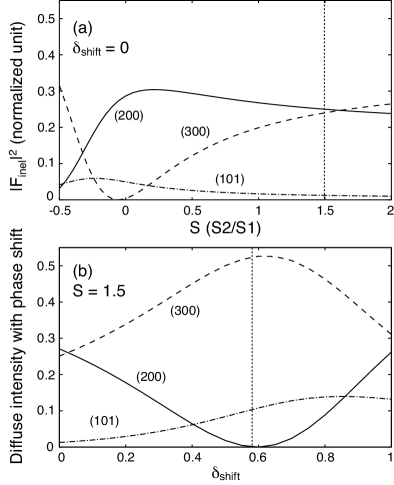
Calculations of both the inelastic and diffuse scattering structure factors were made using these values. Fig. 4 (a) shows the calculated intensities of the TO phonon mode at the (101), (200), and (300) reciprocal lattice points as a function of the ratio of the Slater () and Last () modes. harada Inelastic scans measured at (200) and (300) (see Fig. 6) fix the value of close to 1.5, consistent with that for PbTiO3. Fig. 4 (b) shows the corresponding diffuse scattering intensities for this value of as a function of the single parameter . Agreement with experiment, which indicates extremely little diffuse scattering around (200), is obtained precisely at . Because of the uniform shift , the PNR are said to result from a “phase-shifted condensed soft mode.” The shift of the PNR is along their respective polar directions.
3 Ferroelectric Dynamics in PMN below
Above K PMN exhibits dynamical properties characteristic of a normal ferroelectric in its cubic phase that are surprisingly similar to those observed in PbTiO3. The formation of PNR below appear to stifle the propagation of long-wavelength polar TO modes due to their finite size. The concurrent development of diffuse scattering intensity at , first observed by Naberezhnov et al. naberezhnov , is consistent with the picture of PNR condensing from the soft TO mode. Yet PMN is reported to remain cubic on average at all temperatures (at least down to 5 K). mathan On the other hand, it is known that a macroscopic ferroelectric phase can be induced in PMN by cooling it in a small electric field. After removal of this field, the ferroelectric state in PMN is lost via a first-order transition when heated above K. ye2 ; ye3 Therefore the lattice dynamical studies of PMN were extended to low temperature, placing special emphasis on the temperature region near .
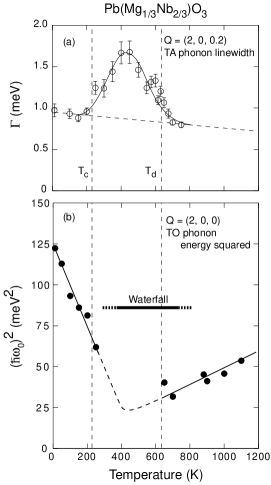
Fig. 5 summarizes recent neutron inelastic scattering results obtained by Wakimoto et al. on a large 0.4 cm3 single crystal between 10 and 750 K. wakimoto By far the most remarkable feature is the recovery and subsequent behavior of the soft mode where below shown in Fig. 5 (b) that is typical of many ferroelectrics in their ordered states. This implies that a phase transition from the relaxor state to a low-temperature, short-range ordered ferroelectric state, occurs at in the absence of an applied field. But this contradicts the average cubic symmetry of PMN. However, if the length scale of the ferroelectric order were Å, then one could plausibly resolve this contradiction since this length scale would appear as long-range order in neutron phonon measurements, but short-range order to x-rays. Indeed, regions of ferroelectric order Å in size have been reported by de Mathan et al. mathan Hypersonic damping Tu and Raman scattering Siny studies have also reported anomalies at or near , as has a change in the topology of the PNR, Vakhrushev , all of which lend support to the idea of a low-temperature ferroelectric state in PMN. It is interesting to note that in a zone center mode is observed at low (25 K) temperature in PZN at essentially the same energy as that found in PMN (10.5 meV). pmg_prb
Fig. 5 (a) shows an anomalous damping of the TA mode that coincides with the overdamping of the soft mode and the appearance of the PNR at . This suggests a non-uniform distortion of the lattice which then vanishes below , ostensibly when the short-range ordered ferroelectric phase is established. A similar TA broadening has also been observed in PMN-20%PT by Koo et al. koo
4 Mode Coupling Analysis
The scattering cross section used to fit these inelastic data is based on the coupled-mode description first used by Harada et al. to fit asymmetric phonon lineshapes observed in BaTiO3. harada2 Typical data measured in two different zones, (200) and (300), and taken above at 690 K, are shown for PMN in Fig. 6. The coupled-mode cross section is parametrized by a coupling-constant , along with inelastic structure factors and for the coupled TO and TA modes, respectively. Additional parameters are the phonon energies and , and the linewidths and . All of these parameters were allowed to float freely between the two scans. The values for the TA and TO phonon energies were identical to within 0.1 meV between (200) and (300), as required, with meV, meV, and represent a useful cross check of the integrity of the data. However the ratio of the dynamic structure factors is markedly different in each zone. At (200) the ratio is 2.3, whereas at (300) it is 27.5, nearly an order of magnitude different. The coupling constant has nearly the same absolute value in each zone (-14.1 versus 17.6 for (200) and (300) respectively), but opposite sign. Physically this is due to a sign change in the TO structure factor , not .
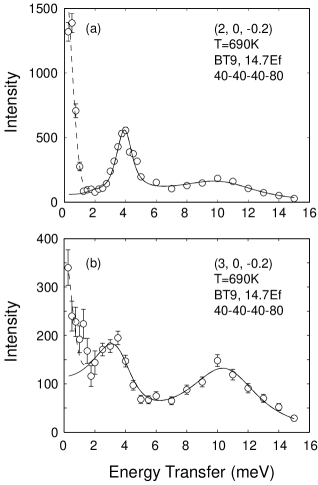
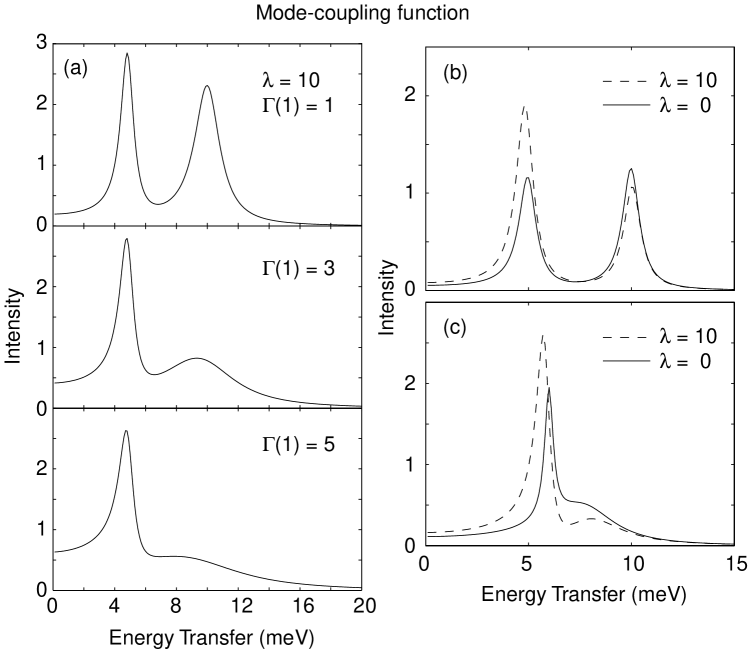
Fig. 7 conveys the manner in which the coupled-mode cross section varies with the TO mode linewidth (corresponding to an increased damping), as well as with a change in . This cross section gives an excellent model description, shown in panel (a), of the -dependent damping observed in both PZN and PMN below . Two cases are presented in panels (b) and (c) following Bullock et al. bullock Panel (b) corresponds to well-separated TA and TO modes with energies of 5 and 10 meV, respectively, and identical linewidths of 1 meV. Panel (c) corresponds to TA and TO modes with energies of 6 and 8 meV, and substantially different linewidths of 0.5 and 4 meV, respectively, such that there is substantial spectral overlap. bullock In both cases there is a clear transfer of spectral weight from the TO mode to the TA mode when the mode coupling is turned on ().
5 Conclusions
We have given a brief overview of the lattice dynamics of PMN and PZN. In PMN a well-defined soft mode is observed at 1100 K that becomes increasingly damped upon cooling, and eventually becomes overdamped at . The overdamping of the soft mode and the appearance of the diffuse scattering both at strongly point to a direct connection between the soft mode and the PNR. The resolution of the discrepancy between the static and dynamic structure factors using the “phase-shifted condensed soft mode” model of Hirota et al. provides a convincing framework in which this connection can be understood. The damping of the soft mode that is present at temperatures above is believed to be a result of the fact that the PNR exist as dynamical entities at higher temperature.
The soft mode dynamics of PMN below are characteristic of an ordered ferroelectric phase, and stand in contrast to the average cubic structure reported for PMN. The assumption of short-range order ( Å) can be used to reconcile these two sets of experimental observations. At all temperatures, a coupled-mode cross section, properly convolved with the instrumental resolution function, provides an excellent description of the neutron inelastic data.
A very different interpretation of the soft mode dynamics in PMN has recently been proposed by Vakhrushev and Shapiro vs in which the existence of a soft “quasi-optic” (QO) mode, distinct from the zone center TO mode, is claimed to explain the observed Curie-Weiss behavior of the dielectric susceptibility above . The QO-mode is derived from a mode-coupling analysis of neutron inelastic lineshapes measured between 490 and 880 K, and is attributed to the intrinsic chemical disorder of PMN. More studies of PMN at higher resolution are clearly needed to reconcile these different points of view.
References
- (1) P. M. Gehring, S.-E. Park, and G. Shirane, Phys. Rev. Lett. 84, 5216 (2000).
- (2) P. M. Gehring, S.-E. Park, and G. Shirane, Phys. Rev. B 63, 224109 (2000).
- (3) P. M. Gehring, S. Wakimoto, Z.-G. Ye, and G. Shirane, Phys. Rev. Lett. 87, 277601 (2001).
- (4) See review article, Z.-G. Ye, Key Engineering Materials Vols. 155-156, 81 (1998).
- (5) G. Burns and F. H. Dacol, Solid State Commun. 48, 853 (1983).
- (6) G. Shirane, J. D. Axe, and J. Harada, Phys. Rev. B 2, 155 (1970).
- (7) A. Naberezhnov, S. Vakhrushev, B. Doner, D. Strauch, and H. Moudden Eur. Phys. J. B 11, 13 (1999)
- (8) S. B. Vakhrushev, A. A. Naberezhnov, N. M. Okuneva, and B. N. Savenko, Phys. Solid State 37 1993 (1995).
- (9) I. G. Siny, S. G. Lushnikov, R. S. Katiyar, and E. A. Rogacheva, Phys. Rev. B 56, 7962 (1997).
- (10) T.-Y. Koo, P. M. Gehring, G. Shirane, V. Kiryukhin, G. Lee, and S.-W. Cheong, cond-mat/0110531, accepted by Phys. Rev. B (in press).
- (11) D. La-Orauttapong, B. Noheda, Z.-G. Ye, P. M. Gehring, J. Toulouse, D. E. Cox, and G. Shirane, cond-mat/0108264, accepted by Phys. Rev. B (in press).
- (12) D. Viehland, S. J. Lang, L. E. Cross, and M. Wuttig, Phys. Rev. B 46, 8003 (1992).
- (13) K. Hirota, Z.-G. Ye, S. Wakimoto, P. M. Gehring, and G. Shirane, cond-mat/0109386 (Phys. Rev. B in press).
- (14) J. Harada, J. D. Axe, and G. Shirane, Acta Cryst. A 26, 608 (1970).
- (15) N de Mathan, E. Husson, G. Calvarin, J. R. Gavarri, A. W. Huwat, and A. Morell, J. Phys. Condens. Matter 3, 8159 (1991); P. Bonneau, P. Garnier, G. Calvarin, E. Husson, J. R. Gavarri, A. W. Hewat, and A. Morell, J. Solid State Chem. 91, 350 (1991).
- (16) Z.-G. Ye and H. Schmid, Ferroelectrics 145, 83 (1993).
- (17) G. Calvarin, E. Husson, and Z.-G. Ye, Ferroelectrics 165, 349 (1995).
- (18) S. Wakimoto, C. Stock, R. J. Birgeneau, Z.-G. Ye, W. Chen, W. J. L. Buyers, P. M. Gehring, and G. Shirane, cond-mat/0112366, submitted to Phys. Rev. B.
- (19) C.-S. Tu, V. Hugo Schmidt, and I. G. Siny, J. Appl. Phys. 78, 5665 (1995).
- (20) S. Vakhrushev, A. Naberezhnov, S. K. Sinha, Y. P. Feng, and T. Egami, J. Phys. Chem. Solids 57, 1517 (1996).
- (21) J. Harada, J. D. Axe, and G. Shirane, Phys. Rev. B 4, 155 (1971).
- (22) M. Bullock, J. Zaretsky, C. Stassis, A. Goldman, P. Canfield, Z. Honda, G. Shirane, and S. M. Shapiro, Phys. Rev. B 57, 7916 (1998).
- (23) S. B. Vakhrushev and S. M. Shapiro, cond-mat/0203103.