Revealing Superfluid–Mott-Insulator Transition in an Optical Lattice
Abstract
We study (by an exact numerical scheme) the single-particle density matrix of ultracold atoms in an optical lattice with a parabolic confining potential. Our simulation is directly relevant to the interpretation and further development of the recent pioneering experiment [1]. In particular, we show that restructuring of the spatial distribution of the superfluid component when a domain of Mott-insulator phase appears in the system, results in a fine structure of the particle momentum distribution. This feature may be used to locate the point of the superfluid–Mott-insulator transition.
pacs:
PACS numbers: 03.75.Fi, 05.30.Jp, 67.40.-wThe fascinating physics of the superfluid–insulator transition in a system of interacting bosons on a lattice has been attracting constant interest of theorists during recent years [2, 3, 4, 5, 6, 7, 8, 9]. Lattice bosons is one of the simplest many-body problems with strong competition between the potential and kinetic energy, and a typical example of the quantum phase transition system. One of its great advantages is the possibility to study it by powerful Monte Carlo methods which nowadays allow simulations of many thousands of particles at low temperature with unprecedented accuracy (see, e.g., [9]). However, until very recently the canonical Bose-Hubbard model
| (1) |
(where creates a particle on the site , stands for the nearest-neighbor sites, , and , , and , are the hopping amplitude, the on-site interaction, and the on-site external field, respectively) was not particularly useful in the analysis of realistic systems. The situation has changed with the exciting success of the experiment by Greiner et al. [1] (originally proposed by Jaksch et al. [10]) in which a gas of ultracold 87Rb atoms was trapped in a three-dimensional, simple-cubic optical lattice potential. The uniqueness of the new system is that it is adequately described by the Bose-Hubbard Hamiltonian [10, 1], and allows virtually an unlimited control over the strength of the effective interparticle interaction and particle density.
The characteristic feature of the experimental setup of Ref. [1] is the presence of the overall parabolic potential which confines the sample. This feature could be of great advantage if one was able to directly measure the spatial density distribution in the trap. We recall the structure of the phase diagram for the Bose-Hubbard system [2] which predicts commensurate particle density distribution for the insulating phase whenever the chemical potential lies within the Mott-Hubbard gap. The slowly varying (at the length scale of the lattice period) trapping potential effectively provides a scan over of this phase diagram at a fixed value of .
Unfortunately, what is measured in the experiment is not the original spatial density distribution in the trap, but the absorption image of the free evolving atomic cloud, after the trapping/optical potential is removed; i.e. the quantity which is directly related to the the single-particle density matrix in momentum space, . [This statement implies that in the free evolving atomic cloud the interparticle interaction can be neglected; see the discussion below.] Now, in terms of the inhomogeneous trapping potential is a disadvantage since it broadens the superfluid -functional contribution at , and the observed picture is a convolution of the original real-space density matrix . As we show below one has then to look at the fine-structure of the central peak in the experimental data to decipher the Mott-Hubbard phase diagram (the “fading” of the Bragg peaks in the experiment has very little to do with the superfluid–Mott-insulator transitions and happens when the system is already deep in the insulating phase).
In this Letter we relate quantitatively the particle distribution in momentum space observed in experiments to the corresponding spatial density distribution in the trap. Our ultimate goal is to reveal which features (if any) in the structure of indicate unambiguously the presence of the Mott phase. To this end we perform quantum Monte Carlo simulations of the single-particle density matrix for the Bose-Hubbard systems with up to lattice sites using continuous-time Worm algorithm [11]. We find that the onset of the phase transition in the trap center should result in appearance of at least one satellite peak in , reflecting a shell-type form of the superfluid component. This peak was not mentioned in the experiments of Ref. [1]. We suggest a possible explanation to this fact, and argue that by collimating the expanding atomic cloud one can render this peak observable. We also discuss the role of self-repulsion in the free expanding cloud, which can affect the simple interpretation of the absorption images in terms of the initial single-particle momentum distribution.
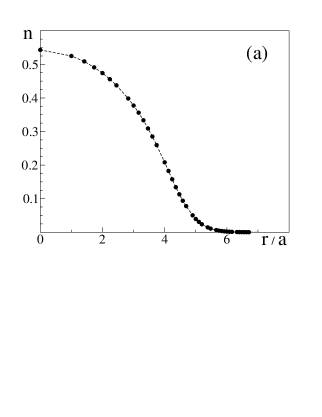
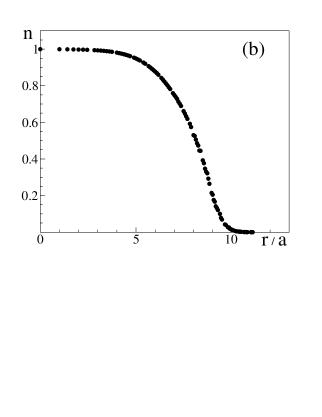
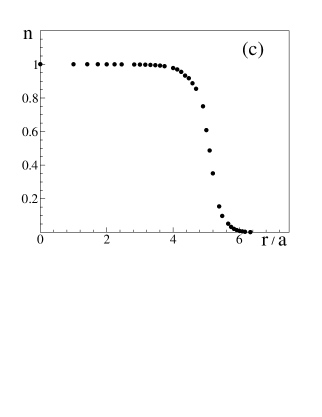
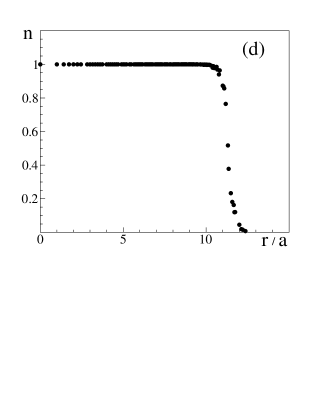
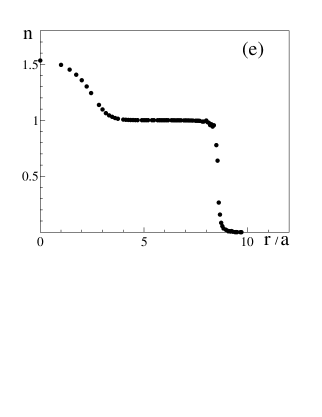
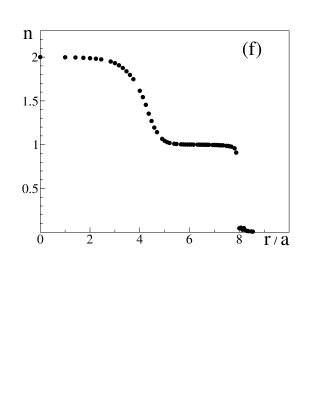
In Figs. 1(a-f) we present our data for the density distribution as function of the lattice cite distance from the trap center, , where is the lattice constant. For all practical purposes one may assume the zero-temperature limit here. The simulation was done at finite but very low ; the relevant energy parameters in this model are the bandwidth and [3, 4]. In accordance with the phase diagram of Ref. [2], we observe a shell-type structure of the particle density with the Mott-insulator phases visible as integer plateau regions.
Next, we relate each of the above figures to the corresponding momentum distribution function . By definition, , where , and is the bosonic field operator. In our case of a single-zone lattice, the field operator is expanded as follows:
| (2) |
where is the Wannier function. We thus finally have
| (3) |
where
| (4) |
and is the Fourier transform of . From Eq. (3) it is seen that up to a trivial reweighting factor the distribution is a periodic function in the reciprocal lattice. Thus without loss of generality we may restrict ourselves to the first Brillouin zone. Actually, has nothing to do with the Bose-Hubbard model, being a non-universal property of the lattice cite potential; in what follows we will ignore this function altogether by formally setting it to unity.
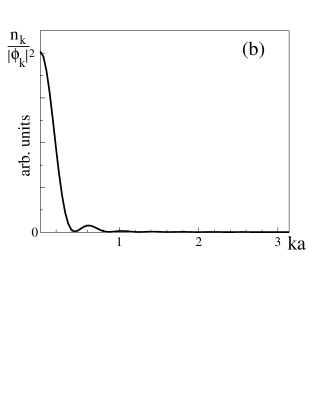
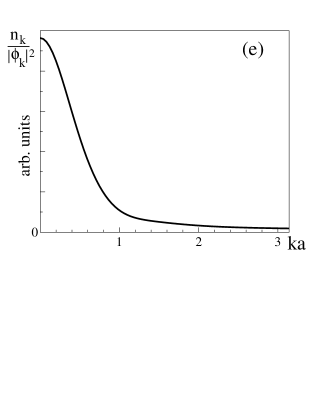
Having calculated with the Worm algorithm [11], we readily obtain using Eq. (3); the results are presented in Figs. 2(a-f). In Fig. 2(a) we see a typical picture for the strongly correlated superfluid phase, characterized by a single, narrow peak at small momenta. When a domain of the Mott-insulating phase appears in the center of the trap (where the on-site filling is close to unity), a pronounced fine structure develops in Fig. 2(b). We associate this structure with the shell-type form of the condensate wave-function. To prove the point we model the situation with the pure-condensate density matrix , where the condensate wave-function has the shell-type form with the shell radius . The presence of the Mott insulator is taken into account through the suppression of the in the center. The Fourier transform of such is alternating in sign, with the half-period in related to the shell radius as . Thus in the pure condensate we would see exact zeros in with the typical separation between them . Surprisingly, this naive model works extremely well and adequately describes the case of the realistic strongly correlated system close to the phase transition (in Fig. 2(b) the coupling is close to the critical value estimated in Refs. [3, 4]). We consider the appearance of the satellite peaks as a clear signature of the Mott-insulator transition in the center of the trap.


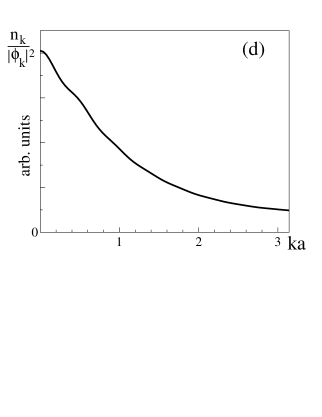

In Fig. 2(c) the coupling strength is significantly increased to , but the shell-type structure of the superfluid phase, and the corresponding fine-structure in , is still present. The crucial difference between Fig. 2(c) and Fig. 2(d) is in the suppression (almost complete) of the superfluid fraction. Now the distribution has only the central peak and is extended towards large momenta, as expected for the system deep in the insulating phase. Still, it is not flat (!), which tells us about large off-diagonal correlations between the nearest lattice cites even for as large as .
Fig. 2(e) is similar in physics to the case (a), except for the large-momentum tail due to the Mott-insulator shell. Finally, in Fig. 2(f) we again see the fine structure of satellite peaks reflecting the appearance of the Mott-insulator phase in the center of the trap and the corresponding superfluid phase shell [in close resemblance with Fig. 2(b)].
We note, that momentum distributions presented above, may be observed experimentally if atoms are collimated out of the expanding cloud so that the distribution in a given direction is photographed. In the current setup, the absorption images of the three dimensional distribution are taken along two orthogonal axis. This procedure reveals only the integral . It is easy to see that integration effectively erases fine-structure features of —although peaks do not disappear completely, they now show up as shoulders in .
Finally, we would like to discuss the problem of the repulsive interaction between particles during the initial period of their free expansion. Obviously, the interpretation of the final absorption pattern in terms of the initial momentum distribution is valid only if the effect of this interaction is small enough. Meanwhile, given realistic experimental parameters, this turns out to be the case only for rather moderate system sizes. The criterion for neglecting the effect of interparticle repulsion is
| (5) |
where and are, respectively, the kinetic and potential energy per particle in the most fragile low-momentum part of the distribution and at the most dangerous period of free evolution at the end of the restructuring period, when the “discrete” distribution of density transforms into the “continuous” spatial distribution with the typical size of order of the original system size (plus the corresponding replicas in higher Brillouin zones). For the potential energy we have , where is the continuous number density, , is the -scattering length, and is the atom mass. Recalling that the lattice filling factor is of order unity, we can estimate . The lowest kinetic energy is associated with the spatial distribution of the condensate. Estimating , where integer stands for the typical size of the superfluid component in units of lattice constants, we arrive at a simple requirement
| (6) |
In the experiment of Ref. [1], the ratio is of order . Hence, we are restricted to , that is to typical system sizes of our present simulation. Note also, that the condition (5) is much easier to satisfy for the atomic cloud in the second Brillouin-zone peak, where the spatial density is significantly suppressed [1].
Summarizing, we presented a simulation of the ground state properties of ultracold atoms in an optical lattice with confining external potential, in the regime where the Mott-insulator and superfluid phases coexist. We have demonstrated that when the insulator domain in the center of the trap is surrounded by the superfluid component, the global momentum distribution of particles features satellite peaks. This picture can be employed by the experiment as an unambiguous evidence of the Mott transition. We do not see other features of the momentum distribution that could be associated with the Mott transition: unless the ratio is not much larger than the critical one, the momentum distribution in the reciprocal lattice still has a peaked form reflecting strong local off-diagonal correlations.
This work was supported by the National Science Foundation under Grant DMR-0071767. BVS acknowledges a support from the Russian Foundation for Basic Research (RFBR) under Grant 01-02-16508 and from the Netherlands Organization for Scientific Research (NWO). VAK acknowledges a support from RFBR under Grant 00-02-17803. We acknowledge helpful discussions with H. Monien and Yu. Kagan.
REFERENCES
- [1] M. Greiner, O. Mandel, T. Esslinger, T.W. Hänsch, and I. Bloch, Nature, 415, 39 (2002).
- [2] M.P.A. Fisher, P.B. Weichman, G. Grinstein, and D.S. Fisher, Phys. Rev. B, 40, 546 (1989).
- [3] K. Sheshadri, H.R. Krishnamurthy, R. Pandit, and T.V. Ramakrishnan, Europhys. Lett. 22, 257 (1993).
- [4] J.K. Freericks and H. Monien, Europhys. Lett. 26, 545 (1994); Phys. Rev. B, 53, 2691 (1996).
- [5] G.G. Batrouni, R.T. Scalettar, and G.T. Zimanyi, Phys. Rev. Lett. 65, 1765 (1990).
- [6] P. Niyaz, R.T. Scalettar, C.Y. Fong, and G.G. Batrouni, Phys. Rev. B, 50, 362 (1994).
- [7] N.V. Prokof’ev and B.V. Svistunov, Phys. Rev. Lett. 80, 4355 (1998).
- [8] F. Hébert, G.G. Batrouni, R.T. Scalettar, G. Schmid, M. Troyer, and A. Dorneich, Phys. Rev. B 65, 014513 (2002).
- [9] G. Schmid, S. Todo, M. Troyer, and A. Dorneich, cond-mat/0110024.
- [10] D. Jaksch, C. Bruder, J.I. Cirac, C.W. Gardiner, and P. Zoller, Phys. Rev. Lett. 81, 3108 (1998).
- [11] N.V. Prokof’ev, B.V. Svistunov, and I.S. Tupitsyn, Phys. Lett. A 238, 253 (1998); JETP 87, 310 (1998).