Theoretical Study of Magnetism and Superconductivity in Transition -Metal- Alloys
Abstract
We have studied the electronic structure of transition-metal- alloys, , using Korringa-Kohn-Rostoker coherent-potential approximation (KKR-CPA) method in the atomic-sphere approximation (ASA). For unpolarized calculations, our results for alloys are similar to that of impurities in other and metals. In particular, the local densities of states (DOS) associated with the impurities are similar to our earlier work on impurities in bulk [P. P. Singh, Phys. Rev. B 43, 3975 (1991), P. P. Singh, J. Phys.: Condens. Matter 3, 3285 (1991)]. For spin-polarized calculations, we find only the alloys of and with to be magnetic of all the elements. We also find that and in have a relatively large local magnetic moment of and , respectively. We have used the unpolarized, self-consistent potentials of alloys, obtained within the coherent-potential approximation, to calculate the electron-phonon coupling constant using the Gaspari-Georffy formalism and the superconducting transition temperature using the Allen-Dynes equation. We find that the calculated is the lowest for and the highest for , in qualitative agreement with experiment. The calculated trend in variation of from to is also similar to the available experimental data. Our analysis of the variation in , in terms of the DOS and the spectral function along to direction, shows the variation to be an interplay between the total DOS at the Fermi energy and the creation/removal of states along to direction [P. P. Singh, cond-mat/0201093].
pacs:
74.25.Jb, 74.70.AdI. Introduction
The nature of interaction responsible for superconductivity in nag ; bud ; hin ; tak ; rev ; yil ; kor ; an1 ; kon ; boh ; pps1 ; med ; sat ; bel ; liu ; cho suggests a gradual decrease in the superconducting transition temperature, , upon addition of impurities xia ; zha ; kaz ; mor with increasing electron/atom ratio. A systematic increase in the number of available electrons is expected to fill up the holes in , which are coupled strongly to the in-plane bond-stretching mode of , and thereby reduce the strength of the electron-phonon coupling resulting in a decrease in . The observed variation in of alloys of with and its understanding in terms of a gradual filling up of holes provides a good example of this picture pps2 ; bar .
Since the electron/atom ratio increases as one goes from to based upon the above argument one expects the to systematically decrease as the different elements from the row are added to However, the experimentally observed changes in of transition-metal- alloys mor do not seem to follow the expected trend of a systematic decrease in as one goes from to For example, a -doped has a of only while doped similarly with and show ’s of and respectively mor . Surprisingly, doped shows the highest of all the transition-metal- alloys investigated so far kaz ; mor . The observed changes in of transition-metal-doped alloys, especially as one goes from to are unexpected even after making allowances for magnetic effects all1 ; all2 .
To understand the changes in the electronic structure and the superconducting properties of alloys upon addition of transition-metal impurities, we have carried out studies of alloys using density-functional-based methods. We have used Korringa-Kohn-Rostoker coherent-potential approximation method fau in the atomic-sphere approximation (KKR-ASA CPA) pps_cpa for taking into account the effects of disorder, Gaspari-Gyorffy formalism gas for calculating the electron-phonon coupling constant , and Allen-Dynes equation all1 ; all2 for calculating in alloys. For understanding the variation in as one goes from to , we have analyzed our results in terms of the changes in the spectral function fau along to pps2 ; pps_high and the densities of states (DOS), in particular, the changes in the and the transition-metal contributions to the total DOS. The changes in the magnetic alloys are described in terms of spin-resolved densities of states and the local magnetic moments. Before we describe our results, we outline some of the computational details of our calculation.
II. Computational Details
The charge self-consistent electronic structure of unpolarized as well as spin-polarized alloys has been calculated using the KKR-ASA CPA method. We have used the CPA successfully to describe the electronic structure of doped alloys pps2 . We parametrized the exchange-correlation potential as suggested by Perdew-Wang within the generalized gradient approximation perdew . The Brillouin zone (BZ) integration was carried out using k-points in the irreducible part of the BZ. For DOS calculations, we added a small imaginary component of to the energy and used k-points in the irreducible part of the BZ. The lattice constants for were fixed at the values. The Wigner-Seitz radius for was slightly larger than that of , while the Wigner-Seitz radii of the impurities were equal to their bulk value as given in Ref. skriver . The maximum used was = .
As indicated above, the electron-phonon coupling constant was calculated using Gaspari-Gyorffy formalism with the charge self-consistent potentials of unpolarized alloys obtained with the KKR-ASA CPA method. Subsequently, the variation of was calculated using Allen-Dynes equation. The average value of phonon frequency for was taken from Ref. kon and .
III. Results and Discussion
In this section we present the results of our self-consistent electronic structure calculations for alloys. We first describe the results of the unpolarized calculations in terms of the total and the sub-lattice resolved DOS, including the local DOS due to the transition-metal impurity. From our spin-polarized calculations, described next, we find only the alloys of and with to be magnetic of all the elements. These results are discussed using the spin-resolved DOS and the local moments. Finally, the calculated variation in for alloys is compared with the available experimental data, and analyzed in terms of the DOS and the spectral function along to .
A. Unpolarized Total and Local Densities of States
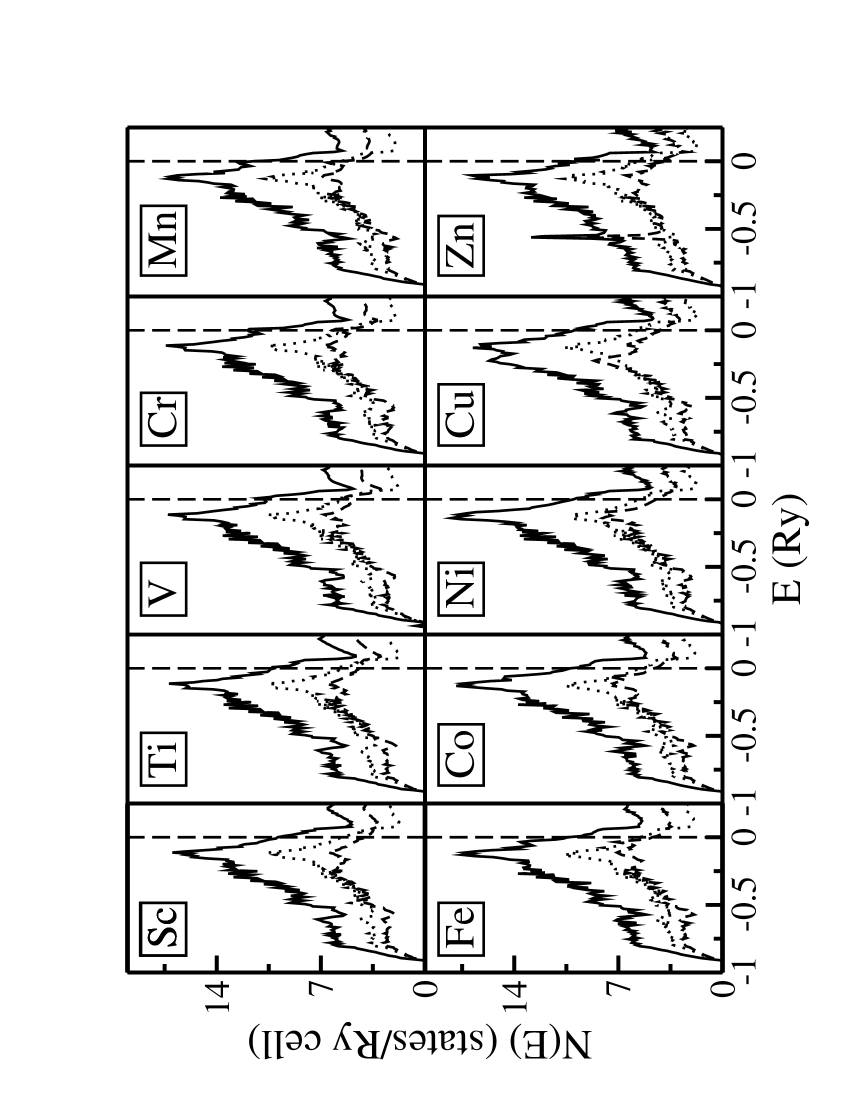
In Fig. 1 we show the calculated densities of states of alloys from to , including the total DOS, and the concentration-weighted, sub-lattice resolved DOS for the two inequivalent sub-lattices in . The two inequivalent sub-lattices consist of the and the transition-metal on one sub-lattice and on the other two sub-lattices . As we go from to , the increase in the electron/atom ratio moves the Fermi energy, , as well as increases the hybridization of the host bands with the impurity band. The change in has important consequences for the superconducting properties of these alloys, as discussed later. The inward movement of the -band as we go from to is clearly manifested in the total DOS as well as the concentration-weighted DOS of sub-lattice. However, we find that the DOS at the sub-lattice remains largely unaffected due to the transition-metal impurity, although the movement of changes the contribution to the total DOS at .
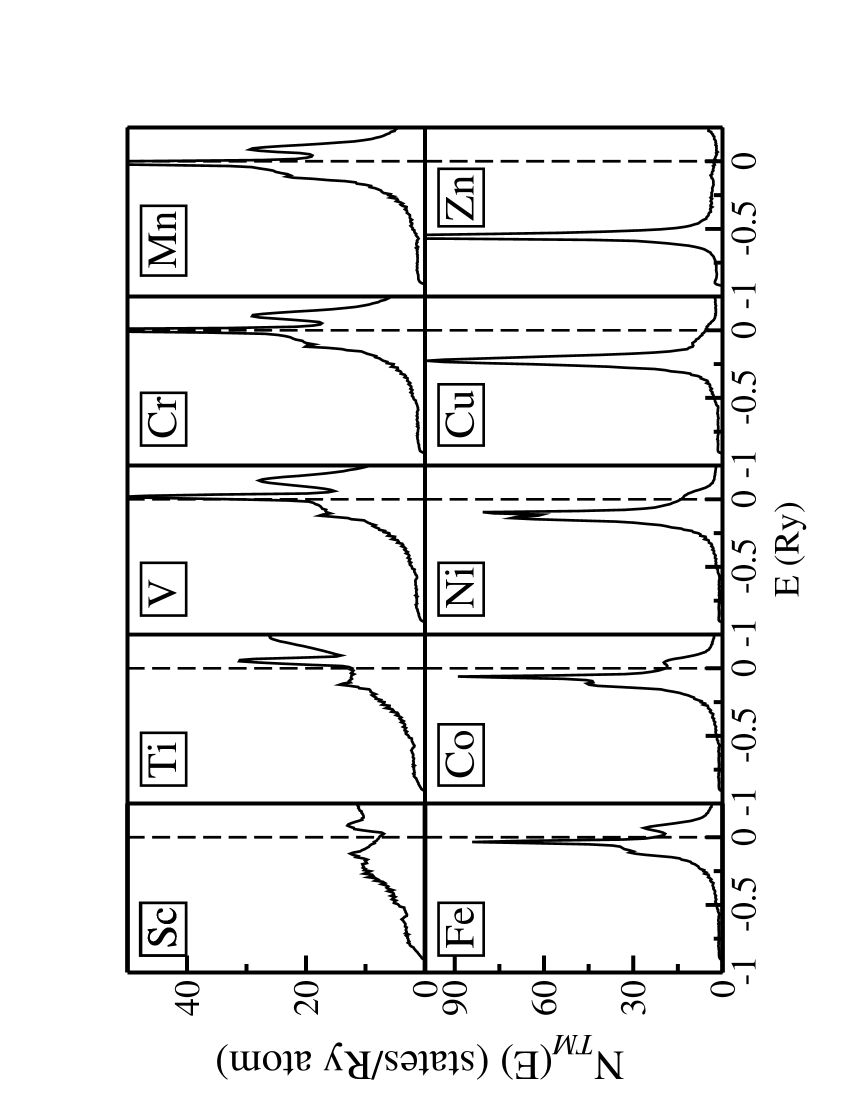
To be able to examine the changes in the DOS of the transition-metal impurities and to show the movement of the band as we go from to , we show in Fig. 2 the DOS of the transition metal impurity on the sub-lattice in alloys. We find that the level crosses between and , resulting in a very high density of states at for these alloys. The relatively high DOS for and points to the possibility of local magnetic moment formation at the impurity sites. By the time we come to impurity, the level is well inside and the impurity contribution to the total DOS has reduced significantly. We also find that the lowering of level with increasing electrons is accompanied by the narrowing of the band. For example, in the case of impurity the width of the band is the narrowest, indicating almost an atomic-like behavior of these electrons. It is interesting to note that these results are qualitatively similar to our results on transition-metal impurities in pps_rec ; pps_dil
B. Spin-Polarized Total and Local Densities of States
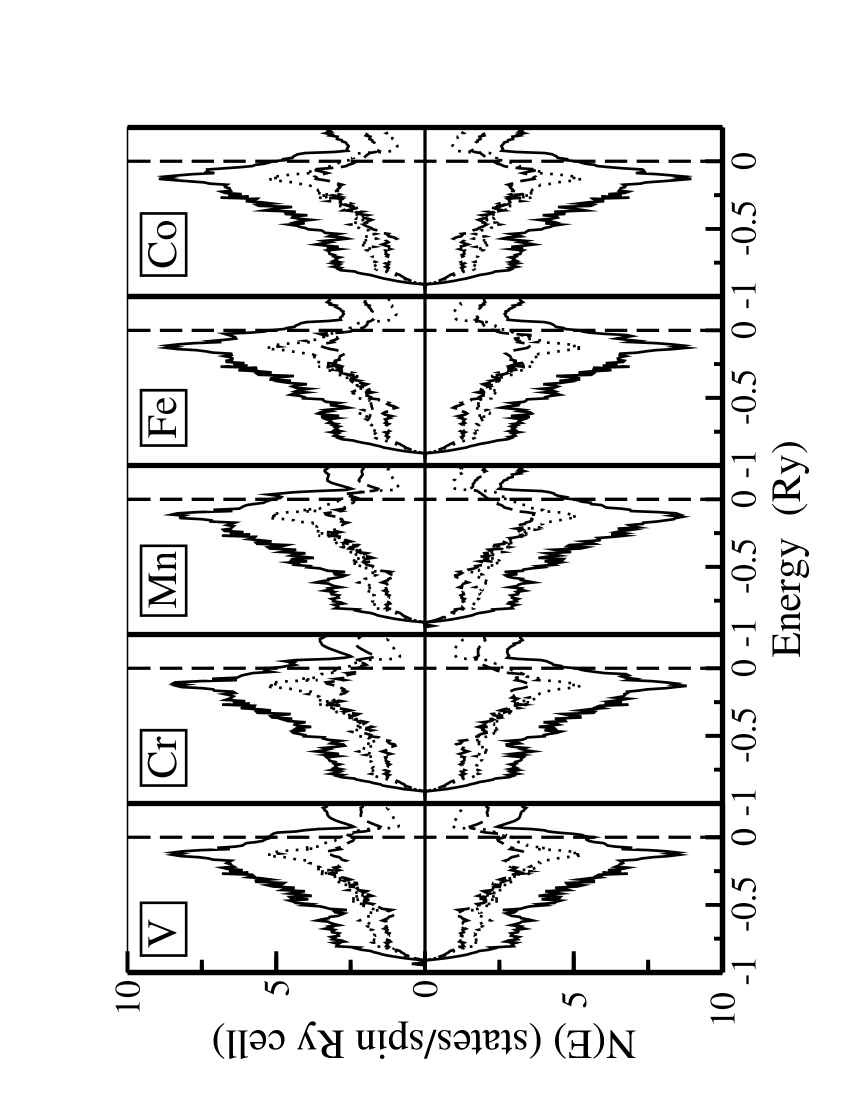
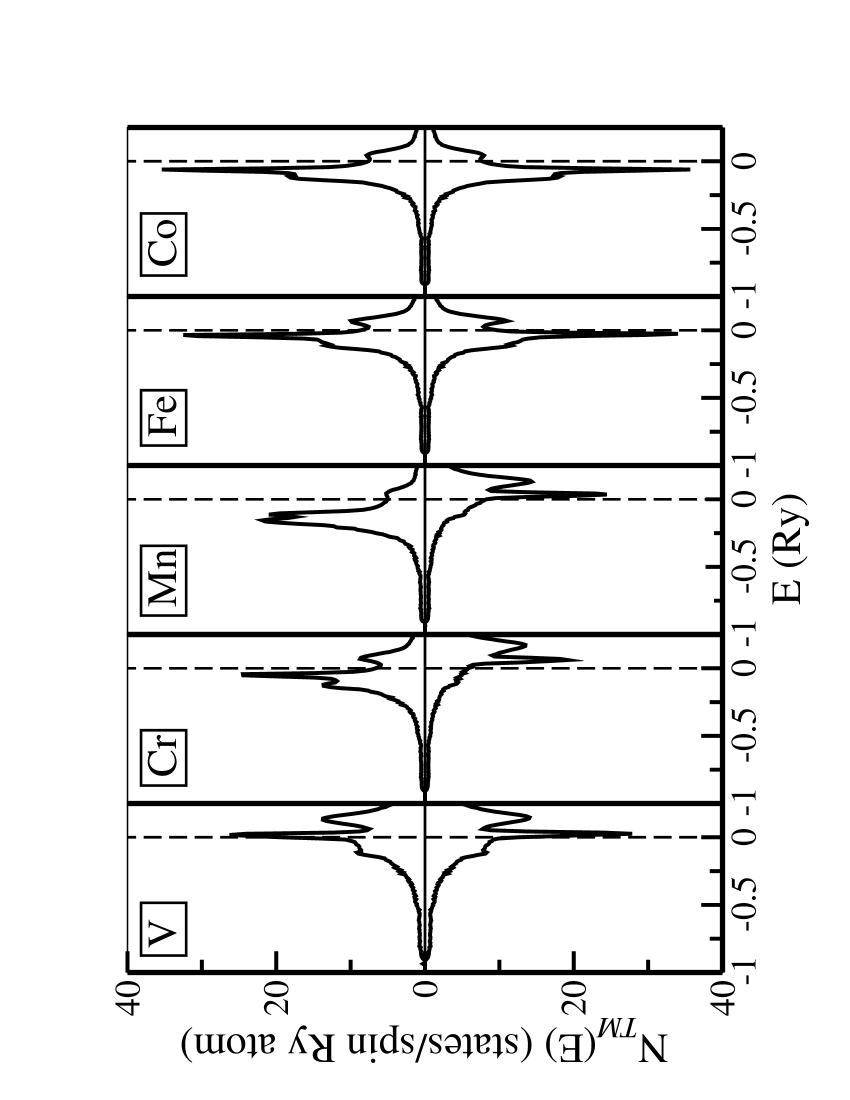
The results of our spin-polarized calculations for alloys are shown in Figs. 3-5. Our calculations show that the alloys of and in are exchange-split, as can be seen in Fig. 3 where we have plotted the spin-polarized total and the concentration-weighted, sub-lattice resolved DOS for and in . Once again, we find that the sub-lattice remains unaffected due to magnetic moment formation at the impurity site on the sub-lattice. To clearly show the changes in the majority and the minority spin DOS of the sub-lattice due to exchange-splitting in the DOS of the impurity atom, we show in Fig. 4 the spin-resolved total DOS due to the impurity atom. As expected from the unpolarized calculations, the exchange splitting is the largest for and alloys. The exchange-splitting in the DOS due to the impurity atom leads to local moment formation at these sites with and having local moments of and , respectively. The local moment on is very small (). Note that the total DOS of the impurity is dominated by the contribution and the local moments arise almost entirely due to the impurity electrons.
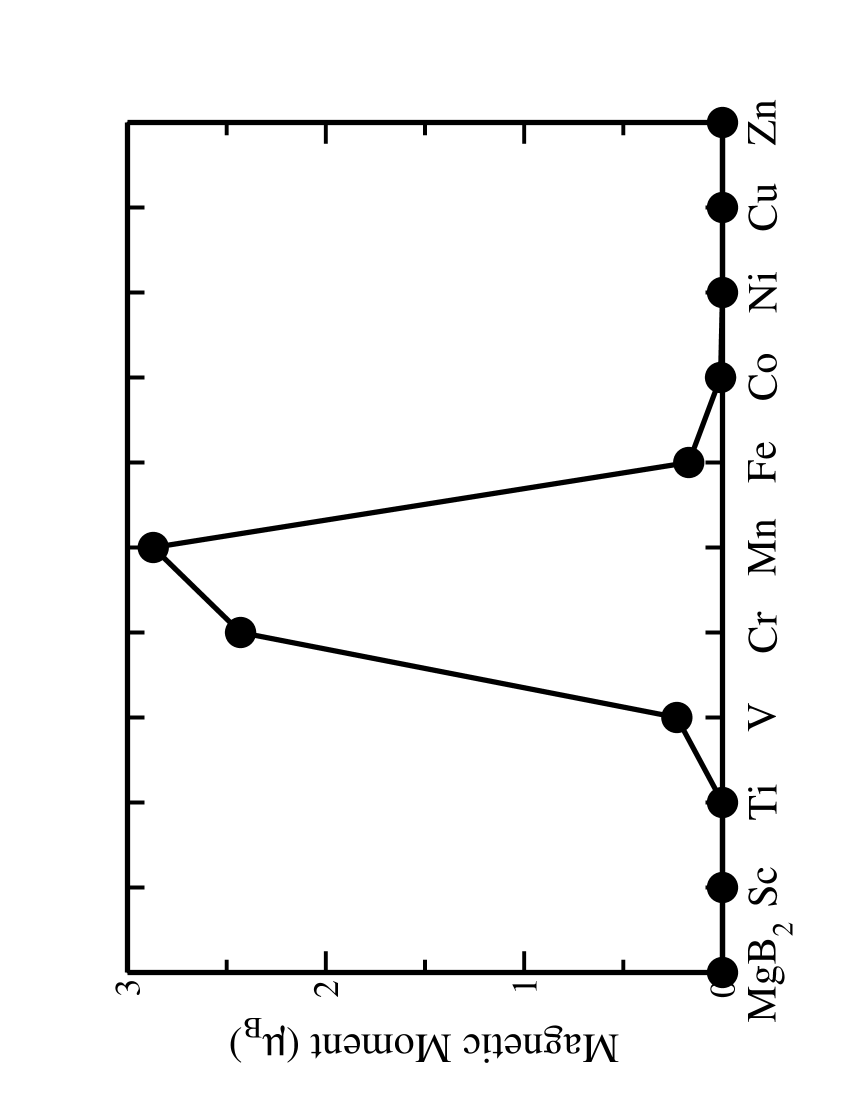
It must be pointed out that the calculation of local moments in alloys is sensitive to the volume that one associates with the impurity atom. Given the availability of electrons around sub-lattice in alloys, a judicious choice of the impurity-atom volume is essential for a reliable description of the local moments. In our calculations, we have chosen the impurity atomic volume to be equal to the observed bulk value as given in Ref. [skriver ]. However, it is clear that and will show large local moments in .
C. Superconducting Transition Temperature
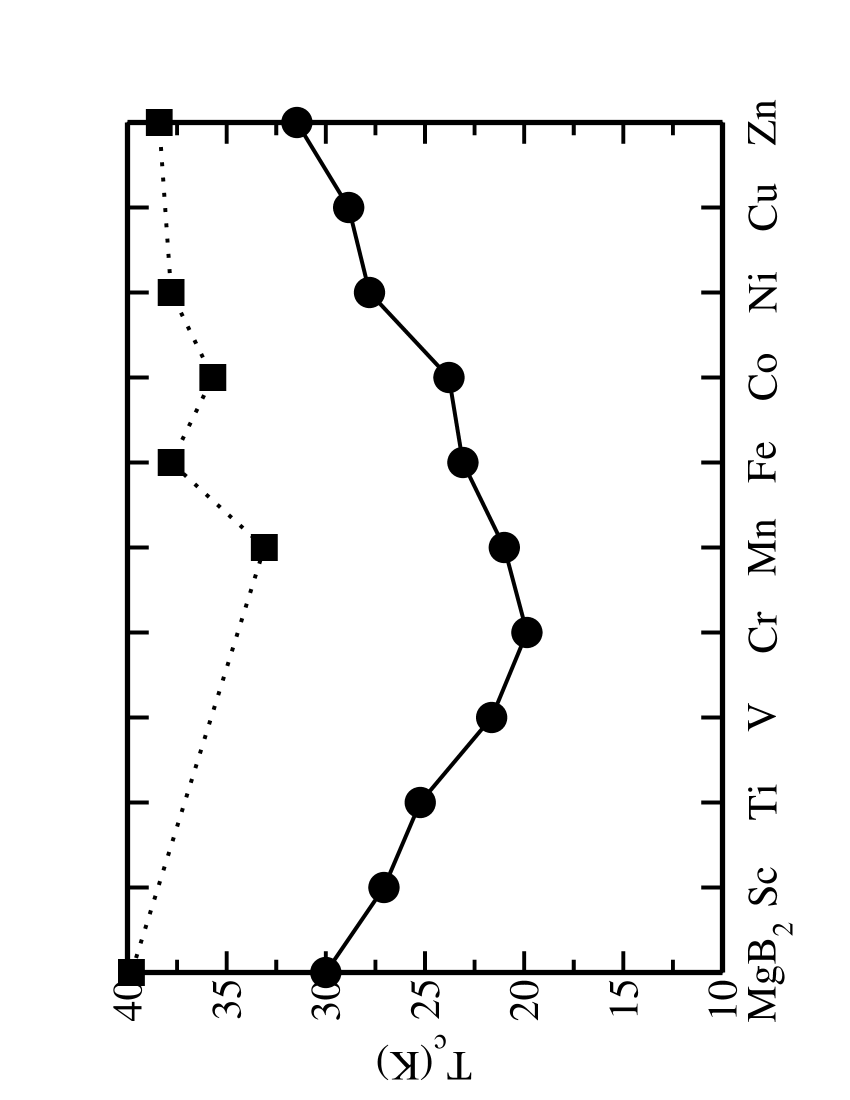
We have studied the electronic structure of alloys as a prelude to understanding the superconducting properties, especially the superconducting transition temperature , of these alloys. In Fig. 6 we show our calculated as well as the observed kaz ; mor for alloys. The calculated variation in across the row is similar to the one observed experimentally for to in kaz ; mor . Note that our calculated for is equal to , which is consistent with the results of other works kor ; kon ; boh with similar approximations.
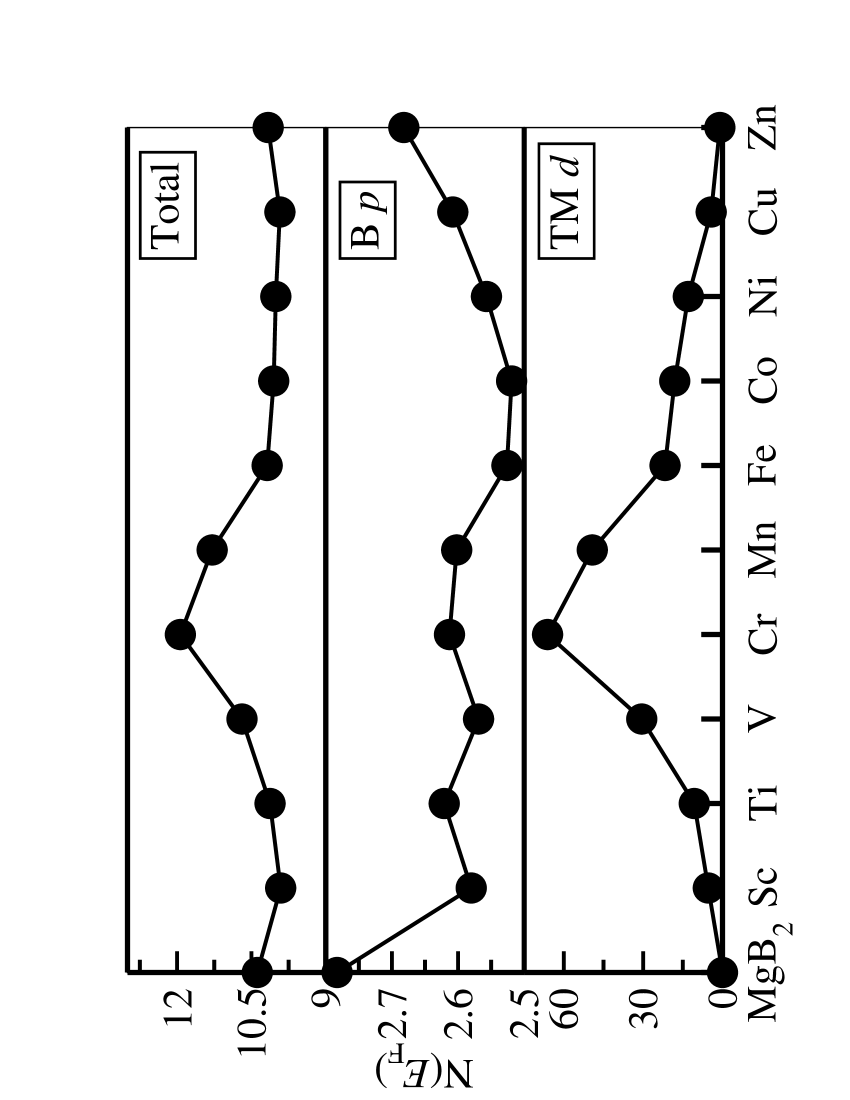
The total DOS and the spectral function along to at are expected to play an important role in deciding the of alloys. Thus, in the following we examine the changes in these two quantities in alloys as we go from to . In Fig. 7 we show the total DOS, , the contribution to and the impurity contribution to at the Fermi energy. Our calculations show to have the lowest of all the alloys, which coincides with the highest of as well as the highest contribution to the of , as can be seen in Fig. 7. In contrast, the contribution is not enhanced resulting in the lowest for within our approach. Similarly, the for is also small in comparison with other alloys. Here, we like to point out that the exchange-splitting will reduce , leading to a smaller in the case of magnetic alloys. Thus, within our approach, it would have led to an increase in . However, the inclusion of magnetism with its pair-breaking effects all1 ; all2 will further reduce the . The gradual increase in from to is due to enhanced contribution to as well as a substantial decrease in the impurity contribution to as shown in Fig. 7.
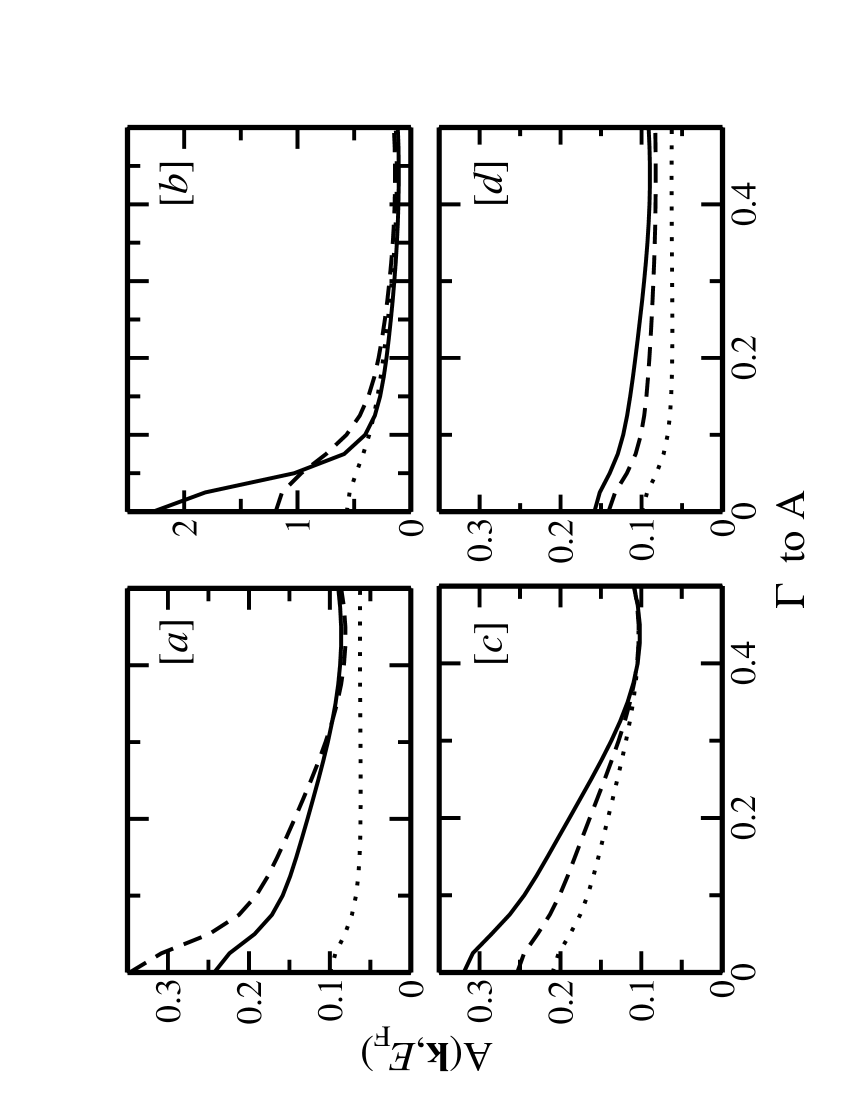
To further clarify the reasons for the changes in in alloys, as we go from to , we show in Fig. 8(a)-(d) the spectral function, k,, calculated along to direction in alloys. For comparison we have also plotted k, for in Figs. 8(a) and (d). As described in Ref. pps2 , the additional states created along to direction reduce the coupling between the hole-like cylindrical Fermi sheets with the phonons which, in turn, reduces the . Thus an alloy with k, similar to that of will show a close to that of . Carrying out such a comparison in Fig. 8, we find that will have a close to that of , while will show the lowest of them all. The fact that our calculation shows to have a lower than is due to the relatively high impurity DOS at . In addition, in the case of and impurity in , the magnetic effects will further reduce the all2 . These results reinforce the observation made in Ref. pps2 that the way changes in upon alloying depends dramatically on the location of the added/modified k-resolved states on the Fermi surface.
IV. Summary
We have studied the electronic structure of transition-metal- alloys using Korringa-Kohn-Rostoker coherent-potential approximation method in the atomic-sphere approximation. Our results for the unpolarized calculations are similar to that of impurities in other and metals. From spin-polarized calculations we find that only alloys of and in are magnetic, with and having the largest local magnetic moment of and , respectively. We have used the unpolarized, self-consistent potentials of alloys, obtained within the coherent-potential approximation, to calculate the electron-phonon coupling constant using the Gaspari-Georffy formalism. Then, with the help of Allen-Dynes equation we have calculated the superconducting transition temperature of these alloys. We find that the calculated is the lowest for and the highest for , in qualitative agreement with experiment. The trend in variation of from to is also similar to the available experimental data.
References
- (1) J. Nagamatsu, N. Nakagawa, T. Muranaka, Y. Zenitani, and J. Akimitsu, Nature, 410, 63 (2001).
- (2) S. L. Bud’ko, G. Lapertot, C. Petrovic, C. E. Cunningham, N. Anderson, and P. C. Canfield, Phys. Rev. Lett. 86, 1877 (2001).
- (3) D. G. Hinks and J. D. Jorgensen, Nature 411, 457 (2001).
- (4) T. Takahashi, T. Sato, S. Souma, T. Muranaka, and J. Akimitsu, Phys. Rev. Lett. 86, 4915 (2001).
- (5) Cristina Buzea and Tsutomu Yamashita, cond-mat/ 0108265; and references therein.
- (6) T. Yildirim, O. Gulseren, J. W. Lynn, C. M. Brown, T. J. Udovic, Q. Huang, N. Rogado, K. A. Regan, M. A. Hayward, J. S. Slusky, T. He, M. K. Haas, P. Khalifah, K. Inimaru, and R. J. Cava, Phys. Rev. Lett. 86, 5771 (2001).
- (7) J. Kortus, I. I. Mazin, K. D. Belashchenko, V. P. Antropov, and L. L. Boyer, Phys. Rev. Lett. 86, 4656 (2001).
- (8) M. An and W. E. Pickett, Phys. Rev. Lett. 86, 4366 (2001).
- (9) Y. Kong, O. V. Dolgov, O. Jepsen, and O. K. Andersen, Phys. Rev. B 64, 020501 (2001).
- (10) K.-P. Bohnen, R. Heid, and B. Renker, Phys. Rev. Lett. 86, 5771 (2001).
- (11) Prabhakar P. Singh, Phys. Rev. Lett. 87, 087004 (2001).
- (12) N. I. Medvedeva, A. L. Ivanovskii, J. E. Medvedeva, and A. J. Freeman, Phys. Rev. B 64, 020502 (2001).
- (13) G. Satta, G. Profeta, F. Bernardini, A. Continenza, and S. Massidda, Phys. Rev. B 64, 104507 (2001).
- (14) K. D. Belaschenko, M. van Schilfgaarde, and V. P. Antropov, Phys. Rev. B 64, 092503 (2001).
- (15) A. Y. Liu, I. I. Mazin, and J. Kortus, Phys. Rev. Lett. 87, 87005 (2001).
- (16) H. J. Choi, D. Roundy, H. Sun, M. L. Cohen, and S. G. Louie, cond-mat/0111182 and cond-mat/0111183 (2001).
- (17) J. Y. Xiang, D. N. Zheng, J. Q. Li, L. Li, P. L. Lang, H. Chen, C. Dong, G. C. Che, Z. A. Ren, H. H. Qi, H. Y. Tian, Y. M. Ni, and X. Z. Zhao, cond-mat/0104366 (2001).
- (18) Y. G. Zhao, X. P. Zhang, P. T. Qiao, H. T. Zhang, S. L. Jia, B. S. Cao, M. H. Zhu, Z. H. Han, X. L. Wang, and B. L. Gu, Phys. C 361, 91 (2001).
- (19) S. M. Kazakov, M. Angst, and J. Karpinski , cond-mat/0103350 (2001).
- (20) Y. Moritomo and S. Xu, cond-mat/0104568 (2001).
- (21) Prabhakar P. Singh, cond-mat/0201093 (2002).
- (22) S. V. Barabash and D. Stroud, cond-mat/0111392 (2001).
- (23) P. B. Allen and R. C. Dynes, Phys. Rev. B 12, 905 (1975).
- (24) P. B. Allen and B. Mitrovic, in Solid State Physics, edited by H. Ehrenreich, F. Seitz, and D. Turnbull (Academic, New York 1982), Vol. 37, p. 1.
- (25) J. S. Faulkner, Prog. Mat. Sci 27, 1 (1982); and references therein.
- (26) Prabhakar P. Singh and A. Gonis, Phys. Rev. B 49, 1642 (1994).
- (27) G. D. Gaspari and B. L. Gyorffy, Phys. Rev. Lett. 28, 801 (1972).
- (28) Prabhakar P. Singh, cond-mat/0201126 (2002).
- (29) J. P. Perdew and Y. Wang, Phys. Rev. B 45, 13244 (1992); J. P. Perdew, K. Burke, and M. Ernzerhof , Phys. Rev. Lett. 77, 3865 (1996).
- (30) H. L. Skriver, The LMTO Method (Springer-Verlag, Berlin, 1984).
- (31) Prabhakar P. Singh, Phys. Rev. B 43, 3975 (1991).
- (32) Prabhakar P. Singh, J. Phys.: Condens. Matter 3, 3285 (1991).