Present address: ] Laboratoire de Minéralogie-cristallographie, Université Pierre et Marie curie, 4 Place Jussieu, 75252 Paris, France
Metal-insulator transition
and charge ordering in the extended
Hubbard model at one-quarter filling
Abstract
We study with exact diagonalization the zero temperature properties of the quarter-filled extended Hubbard model on a square lattice. We find that increasing the ratio of the intersite Coulomb repulsion, , to the band width drives the system from a metal to a charge ordered insulator. The evolution of the optical conductivity spectrum with increasing is compared to the observed optical conductivity of several layered molecular crystals with the and crystal structures.
pacs:
71.27+a, 71.30+hCharge ordering in strongly correlated electron systems is currently under intense investigation. Charge ordering is relevant to a broad range of materials including the cupratescuprate , manganatescmr , magnetitemag , vanadium oxidesvan , and the Bechgaard salts brown . The and types of layered molecular crystals based on molecules such as BEDT-TTF [= bisethylenedithio-tetrathiafulvalene] Ishiguro , display charge ordering, metallic, and superconducting phases close to each other mi . Charge ordering driven by a strong inter-site Coulomb repulsionhubbard ; Seo is possible in crystals with the and arrangements of BEDT-TTF molecules because their bands are quarter-filled with holes, in contrast to the well studied -type, for which strong dimerization of the molecules lead to a half-filled band kino . The -type crystals undergo a transition from a metal to a charge ordered insulator as the temperature, pressure, uniaxial stress, or anion is variedmi ; hubbard . Furthermore, the metallic phase exhibits features characteristic of a strongly correlated system. In particular, the optical conductivity spectra display a broad mid-infrared band and a near absence of a Drude-like peakDong . This is in contrast to conventional metals, for which the total spectral weight is dominated by a Drude peak.
In this Letter, we use the results of an exact diagonalization study of the relevant extended Hubbard model to argue that the inter-site Coulomb repulsion is responsible for the observed metal-insulator transition in the and crystals. We show how the Drude weight decreases as the inter-site Coulomb repulsion, , is increased, until, at a finite value of , a transition to an insulating phase occurs. Simultaneously, long range charge ordering gradually sets in. We further find that a redistribution of the optical conductivity spectra occurs close to the metal-insulator transition. This finding is in qualitative agreement with experimental data on and organic salts Tajima ; Wang ; Dong ; Ouyang .
The quarter-filled extended Hubbard model on a square lattice is the simplest strongly correlated model that can potentially describe the competition between metallic, superconducting, and insulating phases in the and materials McKenzie ; merino . The Hamiltonian is
| (1) | |||||
where creates an electron of spin at site . For , previous calculations suggest that the system is metallic with no charge order DagottoRMP . In the limit of the double occupation of sites is suppressed and the ground state is insulating with checkerboard charge ordering and long range antiferromagnetic correlations along the diagonals McKenzie .
In the present work we consider large (but finite) and vary parameters . Previously, an SU(N) generalisation of the model with , was studied in the large N limit using slave bosonsMcKenzie ; merino . It was found that as increased there was a transition from a metallic phase to a superconducting phase (with symmetry) to a charge ordered phase. Given this potentially rich phase diagram it is important to determine whether or not these previous results are an artefact of the approximations used or whether they reflect the actual physics (N=2 and finite ). Exact diagonalization of small systems provides such a test. Previously, similar models with more parameters, aimed at a more realistic description of the details of the materials, have been studied by Hartree-FockSeo , and quantum Monte Carloclay1 , and exact diagonalizationClay . We performed a Lanczos calculation on site clustersDagottoRMP avoiding uncompensated spin moments in the cluster ( ) at quarter-filling: . A powerful method to determine from small systems whether the bulk system is metallic or insulating is to evaluate the Drude weight Kohn ; DagottotU ; Scalapino . It is given by
| (2) |
where and , denote the ground state and excited state energies of the system, respectively. is the kinetic energy operator and is the current operator in the direction at zero wavevector (). The occurrence of an insulating phase is marked by the exponential vanishing of with the linear size of the system Kohn ; Scalapino ; chargeg .
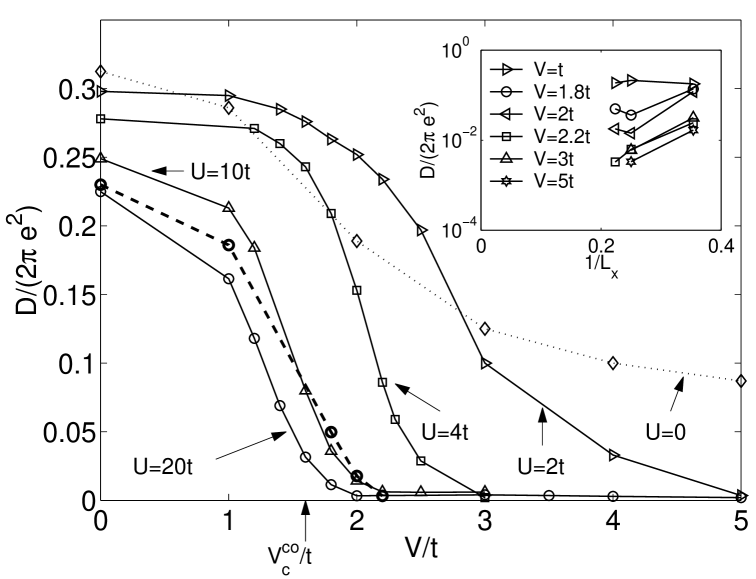
In Fig. 1 we plot the Drude weight as a function of , for and different values of . For we also plot the Drude weight for the cluster with . As the Coulomb nearest-neighbors repulsion is gradually increased, the Drude weight decreases until it eventually vanishes. For we estimate the critical value for the metal-insulator transition to be ; for this value, the Drude weight becomes of the order of and stays of this order up to . For we do not find any significant change in the dependence of the Drude weight with , meaning that the finite size effects in the Drude weight are weak. This is confirmed in the inset of Fig. 1 which shows the finite-size scaling of the Drude weight. Indeed, we find that for , the Drude weight displays an exponential dependence with , as expected for an insulatorKohn ; Scalapino . It extrapolates to values of the order of in the thermodynamic limit. In contrast, for , the Drude weight is weakly dependent on extrapolating to a finite value in the thermodynamic limit, consistent with a metallic state.
The occurrence of charge ordering can be investigated by computing the charge correlation function
| (3) |
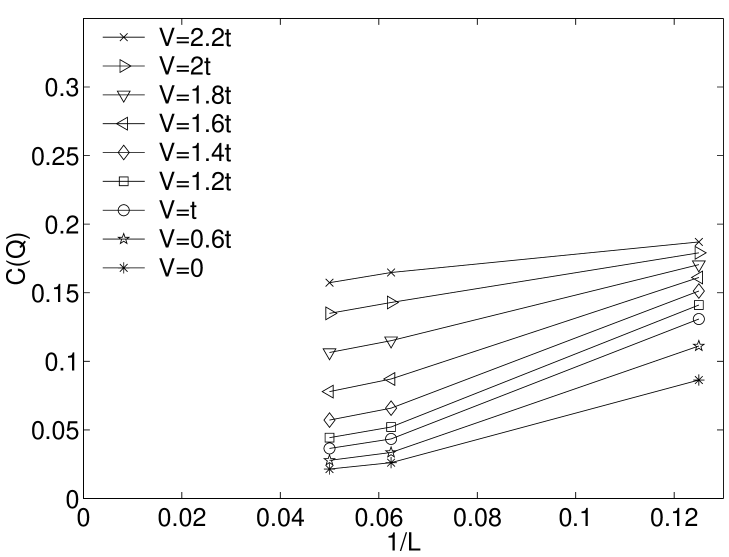
where are the allowed momenta on the cluster. We find that at , is featureless. As is increased, peaks at , signalling checkerboard charge ordering. In our calculations we do not find any evidence for other charge ordering patterns, such as those found in References Seo ; Clay . The system has long range charge ordering if remains finite in the thermodynamic limit. In Fig. 2 we plot as a function of . A linear dependence with is expected for the finite size scaling of an order parameter with a discrete symmetry in two dimensionsBrezin . For , we observe that the linear extrapolation of (using ) to the infinite volume limit tends to zero, i.e., the charge is homogeneously distributed in the lattice. We find that the extrapolation of a linear fit of to the thermodynamic limit becomes finite at about extrapol . If we decrease the critical value increases. This is because doubly-occupied sites proliferate so that inducing the checkerboard charge ordered state becomes energetically less favorable. Further insight into the transition can be obtained by computing the charge ordering parameterVojta , . A non-zero means long range charge ordering. In particular, for the checkerboard charge ordered state is fully formed, while for the charge is homogeneously distributed in the lattice. At we find that the checkerboard is close to being completed, . We note that the results we find here are different from the ones obtained in two-leg ladders Vojta where a transition from an homogeneous insulating phase to a charge ordered insulating phase takes place. This difference is due to the one-dimensional nature of the two-leg ladder.
.
At this stage we can provide a physical interpretation of our findings. Only when is sufficiently large so that the checkerboard charge ordered state is nearly completed, a transition to an insulating state is possible. This is because moving an electron within the checkerboard ordered state would cost an energy of , which is comparable to the bandwidth, . As a consequence electrons can become localized. As an aside we note that Fig. 1 shows that increasing from to , leads to only a slight decrease in the critical value, . This contradicts the results obtained by Ohta et al. Ohta who claim that . We note that the critical value for large follows the tendency encountered in one-dimensional rings Mila and two-leg ladders Vojta for which decreases to as .
Since we find that , it might be possible that a charge ordered metallic state is realized in the range: . However, caution is in order because the former value is quite sensitive to finite-size effects. A possible candidate for this phase is the quarter-filled organic crystal: ”-(BEDT-TTF)2SF5CH2CF2SO3, which displays metallic behavior of the resistivity and at the same time charge disproportion in alternate moleculesSchlueter .
In order to further our understanding of the metal-insulator transition and make contact with experiments on and materials, we have also computed the real part, , of the optical conductivityfavand at frequency ,
| (4) |
It obeys the following sum ruleMaldague
| (5) |
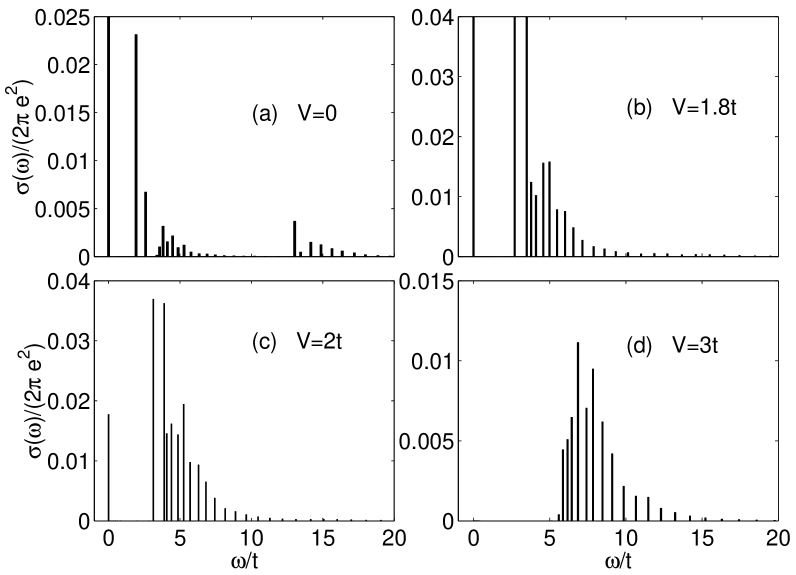
In Fig. 3 we plot the evolution of the optical conductivity for different values of and . We also found that the plots were qualitatively similar for (not shown). For the regular Hubbard model, i.e. (Fig. 3 (a)), there are two features at non-zero frequency. The highest energy feature is related to transitions associated with the Hubbard bands and the other is the “mid-infrared” band, previously found by Dagotto et al.DagottotU . At (Fig. 3 (b)), the Drude peak is reduced (see Fig. 1), signalling the incipient localization of the charge carriers. Spectral weight is transferred from both the Hubbard feature and the Drude peak to the mid-infrared band found at . This effect is more clearly observed for in Fig. 3 (c): the Drude peak is further suppressed and most of the spectral weight appears at low frequencies, in the range . Increasing further to just below gives a similar shape of the optical conductivity (not shown) with a very small Drude weight. Finally, Fig. 3 (d) shows the optical conductivity on the insulating side of the transition: . An optical gap opens and most of the spectral weight concentrates at larger frequencies building up a single broad resonance. If is further increased, , then the band associated with charge excitations due to appears above the Hubbard band situated near , as discussed by Ohta et al. Ohta . In summary, Fig. 3 shows that close to the metal-insulator transition the optical conductivity is dominated by the ”mid-infrared” feature, for both metallic and insulating phases. We now discuss how this is what is observed in the and materials.
The optical conductivity we find close to the metal-insulator transition, , is qualitatively similar to the optical conductivity of -(BEDT-TTF)2SF5CH2CF2SO3, measured by Dong et al. Dong (at a temperature, K). Indeed, the small spectral weight at zero frequency found here is consistent with their failure to observe a Drude peak, even though the system is metallic. Also their observation of large spectral weight at low frequencies is consistent with the mid-infrared band we find in our calculations. At , the system is still on the metallic side of the metal-insulator transition which is consistent with the observed metallic behavior of the resistivity. From the above discussion we conclude that - (BEDT-TTF)2SF5CH2CF2SO3 is a metal close to a metal-insulator transition. This assertion is corroborated by the fact that an external perturbation, such as a magnetic fieldwosnitza1 or pressureWosnitza , or replacing the anion CH2CF2 by CH2 Ward , drives the system into an insulating phase.
Optical conductivity measurements on the -type crystals all show a broad feature from around 1000 to 5000 cm-1 Tamura ; Tajima ; Wang ; Ouyang . We assign this to the ”mid-infrared” band. We now compare this interpretation to previous work. -(BEDT-TTF)2CsZn(SCN)4, is a metal above 20 K and an insulator below 20 K. The frequency-dependent conductivity from 650 to 5000 cm-1 at temperatures above 20 K shows a feature from 650 to about 1200 cm-1 Tajima , which Tajima et al. assigned to a Drude peak, with a phenomenological damping rate of 0.1 eV 800 cm-1. -(BEDT-TTF)2I3 is a metal which undergoes a transition to a superconductor at 3.6 K. Tamura et al. Tamura measured the optical conductivity from about 700 to 4000 cm-1 in the metallic phase. They assign the spectrum below about 1000 cm-1 to the tail of a Drude peak with a phenomenological damping rate of 400 to 800 cm-1, depending on the temperature. We disagree with the assignment of these low energy features to a Drude peak because it requires large scattering rates, comparable to , implying a “bad” metal. In the materials the observed widths of the Drude peak (and thus the scattering rate) at low temperatures are orders of magnitude smaller than this, typically of the order of tens of cm-1 eldridge . We would assign all of the spectrum observed for -(BEDT-TTF)2I3 Tamura to the ”mid-infrared” band. The experiment of Tamura et al.Tamura did not go to low enough frequencies to observe the actual Drude peak. The feature in -(BEDT-TTF)2CsZn(SCN)4 that Tajima et al. Tajima assigned to a Drude peak we would assign to a phonon (and possibly its interference with the tail of the ”mid-infrared” band) for the following reason. The optical conductivity spectrum of -(BEDT-TTF)2RbCo(SCN)4 was studied in detail by Tajima et al.Tajima . This material becomes a charge ordered insulator below 190 K. In slowly cooled samples the only significant spectral weight below 2000 cm-1 is a phonon around 1200 cm-1 (compare Fig. 5(a) in Ref. Tajima, ). If the sample is quenched (i.e., rapidly cooled) there is a broad feature around this frequency. In the organics such quenching is usually associated with significant amounts of disorder stalcup .
Tajima et al. Tajima assigned the second broad feature extending from above about 1200 cm-1 to domains associated with the onset of charge ordering. This was based on the calculated optical conductivity for a mean-field solution of the extended Hubbard model. Although we have essentially the same assignment as theirs for the ”mid-infrared” band we note that their mean-field calculation cannot actually produce this feature in the metallic phase. This underscores the many-body physics underlying this feature and the need for our exact diagonalization calculation.
We suggest two possible reasons for the absence of the Hubbard resonance in the experimental spectra. First, Fig. 3 (c) and (d) suggest that most of the spectral weight from it is transfered to the ”mid-infrared” band Second, it could be at a frequency above the range of the experiments. The most reliable estimates put eV cm-1 parameters . If eV McKenzie , Fig. 3 (c) would put the mid-infrared band extending from about 1000 cm-1 to 4000 cm-1 and the Hubbard band feature roughly around 6000 cm-1. The latter is near the edge of many of the experimental plots.
In summary, we have shown that increasing the nearest-neighbors Coulomb repulsion, , for the quarter-filled extended Hubbard model on the square lattice, leads to an insulating phase for . The calculated optical conductivity spectra close to the metal-insulator transition is consistent with experimental data on several and - type molecular crystals. At , the Drude peak is strongly supressed and the spectral weight is dominated by a broad ”mid-infrared” band associated with short-range charge ordering.
Acknowledgements.
We thank O. Gunnarsson for making available his exact diagonalization code, E. Koch, M. Capone, F. Becca, M. Dressel, and M. Brunner for very helpful discussions, and the Max-Planck-Forschungspreis for financial support. J.M. was supported by a Marie Curie Fellowship of the European Community programme ”Improving Human Potential” under contract No. HPMF-CT-2000-00870 and R.H.M. by the Australian Research council.References
- (1) M. Vojta et al. Phys. Rev. B 62, 6721 (2000), and references therein.
- (2) M. B. Salamon et al. Rev. Mod. Phys. 73, 583 (2001).
- (3) S.K. Park et al. Phys. Rev. B 58, 3717 (1998).
- (4) Y. Ueda et al., J. Alloys Comp. 317-318, 109 (2001); T. Yamauchi et al., submitted to Nature.
- (5) See for example, D.S. Chow et al., Phys. Rev. Lett. 85, 1698 (2000).
- (6) For a recent review, see: T. Ishiguro et al. Organic Superconductors , Springer-Verlag, Berlin, 2nd Edn, 1998.
- (7) H. Mori et al., S. Tanaka, and T. Mori, Phys. Rev. B 57, 12023 (1998); T. Imakubo et al., J. Mater. Chem. 12, 159 (2002).
- (8) For the importance of in quasi-one-dimensional organics see J. Hubbard, Phys. Rev. B 17, 494 (1978), and S. Mazumdar and A. N. Bloch, Phys. Rev. Lett. 57, 207 (1983), J. Favand and F. Mila, Phys. Rev. B 54, 10425 (1996).
- (9) H. Seo, J. Phys. Soc. Jap. 69, 805 (2000).
- (10) H. Kino and H. Fukuyama, J. Phys. Soc. Jap. 65, 2158 (1996); R. H. McKenzie, Comments Cond. Mat. Phys. 18, 309 (1998).
- (11) J. Dong et al., Phys. Rev. B 60 , 4342 (1999).
- (12) H. Tajima et al., Phys. Rev. B 62, 9378 (2000).
- (13) N. L. Wang et al., J. Phys.: Condens. Matter 13, 5463 (2001).
- (14) J. Ouyang et al., Phys. Rev. B 63, 054301 (2001).
- (15) R. H. McKenzie et al., Phys. Rev. B 64, 085109 (2001).
- (16) J. Merino and R. H. McKenzie, Phys. Rev. Lett. 87, 237002 (2001).
- (17) E. Dagotto, Rev. Mod. Phys. 66, 763 (1994).
- (18) For a discussion of the relevant parameter values for the actual materials see Ref. McKenzie, . The most direct empirical determination of is for the dimers of BEDT-TTF+ in the insulator (BEDT-TTF)2Mo6O19 based on the charge transfer excitation seen in the optical conductivity. G. Visentini et al., Phys. Rev. B 58, 9460 (1998), obtain eV.
- (19) S. Mazumdar, R. T. Clay, and D. K. Campbell, Phys. Rev. B 62, 13400 (2000).
- (20) R. T. Clay, S. Mazumdar, and D. K. Campbell, cond-mat/0112278.
- (21) W. Stephan and P. Horsch, Phys. Rev. B 42 8736 (1990); E. Dagotto et al., Phys. Rev. B 45, 10741 (1992).
- (22) D. J. Scalapino, S. R. White, and S. Zhang, Phys. Rev. B 47, 7995 (1993).
- (23) W. Kohn, Phys. Rev. 133, A171 (1964).
- (24) We find that, unlike the Drude weight, the charge gap: , is strongly affected by finite size effects.
- (25) E. Brezin and J. Zinn-Justin, Nucl. Phys. B 257, 867 (1985).
- (26) This estimate possibly overestimates , since the Lanczos method is limited to and a priori we cannot exclude large finite-size effects. Taking in the extrapolation gives a lower estimate of the transition ; compared to , obtained by a calculation based on slave-bosonsMcKenzie .
- (27) M. Vojta, A. Hübsch, and R. M. Noack, Phys. Rev. B 63, 045105 (2001).
- (28) Y. Ohta et al., Phys. Rev. B 50, 13594 (1994); Physica B 194-196, 1559 (1994).
- (29) K. Penc and F. Mila, Phys. Rev. B 49, 9670 (1994).
- (30) J. A. Schlueter et al., J. Mater. Chem. 11, 2008 (2001).
- (31) J. Favand and F. Mila, Phys. Rev. B 54, 10425 (1996).
- (32) P.F. Maldague, Phys. Rev. B 16, 2437 (1977).
- (33) J. Wosnitza et al., Phys. Rev. Lett. 86, 508 (2001).
- (34) J. Hagel and J. Wosnitza, private communication.
- (35) B. H. Ward et al., Chem. Mater. 12, 343 (2000).
- (36) M. Tamura et al., J. Phys. Soc. Japan 57, 3239 (1988).
- (37) See for example, K. Kornelson et al., Solid State Commun. 72, 475 (1989); M. Dressel et al., Phys. Rev. B 50, 13603 (1994).
- (38) T. F. Stalcup, J. S. Brooks, and R. C. Haddon, Phys. Rev. B 60, 9309 (1999).