Negative isotope effect of a BCS-like gap;
an inelastic light scattering study
Abstract
In a prior study of the boron isotope effect on the transition temperature () of Ni2B2C ( = Y, Lu) system, a positive isotope effect was observed, e.g., . BCS theory predicts that the superconducting gap at zero temperature () is proportional to . Therefore, the gap should also show a positive boron isotope effect. On the contrary, in an inelastic light scattering study, we report a negative boron isotope effect on the energy of the gap-like feature in B2g symmetry, e.g., . The origin of the effect is discussed in terms of selective probing of a non-conventional electron-phonon interaction on part of the Fermi surface, probably near the X point in the Brillouin zone.
pacs:
PACS numbers: 78.30.Er; 74.70.Dd; 74.25.JbIn a previous study of an isotope effect on the transition temperature () of Ni2B2C ( = Y, Lu) system,cheon positive isotope exponents for YNi2B2C and for LuNi2B2C were observed upon changing the mass of the boron site. The exponent is defined as . A relatively large positive value despite the light mass of boron is regarded as a good indication that these materials are BCS-type superconductors, where phonons involving boron atoms play a major role in the pairing mechanism.
BCS-type theory predicts that the superconducting gap in the limit of the absolute zero temperature () is proportional to . In weak coupling , where is the Boltzmann constant. The gap should also show a positive isotope effect upon changing the boron mass. We report here the contrary result: In an inelastic light scattering study, we observe a negative isotope effect of the gap-like Raman peak in symmetry.
The gap can be measured by electronic Raman scattering. The photon scattering process excites two quasi-particles out of the condensate at a minimum energy cost of . In the limit of small wave-vector transfer relative to the inverse coherence length and small elastic and inelastic scattering rate relative to and with neglect of final state interactions, the Raman spectrum has a peak at an energy shift of . Earlier measurements on NbSe2 and A15 compounds showed redistribution of the continuum of the Raman spectra and the formation of a -like peak upon cooling the samples below .a15 Electronic Raman studies have played important role in characterizing the nature of the superconducting gap of the high-temperaure superconductors.cooper
Compared with other techniques that measure the gap, such as tunneling and photoemission spectroscopy, inelastic visible light scattering has the advantage of measuring the anisotropy of the gap while being less surface sensitive.
The single crystal samples were grown by the flux- growth methodcanfield ; xu and were characterized by resistivity, magnetization, and neutron scattering.character Ni2B2C crystalizes in the tetragonal body-centered space group , and phononic Raman analyses have been made earlier.p-raman Here, we concentrate on the electronic Raman scattering from the quasi-particles in normal and superconducting states.
Raman spectra were obtained in a pseudo-backscattering geometry using a custom-made subtractive triple-grating spectrometer designed for very small Raman shifts and ultra low intensities.kang A 3 mW beam of 6471 Å Kr-ion laser light was focused onto a spot of m2. The temperature rise T of the focal spot above ambient temperature was estimated by solving the heat-diffusion equation. T is largest at lowest temperature because of the smaller values of the thermal conductivity.thermal The estimated T is 2.7K at 4K and 0.9K at 14K for YNi2B2C single crystals. The ambient temperature at which the Raman continua begin to show the redistribution was determined to be 14K, in agreement with this estimate. The spectra were corrected for the Bose factor and therefore are proportional to the imaginary part of the Raman susceptibility.
The “ spectra” and “ spectra” presented below are actually from the linearly-polarized light scattering geometries of XY ( + ) and X’Y’ ( + ), respectively. The contribution to these spectra was determined from the sum of XY and X’Y’ spectra minus the spectrum obtained in LR ( + ) circularly-polarized scattering geometry. was found to be negligible.
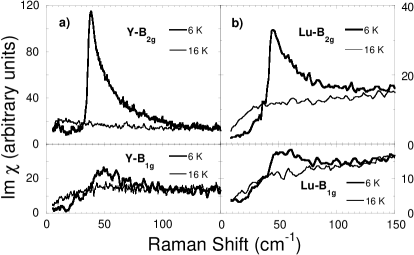
Figure 1 shows the electronic Raman spectra in and geometries of (a) YNi2B2C (10B) and (b) LuNi2B2C (10B) in the superconducting state (6 K) and normal state (16 K). The figure clearly shows 2-like peaks in the superconducting states. As reported earlier,yang the development of the 2-like peaks is indeed due to superconductivity, following the BCS prediction of the gap-vs-temperature very well.other
The gap values extrapolated to T = 0 are 2) = 5.0 meV (2/kTc = 3.7) and 2) = 6.1 meV (2/kTc = 4.5) for YNi2B2C, while 2) = 6.2 meV (2/kTc = 4.5) and 2) = 6.6 meV (2/kTc = 4.8) for LuNi2B2C. Finite scattering intensity below the gap-like peaks is observed even at 6 K. Possibility of signal from the normal-state phase is ruled out and is discussed in our earlier paperyang in more detail.
We have measured YNiB2C (B10-Y), YNiB2C (B11-Y), LuNiB2C (B10-Lu), and LuNiB2C (B11-Lu) single crystals in order to investigate the isotope effect on the “2-like” peaks. Measurements were repeated on 3-4 different single crystals of each set, and comparisons between the two isotopes were made under conditions that were as identical as possible. For instance, one sample of B10-Y and another one of B11-Y were loaded together into the same cryostat and measured several times in the sequence of B10 - B11 - B10 - B11 - B10… in one experimental run.
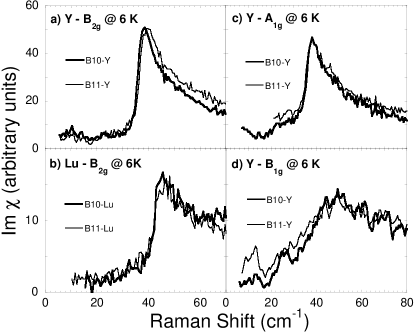
Figure 2 shows the isotope dependence of the “2-like” peaks at 6 K in various scattering geometries for YNi2B2C and geometry for LuNi2B2C. Clearly, we observe that the peak position in B10-Y is at smaller wavenumber than in B11-Y (Fig. 2a). This behavior was observed in 3-4 pairs of B10-Y and B11-Y. For LuNi2B2C the trend is far less obvious due to weaker signal-to-noise ratio (Fig. 2b). In other scattering geometries (Fig. 2c,d), no such isotope dependence is observed. On the contrary, the peak tends to show a positive isotope effect, but the greater breadth of the peak hinders determining an isotope effect within experimental resolution.
In our earlier paper,yang it was shown that the peak follows the BCS prediction for the temperature dependence of the superconducting gap. However, as seen in Fig.2a, it does not follow the BCS prediction for the isotope dependence of the gap. Rather, the peak frequency in YNi2B2C, as well as the leading edge of the peak, exhibits a negative isotope effect. There are prior reports of some of these experimental results.prior
We found empirically that in the region of the peaks the ratio of to Raman intensities can be fit to a Lorentzian expression
| (1) |
near the ‘gap-like’ peak frequency, .
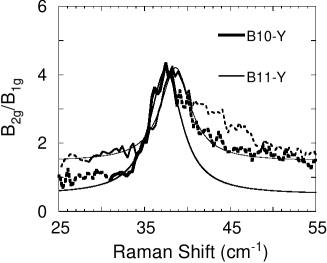
Figure 3 shows the results of fitting the above equation to the ratio of the to spectra. The fit is excellent around the peak and below, deviating much at higher frequencies. No such fit is possible for or itself. From the fits to several sets of / Raman ratios, we obtained the isotope effect exponent due to boron, for YNi2B2C and for LuNi2B2C, where . is the mass of the boron isotopes. Since there is little evidence for an isotope effect in the spectra, we attribute these results for primarily to the negative isotope effect on the spectrum.
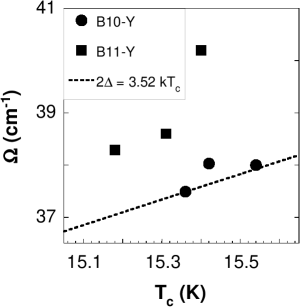
We have measured the superconducting transition temperatures using a SQUID magnetometer and eliminated the possibility that the particular B10 samples in our study have lower values than those of B11 samples. Figure 4 shows a plot of peak frequencies () at 6K and the onset temperatures of the superconducting transition of six different YNi2B2C single crystals. As is clearly seen, B11-Y samples do have larger peak frequencies than B10-Y samples, in contradiction to the BCS prediction. This figure shows that the isotope effect of the peak frequencies is negatively correlated with the isotope effect of the in YNi2B2C. The dashed line on the plot represents , the BCS prediction in the weak coupling limit.
There is no previous report known to us of an observed negative isotope effect of the superconducting gap. Negative isotope effects have been observed for the transition temperatures of the Pd-H(D) systempd-h and under-doped YBa2Cu3O7-δ .ybco In the following discussion we assume that the peak is directly due to superconducting gap . How, then, can we explain a negative isotope effect for the gap measured in Raman symmetry along with a positive isotope effect for and small or zero isotope effects for the gap measured in and symmetries?
The most likely possibility is that the boron portion of the electron-phonon interaction plays out quite differently on the various portions of the Fermi surface. It would be necessary for the Raman vertex to probe those parts of the Fermi surfaces which have a negative boron-isotope effect on the value of the gap. Correspondingly, the isotope effect would have to be much smaller and possibly positive on those parts of the Fermi surface probed in and Raman geometries.
There is a simple picture of the electronic structure that may give a strong clue to where the vertex is large. According to the band structure calculations for LuNi2B2CMattheiss ; Pickett and YNi2B2C,Lee there is a flat band that may cross the Fermi surface near the X point [wave-vector given by ]if there is a small change in parameters. This band has strong anti-bonding interactions as well as character on Ni sites.Pickett If we take a nearest neighbor, planar, Ni-Ni tight binding model with coupling , we obtain a band dispersion . This has a saddle point at X. A good starting approximation to the Raman vertex is the so-called mass approximation, valid when the photon energy is less than that of all interband transitions starting or ending at the Fermi energy. It says that the Raman vertex is proportional to . For the assumed band structure, this would give , which takes on its maximum value at the X point.
It would be useful to verify this suggestion with a band structure calculation of the mass vertex of the band that crosses the Fermi energy near the X point. The next step would be to study the coupling between this band and the boron phonon modes. There is one such calculation in the literature, which emphasizes the role of the zone center boron mode on modulating the angle of the B-Ni-B tetrahedra. MattheissSSC However, much more needs to be done, with a particular look for novel couplings that would give a negative isotope effect on the gap associated with this band.
The superconducting gap of borocarbides will not be as simple as calculated by BCS theory. The finite intensity below the gap observed in our Raman measurements (Figs. 1 and 2 andyang ), a nearly behavior of the electronic specific heat,cp and evidence of small gap on the small pocket Fermi surface from de Haas-van Alphen measurementspocket of superconducting Ni2B2C ( = Y, Lu) system are good indications of the complex nature of the gap of borocarbide superconductors.
In conclusion, we observed a negative boron isotope effect of the gap-like feature in B2g electronic Raman spectra from YNi2B2C single crystals. For LuNi2B2C, the negative isotope effect is weaker, and may be zero within our experimental resolution. A likely explanation is that the Raman vertex selectively probes those portions of the Fermi surface which show a negative boron-isotope effect of the order parameter in the superconducting state. We have suggested that this may occur at the X point, the corner of the Brillouin zone in the basal plane.
ISY is grateful for the financial support of the Korea Research Foundation through a grant number KRF-2000-015-DS0014. MVK was partially supported under NSF 9705131 and through the STCS under NSF 9120000. Ames Laboratory is operated by the U.S. Department of Energy by Iowa State University under Contract No. W-7405-Eng-82.
References
- (1) K.O. Cheon et al., Physica C 312, 35 (1999).
- (2) S. B. Dierker et al., Phys. Rev. Lett. 50, 853 (1983); R. Hackl et al., J. Phys. C16, 1729 (1983); R. Hackl et al., Physica C 162-164, 431 (1989).
- (3) R. Hackl et al., Phys. Rev. B 38, 7133 (1988); S. L. Cooper et al., Comments Cond. Mat. Phys. 15, 99 (1990); M. Krantz et al., J. Low Temperature Physics 99, 205 (1995).
- (4) P. C. Canfield et al., Physics Today 51, 40 (1998).
- (5) M. Xu et al., Physica C 227, 321 (1994).
- (6) M. R. Eskildsen et al., Phys. Rev. Lett. 79, 487 (1997).
- (7) V. G. Hadjiev et al., Phys. Rev. B 50, 16 726 (1994); H.-J. Park et al., Phys. Rev. B 53, 2237 (1996).
- (8) M. Kang et al., unpublished work; M. Kang, Ph.D thesis, University of Illinois (1997).
- (9) M. Sera et al., Phys. Rev. B 54, 3062 (1996).
- (10) In-Sang Yang et al., Phys. Rev. B 62 1291 (2000).
- (11) No such gap-like peak was observed in Ni2B2C ( = Tm, Er, Ho, Dy) systems, even in the superconducting state.
- (12) In-Sang Yang et al., J. Phys. & Chem. of Solids, to be published.
- (13) R.J. Miller et al., Phys. Rev. Lett. 34, 144 (1975).
- (14) J.P. Franck et al., J. Supercond. 8, 591 (1995).
- (15) L. F. Mattheiss, Phys. Rev. B 49, 13279 (1994).
- (16) W. E. Pickett et al., Phys. Rev. Lett. 72, 3702 (1974).
- (17) J. I. Lee et al., Phys. Rev. B 50, 4030 (1994).
- (18) L. F. Mattheiss et al., Solid State Commun. 91, 587 (1994).
- (19) S. A. Carter et al., Phys. Rev. B 50, 4216 (1994); C. C. Hoellwarth et al., Phys. Rev. B 53, 2579 (1996).
- (20) T. Terashima et al., Phys. Rev. B 56, 5120 (1997).