Interplay Between Time-Temperature-Transformation and
the Liquid-Liquid Phase Transition in Water
Abstract
We study the TIP5P water model proposed by Mahoney and Jorgensen, which is closer to real water than previously-proposed classical pairwise additive potentials. We simulate the model in a wide range of deeply supercooled states and find (i) the existence of a non-monotonic “nose-shaped” temperature of maximum density line and a non-reentrant spinodal, (ii) the presence of a low temperature phase transition, (iii) the free evolution of bulk water to ice, and (iv) the time-temperature-transformation curves at different densities.
Much effort has been invested in exploring the overall phase diagram of water and the connection among its liquid, supercooled and glassy states Debenedetti96 ; Smith99 ; Mishima94 , with particular interest in understanding the origin of the striking anomalies at low temperatures, such as the -dependence of the isothermal compressibility , the constant pressure specific heat , and the thermal expansivity .
The “stability limit conjecture” attributes the increase of the response functions upon supercooling to a continuous re-tracing spinodal line bounding the superheated, supercooled and stretched (negative pressure) metastable states Speedy82 . This line at its minimum intersects the temperature of maximum density (TMD) curve tangentially. More recently, a different hypothesis has been developed, for which the spinodal does not re-enter into the positive pressure region, but rather the anomalies are attributed to a critical point below the homogeneous nucleation line Poole92 . The TMD line, which is negatively sloped at positive pressures, becomes positively sloped at sufficiently negative pressures and does not intersect the spinodal. A line of first order phase transitions — interpreted as the liquid state analog of the line separating low and high density amorphous glassy phases Poole92 ; Mishima94 — develops from this critical point.
Simulations of supercooled metastable states are possible because the structural relaxation time at the temperatures of interest is several orders of magnitude shorter than the crystallization time. It is difficult, but not impossible kusalik95 , to observe crystallization in simulations of molecular models Huitema00 because homogeneous nucleation rarely occurs on the time scales reachable by present day computers. Bulk water simulations have been crystallized by applying a homogeneous electric field Svishchev94 or placing liquid water in contact with pre-existing ice Borzsak99 ; Clancy95 , but spontaneous crystallization of deeply supercooled model water has not been observed in simulations.
In contrast, experimental measurements of metastable liquid states are strongly affected by homogeneous nucleation. The nucleation and growth of ice particles from aqueous solution has been extensively studied, and the “nose-shaped” time-temperature-transformation (TTT) curves have been measured Debenedetti96 ; MacFarlane83 ; Kresin91 . The non-monotonic relation between crystallization rate and supercooling depth results from the competition between the thermodynamic driving force for nucleation and the kinetics of growth Debenedetti96 . Crystallization hinders direct experimental investigation of pure metastable liquid water below the homogeneous nucleation line; only indirect measurements can be made by studying the metastable melting lines of ices Mishima94 .
This work attempts to unify the phenomena connected with the existence of a liquid-liquid phase transition and homogeneous nucleation in a single molecular dynamics simulation study. We simulate a system of molecules interacting with the TIP5P potential Mahoney00 . TIP5P is a five-site, rigid, non-polarizable water model, not unlike the ST2 model Stillinger74 . The TIP5P potential accurately reproduces the density anomaly at 1 atm and exhibits excellent structural properties when compared with experimental data Mahoney00 ; Head-Gordon . The TMD shows the correct pressure dependence, shifting to lower temperatures as pressure is increased. Under ambient conditions, the diffusion constant is close to the experimental value, with reasonable temperature and pressure dependence away from ambient conditions Mahoney00 .
We perform equilibration runs at constant (Berendsen’s thermostat), while we perform production runs in the microcanonical (NVE) ensemble. After thermalization at K we set the thermostat temperature to the temperature of interest. We let the system evolve for a time longer than the structural relaxation time , defined as the time at which , where is the self-intermediate scattering function evaluated at nm-1, the location of the first peak of the static structure factor. In the time , each molecule diffuses on average a distance of the order of the nearest neighbor distance. We use the final configuration of the equilibration run to start a production run of length greater than several and then analyze the calculated trajectory. We check that no drift in any of the studied quantities and no crystallization occurs during the production run.

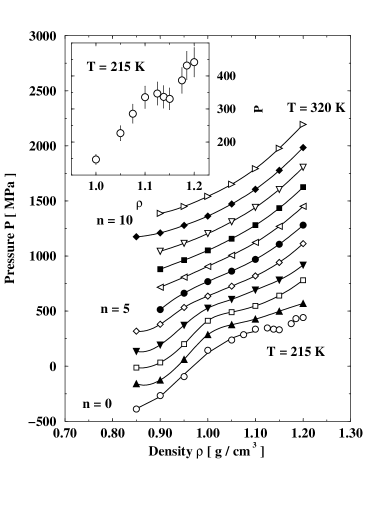
In Fig. 1 we show results for pressure along isotherms. At lower temperatures an inflection develops, which becomes a “flat” isotherm at the lowest temperature, K. The presence of a flat region indicates that a phase separation takes place, and we estimate the critical temperature K, the critical pressure 20 MPa, and the critical density g/cm3.
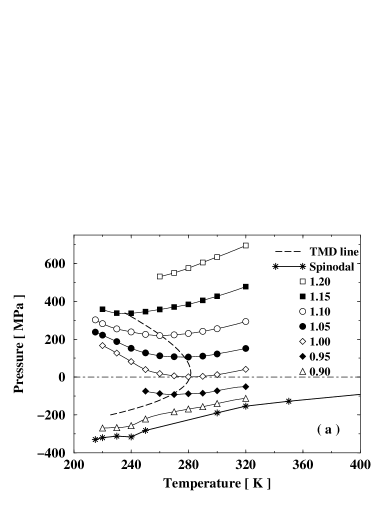
In Fig. 2(a) we plot the pressure along isochores. The curves show minima as a function of temperature; the locus of the minima is the TMD line, since . It can be seen that the pressure exhibits a minimum if the density passes through a maximum (). It is clear that, as in the case of ST2 water, TIP5P water has a TMD that changes slope from negative to positive as P decreases. Notably, the point of crossover between the two behaviors is located at ambient pressure, C , and g/cm3.
We also plot the spinodal line. We calculate the points on the spinodal line fitting the isotherms (for ) of Fig. 1 to the form , where and denote the pressure and density of the spinodal line. This functional form is the mean field prediction for close to a spinodal line. For , we calculate by estimating the location of the minimum of . The results in Fig.2 show that the liquid spinodal line is not reentrant and does not intersect the TMD line highT .
A supercooled liquid is metastable with respect to the crystal, so it is driven to crystallize Debenedetti96 . However, crystallization of model water has not been found in simulations because the homogeneous nucleation time far exceeds the CPU time. However, for TIP5P, crystallization times lie within a time window accessible to present-day simulations, and we observe crystallization at densities g/cm3, and g/cm3 for a wide range of temperatures (Fig. 3).
To quantify the crystallization process, we analyze four independent configurations thermalized at temperature K and instantaneously quenched to the temperature of interest. We monitor the potential energy as well as the time evolution of the structure factor at all wave vector values, ranging from the smallest value allowed by the side of the simulation box up to nm-1. The oxygen density fluctuation , where is the oxygen coordinate of molecule . The onset of crystallization coincides with the occurrence of (i) a sudden drop in potential energy and (ii) a sharp increase in the density fluctuations at one or more wave vector values. When crystallization occurs, the value of jumps from (1) in the liquid to (N).
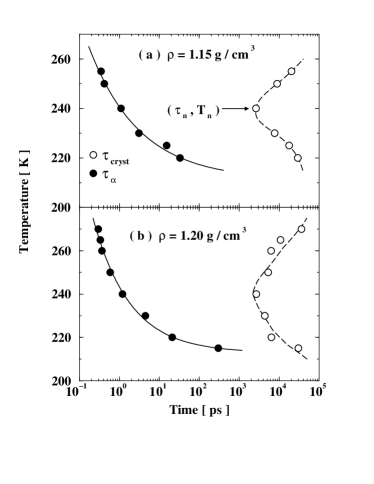
Defining the crystallization time is somewhat arbitrary because of the stochasticity which accompanies the onset of crystallization and the definition of the critical nucleus. We define as the time at which any density fluctuation grows above a threshold value and remains continuously above the threshold for a time exceeding ps. This threshold prevents transient density fluctuations from being attributed to crystallization. We also perform calculations for other definitions of and , but the above values are sufficient to unambiguously identify the onset of crystallization without requiring excessive simulation time. Fig. 3 shows the crystallization times , averaged over the four independent runs, for two different densities and for a broad range of . The resulting TTT curve shows a characteristic “nose” shape, arising from the competition between two effects, the thermodynamic driving force for nucleation and the kinetics of growth Debenedetti96 ; kusalik95 . As temperature is lowered, both the thermodynamic driving force and the relaxation time increase, and it becomes more difficult for particles to diffuse to the energetically-preferred crystalline configuration. For both densities, , and g/cm3, the at which nucleation is fastest is around K. At this , the onset of crystallization requires about ns. At the lowest studied , the crystallization time has grown to ns.
Fig. 3 also shows the relaxation times . The dependence of can be described by a power law , in agreement with the prediction of mode coupling theory leshouches . Since the relation holds at each temperature, including in the deeply supercooled region, “equilibrium” studies of metastable water can be achieved before nucleation takes place. The liquid can be connected to the deeply supercooled state via “equilibrium” metastable states if we choose a quench rate larger than the critical cooling rate , where is the melting and and locate the nose in the TTT curve Debenedetti96 . For TIP5P, K/s at the two studied densities. For g/cm3 and K, we observe only one (out of four) crystallization event within a time of 70 ns. For densities smaller than g/cm3, we observe no crystallization events within a time of 60 ns and hence we can only estimate that is smaller than K/s (the experimental value for water at ambient pressure is K/s uhlmann72 ).
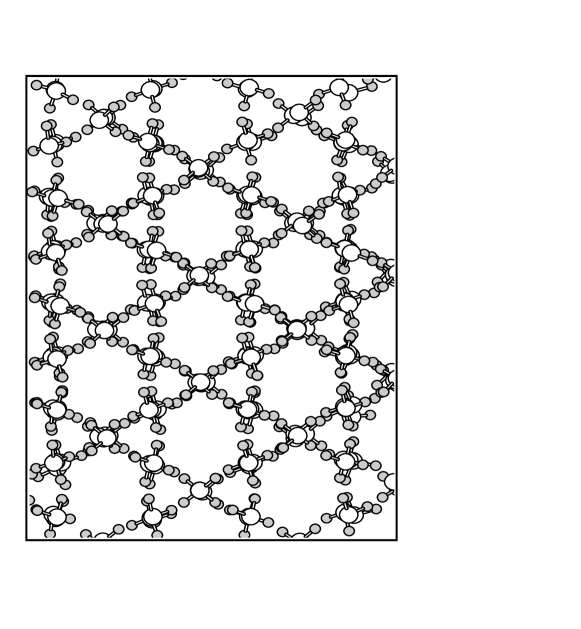
In Fig. 4 we show a typical crystal configuration. The crystal structure, after energy minimization at constant volume, is a proton-ordered structure similar to ice-B, first observed by Baez and ClancyClancy95 . Ice-B is a variant of the ice IX structure, which is the proton-ordered form of ice III. The density of ice IX and ice III is in fact g/cm3, close to our value.
We have shown that the liquid-liquid phase separation can be observed in metastable equilibrium (i) if the cooling rate is faster than , and (ii) if the observation time is shorter than the crystallization time at the critical point. While both such conditions can be realized in numerical simulations — as shown here — they cannot be met in experiments. Our simulations also show that a continuity of states between liquid and glassy phases of water exists Hallbrucker89 . Liquid states below the crystallization temperature can be accessed provided the cooling rate exceeds .
We acknowledge useful discussions with D. R. Baker, G. Franzese, W. Kob, E. La Nave, M. Marquez and C. Rebbi. We acknowledge support from the NSF Grant CHE-0096892. M. Y. acknowledges support from NSF Grant GER-9452651 as a Graduate Research Trainee at the Boston University Center for Computational Science. F. S. acknowledges support from MURST COFIN 2000 and INFM Iniziativa Calcolo Parallelo.
References
- (1) P. G. Debenedetti, Metastable Liquids (Princeton University Press, Princeton, 1996).
- (2) R. S. Smith and B. D. Kay, Nature (London) 398, 788 (1999).
- (3) O. Mishima, J. Chem. Phys. 100, 5910 (1994); Phys. Rev. Lett. 85, 334 (2000); O. Mishima and H. E. Stanley, Nature (London) 392, 164 (1998); ibid. 396, 329 (1998).
- (4) R. J. Speedy, J. Chem. Phys. 86, 982 (1982).
- (5) P. H. Poole et al., Nature (London) 360, 324 (1992); Phys. Rev. E 48, 3799 (1993); Phys. Rev. E 48, 4605 (1993); Phys. Rev. E 55, 3799 (1997).
- (6) I. M. Svishchev and P. G. Kusalik, Phys. Rev. Lett. 75, 3289 (1995).
- (7) For the case of atomic systems see, e.g. H. E. A. Huitema, J. P. van der Eerden, J. J. M. Janssen, and H. Human, Phys. Rev. B 62, 14690 (2000).
- (8) I. M. Svishchev and P. G. Kusalik, Phys. Rev. Lett. 73, 975 (1994).
- (9) I. Borzsák and P. T. Cummings, Chem. Phys. Lett. 300, 359 (1999).
- (10) L. A. Baez and P. Clancy, J. Chem. Phys. 103, 9744 (1995).
- (11) D. R. MacFarlane, R. K. Kadiyala, and C. A. Angell, J. Chem. Phys. 79, 3921 (1983).
- (12) M. Kresin and Ch. Körber, J. Chem. Phys. 95, 3921 (1991).
- (13) M. W. Mahoney and W. L. Jorgensen, J. Chem. Phys. 112, 8910 (2000); ibid 114, 363 (2001).
- (14) F. H. Stillinger and A. Rahman, J. Chem. Phys. 60, 1545 (1974).
- (15) J. M. Sorenson, G. Hura, R. M. Glaeser, and T. Head-Gordon, J. Chem. Phys. 113, 9149 (2000).
- (16) We also calculated the TIP5P isotherms at high to provide an estimate of the location of the liquid-gas critical point, the terminus of the liquid spinodal line. We find 530 K, g/cm3, 10 MPa, in rough agreement with the experimental values.
- (17) W. Götze, in Liquids, Freezing, and Glass Transition, Proc. Les Houches, edited by J. P. Hansen, D. Levesque, and J. Zinn-Justin (North-Holland, Amsterdam, 1991).
- (18) D. R. Uhlmann, J. Non-cryst. Solids 7, 337 (1972).
- (19) A. Hallbrucker et al., J. Phys. Chem. 93, 4986 (1989).