Optimal prediction of folding rates and transition state placement from native state geometry
Abstract
A variety of experimental and theoretical studies have established that the folding process of monomeric proteins is strongly influenced by the topology of the native state. In particular, folding times have been shown to correlate well with the contact order, a measure of contact locality. Our investigation focuses on identifying additional topologic properties that correlate with experimentally measurable quantities, such as folding rates and transition state placement, for both two- and three-state folders. The validation against data from forty experiments shows that a particular topologic property which measures the interdepedence of contacts, termed cliquishness or clustering coefficient, can account with significant accuracy both for the transition state placement and especially for folding rates, the linear correlation coefficient being . This result can be further improved to , by optimally combining the distinct topologic information captured by cliquishness and contact order.
I Introduction
In the past three decades, there has been a growing effort of the scientific community for studying and understanding the principles that govern the folding process of a sequence of amino acids in the corresponding native structure Anfinsen (1973); Creighton (1993); Branden and Tooze (1991). In recent years, several proteins, in particular those folding via a two-state mechanism Jackson and Fersht (1991) have provided an extraordinary benchmark for experimental and theoretical characterization of the folding pathways. The significant amount of experimental data available for several structurally unrelated proteins Jackson and Fersht (1991); Jackson (1998); Huang and Oas (1995); Burton et al. (1996); Kragelund et al. (1995, 1996); Mines et al. (1996); Schonbrunner et al. (1997); Reid et al. (1998); Grantcharova and Baker (1997); Villegas et al. (1995); Khorasanizadeh et al. (1993); Scalley et al. (1997); Silow and Oliveberg (1997); Van Nuland et al. (1998); Taddei et al. (1999); Ferguson et al. (1999); Smith et al. (1996); Kuhlman et al. (1998); Hamill et al. (1998); Tan et al. (1996), has opened the possibility to identify and isolate the factors that influence the folding rate. Besides considering detailed chemical interaction, such as those affecting free-energy barriers, an appealing and elegant line of investigation has focused on the effects of the native state structure on the folding process Plaxco et al. (1998a); Debe and Goddard III (1999); Dinner and Karplus (2001); Ivankov and Finkelstein (2001).
From a qualitative point of view, the influences of structural effects was traditionally summarised in the tenet that proteins with high helical content fold faster than proteins with mixed alpha/beta content, the slowest folding being for the all-beta ones. This useful and intuitive rule of thumb, fails to account for the very different rates observed between proteins in each of the alpha, alpha/beta or beta families Jackson (1998); Aurora et al. (1997); Maritan et al. (2000a); Capaldi and Radford (1998). A deep insight into this problem was provided by the work of Plaxco et al. Plaxco et al. (1998a) who introduced the concept of contact order, which captures, quantitatively, features beyond the mere secondary structure motifs. The highly significant correlation of contact order and experimental folding rates shows the extent to which the mere topology of native state can influence the folding process. However, the highly organised native structure of proteins is too rich to be captured by a single parameter such as the contact order. Indeed, the latter cannot account in the same satisfactory way for the transition state placement, three-state folding rates or the diversity of folding rates among structurally similar proteins Clarke et al. (1999).
In the present study we investigate how the topology of the native state can be further exploited to provide optimised predictions for protein folding rates and the transition state placement. To do so we consider, among others, one particular topological descriptor that is crucial for characterising the connection and interactions of native contacts: the clustering coefficient , or cliquishness. Such parameter, heavily studied in the context of graph theory Bollabas (1985); Watts and Strogatz (1998); Strogatz (2001) is shown to have highly significant correlation with folding rates. The advantage of using this topologic descriptor is that it allows to capture the cooperative formation of native interactions, as proved by its statistically relevant correlations with the transition state placement. Further, we discuss how the different topologic aspects captured by the cliquishness and contact order can be combined to yield optimal correlations higher than for the individual descriptors.
II Theory and Results
Customarily, at the heart of theoretical or numerical studies of topology-based folding models is the contact matrix (or map) Go and Scheraga (1976) which will be used extensively also in the present context. The generic entry of the contact map, , takes on the value 1 if residues and are in contact and zero otherwise. Several criteria can be adopted to define a contact; in the present study we consider two amino acids in interaction if any pair of heavy atoms in the two amino acids are at a distance below a certain cutoff, . All values of between 3.5 Å and 8 Å have been considered and reported. The contact map provides a representation for the spatial distribution of contacts in the native structures that is both concise and often reversible (since native structures can be recovered when appropriate values of are used). Plaxco and coworkersPlaxco et al. (1998a) have used the contact map to describe and characterize the presence and organization of secondary motifs in protein structures. The parameter that was introduced, the relative contact order, provides a measure of the average sequence separation of contacting residues and is defined as
| (1) |
where and run over the sequence indeces, is the contact degeneracy (i.e. the number of pairs of heavy atoms in interaction) and is the protein length. Remarkably, the contact order was shown have a highly significant linear correlation with experimental folding rates. The result of Plaxco and coworkers can be explained, a posteriori, with intuitive arguments: a high contact order corresponds to few local interactions. One may thus expect that the route from the unfolded ensemble to the native state is slow, being hindered by the overcoming of several barriers Bryngelson et al. (1995); Wolynes et al. (1995); Dill and Chan (1997); Dobson et al. (1998); Sali et al. (1994) due to spacial restraints, as recently analysed by Debe and Goddard Debe and Goddard III (1999) and previously by Chan and Dill Chan and Dill (1990) and also observed in topology-based numeric studies Cecconi et al. (2001). These considerations are based purely on geometric arguments and do not take into account the influence of specific interactions between the residues. In principle, the latter may well override the topological influence on the folding process, but surprisingly, as remarked in a recent review article Baker (2000) this is often not the case Cecconi et al. (2001); Micheletti et al. (1999); Clementi et al. (2000); Galzitskaya and Finkelstein (1999); Munoz et al. (1999); Alm and Baker (1999); Klimov and Thirumalai (2000).
Our aim is to exploit as much as possible the topologic information contained in the native state to improve both the accuracy of predictions for folding rates and gain more fundamental insight into the process. To this purpose we have considered additional topologic descriptors besides the contact order. The one that appeared most significant is a parameter termed cliquishness or clustering coefficient Bollabas (1985); Watts and Strogatz (1998); Strogatz (2001). For a given site, , the cliquishness is defined as:
| (2) |
where is the number of contacts to which site takes part to. As for the contact order, also the cliquishness has an intuitive meaning; in fact it provides a measure of the extent to which different sites interacting with are also interacting with each other. Of course, the cliquishness is properly defined only if site is connected to, at least, two other sites. To ensure this, we included also the covalently bonded interactions in (2). The importance of taking the cliquishness into account for discriminating fast/slow folders can be anticipated since a higher interdependency of contacts (large cliquishness) will likely result in a more cooperative folding process. In fact, the formation of a fraction of interactions will result in the establishment of a whole network of them. Consistently with this intuitive picture one should also expect that a large/small cliquishness will affect in different ways the amount of native-like content of the transition state.
We have tested and verified these expectations by calculating the average cliquishness for 40 proteins for which folding rates and transition state placement, , have been measured. is deduced from the variation of folding/refolding rates upon change of denaturant concentration ( and ) and provides an indirect indication of how much the solvent-exposed surface of the transition state is similar to that of the native one. ranges between 0 and 1; higher values denote stronger similarity with the native state. It is worth pointing out that, although the model underlying the calculation of relies on a two-state analysis, an effective can be inferred for three-state folders as well Jackson (1998). Since reliable ’s are not available for all proteins, the number of entries used to correlate the cliquishness and (see Tables 1 and 2) is slightly smaller than that used for tge logarigthm of refolding rates, . The set of proteins used, shown in Tables 1 and 2, was built up from experimental data collected in previous studies and predictions (often topology-based) of folding rates Jackson (1998); Plaxco et al. (1998a); Debe and Goddard III (1999); Dinner and Karplus (2001); Ivankov and Finkelstein (2001).
As indicated, the entries include both two-state and three-state folders, proteins belonging to the same structural family as well as proteins under different experimental conditions. This allows to examine to what extent predicted folding rates are consistent with the wide variations of folding velocities observed in structurally-related proteins and in different experimental conditions. As discussed in detail below, when the comprehensive set of Table 1 and 2 is used, the correlation found between cliquishness and folding rates is 0.71, with a statistical significance of , more relevant than the one between a suitably defined contact order and folding velocities (, ). As will be shown, the predicting power of the two quantities can be combined to achieve the optimal correlation of 0.74.
The prediction of the transition state placement, turns out to be more difficult when either of the two topologic parameters is used. While for the contact order it is equal to 0.23, the cliquishness yields the value of 0.48 which is not significantly improved by combining the two descriptors. Though the linear correlation of the clustering coefficient and the transition state placement is not as high as for the folding-rate case it is nevertheless statistically meaningful, having a probability of 0.004 to have arisen by chance.
II.1 Two- and three-state folders
Before considering the more general case of all entries in Tables 1 and 2, we focus on two-state folders, i.e. proteins with a cooperative (all-or-none) transition between the unfolded and folded states. The neatness of this process, due to the absence of any significantly populated intermediate state, makes them ideal candidates for identifying and isolating the factors that influence the folding rate.
In the present context this separate test is important since it appears that the relative contact order is a much stronger descriptor for two-state folders, than for the general case. As a matter of fact, when both two- and three-state folders are considered, the influence of the average sequence separation of native contacts on folding properties is better captured by a different version of the contact order, which we shall term “absolute”, obtained when the r.h.s. of eq. (1) is not divided by :
| (3) |
In the following we shall report and compare the performance of both parameters; furthermore we shall always consider the absolute value of the linear correlation coefficients, , without regard to its sign, which can be easily inferred from the plots.
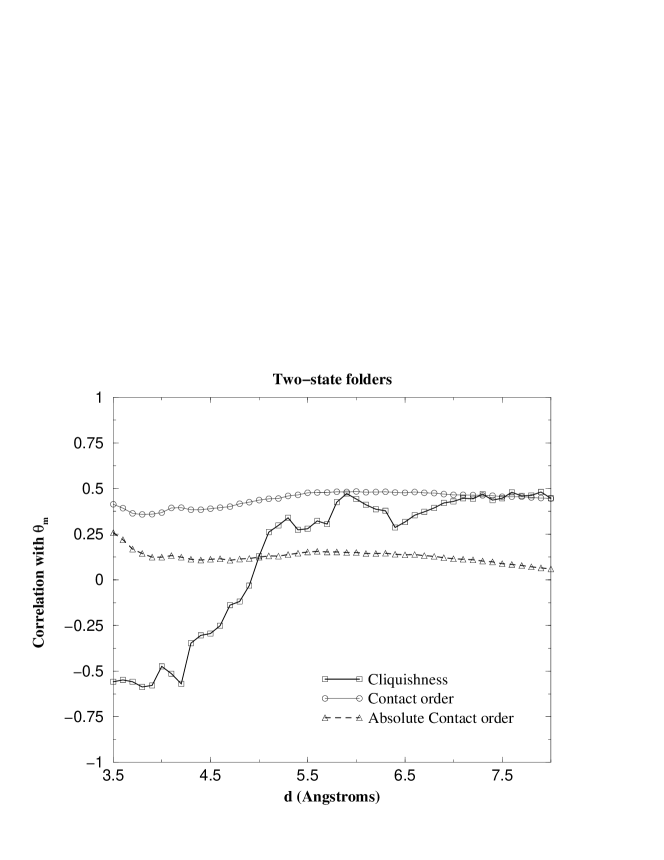
The original definition of contact order has an unrivaled performance in the prediction of folding rates for the two-state folders of Table 1. As visible in Fig. 1, it gives a stable correlation for cutoffs in the range 5 Å 7 Å, with the maximum value of for the cutoff Å. The statistical significance of such correlation can be quantified through a calculation of the probability, , to observe by pure chance a correlation higher than the measured one (in modulus). The standard model underlying such estimates relies on the hypothesys of normal distribution of the deviates of the correlated quantities. As a rule of thumb, the upper value of is taken as a threshold for statistically meaningful correlations. For the value of reported above, this probability is , which is, therefore, extremely significant.
Consistently with previous results, we found that the transition state placement is a much more elusive quantity to predict than folding rates. In fact, all topologic descriptors yield a poorer correlation compared to (see Fig. 2). For the relative contact order, the best is 0.48 (for ) with an associated . As anticipated, the performance of the absolute contact order in this particular context is significantly inferior then the relative one (see Figs. 1 and 2) and hence will not be further commented.
Concerning the performance of the novel parameter under scrutiny, the cliquishness, it can be seen from Figs. 1 and 2 that it is statistically meaningful for both folding rates and transition state placement. There are, however, significant differences with respect to the contact order. For folding rates the optimal is 0.67 ( Å) and the associates value of is 5 , one order of magnitude larger than for the relative contact order. For the situation is reversed since the optimal value of (for Å) has the statistical relevance of , with a marked improvement over the previous case.
It is also interesting to note that cliquishness-based correlations have a non-trivial dependence on the cutoff . In fact, due to the overall compactness and steric effects, the degree of dispersion of the cliquishness values for different sites in the same or different proteins is much more limited compared, e.g. to the average sequence separation of contacts. This leads to the observed decay of the correlations when the cutoff is increased.
The applicability of topology-based models are not limited to two-state folder, but can be extended to include three-state folders as well Micheletti et al. (1999); Clementi et al. (2000). Despite the addition of the 11 entries corresponding to three-state folders, the performance of cliquishness-based predictions for folding rates and improves from the values reported for two-state folders. As shown in Figs 3 and 4 the associated optimal correlations for and are and 0.49, again observed for the same cutoff values () mentioned for the two-state case. The corresponding statistical significances are now, and , which, despite the enlargement of the experimental set, show even an improvement over the two-state case.
From Figs. 3 and 4 it can be noticed that the performance of the relative contact order is noticeably poorer than the absolute contact order which, being a much better descriptor, becomes the focus of our analysis. The corresponding measured correlations are, in fact, for and for with corresponding values of and .
A direct comparison of how the clustering coefficient and the absolute contact order correlate with and can be made by inspecting the plots of Figs. 5 and 6. It is worth pointing out that the analysis of the deviations from the linear trends of Figs. 5 and 6 reveals that a particular protein, 1urn, is among the top outliers for both cliquishness and contact order-based analysis, although no simple explanations is available for this singular behaviour. Although for both folding parameters the cliquishness gives a more significant correlation than contact order, the difference is particularly dramatic for the transition state placement which is notoriously difficult to capture with topology-based predictions Plaxco et al. (1998a).
An important conclusion stemming out of this observation is that the transition state structure (and hence ) is more influenced by the degree of interdependency of native contacts than their average sequence separation. This is in accord with the intuition that highly interdependent contacts may mutually enhance their probability of formation, thus facilitating the progress towards the native state during the folding process. This is, indeed, consistent with the negative correlation observed between cliquishness and native content, , at the transition state. It is important to stress that the presence and effects of the cooperative formation of native interactions cannot be captured by parameters based on measures of contact locality. This highlights the importance of considering all viable topologic descriptors to characterize the folding process, since they do not impact in the same way on various folding properties.
II.2 Optimal combined correlation
A natural question that arises is whether it is possible to combine the predicting power of cliquishness and contact order to achieve correlations with experimental folding rates and transition state placements that are better than the individual cases.
Indeed, as shown in Appendix A, it is straightforward to combine in an optimal linear way the two quantities to improve the prediction accuracy. The quantitative increment in the correlation is clearly related to the amount of independent information contained in the two topologic descriptors. Hence, an important issue is to what extent cliquishness and contact order are mutually correlated.
If, in place of a physical contact map, , one uses a random symmetric matrix, no meaningful correlation will be found. The contact maps of real proteins, however, display features that are highly non-random which reflect both (i) the physical constraints to which a compact three-dimensional chain is subject and (ii) the presence and organisation of secondary motifs Chothia (1984, 1992); Levitt and Chothia (1976); Rose and Seltzer (1977).
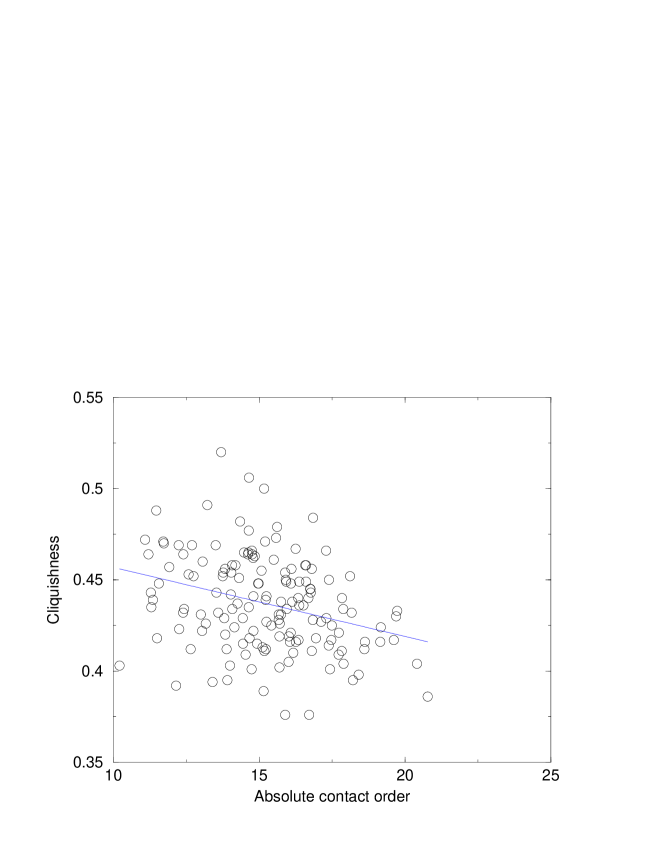
With the aid of numeric simulations it was possible to assess the degree of interdependency of clustering coefficient of native contacts and their average sequence separation resulting from the first of the mentioned effects. This was accomplished by considering, in place of the proteins of tables 1 and 2, 150 computer-generated compact structures respecting basic steric constraints found in real proteins (details can be found in the Methods section). As visible in the plot of Fig. 8 the level of mutual contact order-cliquishness correlation observed in these artificial structures is which is significantly smaller than the actual correlation of the two quantities found in real proteins. In fact, the typical correlation for cliquishness and contact order (either relative or absolute) is around 0.65. Such non trivial correlation can been ascribed to the special topologic properties of naturally occurring proteins whose ramifications have been investigated in a variety of contexts Maritan et al. (2000a, b); Denton and Marshall (2001); Micheletti et al. (1999); Hunt et al. (1994); Socci et al. (1994). Thus, the very presence and organization of secondary motifs in proteins makes it possible, on one hand, to exploit the native topology to predict e.g. folding rates, while on the other it limits the amount of independent information contained in different topologic descriptors.
Nevertheless, since the mutual correlation is not perfect, it is still possible to achieve, by definition, better predictions by combining cliquishness and contact order. The degree of enhancement depends also on the statistical significance of the individual starting correlations. For these reasons, the improvement is noticeable for folding rates, while it is not significant for transition state placement. For the case of two-state folders, the optimal combination yields correlations of while for the more general case of two and three-state folding rates one has which leads to a discernible improvement over previous cases, as visible in Fig. 7. To the best of our knowledge, this is the highest correlation recorder among similar studies involving a comparable number of entries (also including non-linear prediction schemes Dinner and Karplus (2001)). Due to the fact that the optimal combined correlations are found a posteriori, the associated values of are no more meaningful indicators of statistical significance.
Besides the cliquishness, we have investigated other parameters that are routinely used to characterise general networks (networks of contacts in our case). In particular, we considered the “diameter” of the contact map, defined as the largest degree of separation between any two residues, and also its average value. The diameter measures the maximum number of contact that need to be traversed to connect an arbitrary pair of distinct residues. Although the contact-map diameter is an abstract object, it conveys relevant topological information about protein structure, since it measures the long-range structural organisation. We found, a posteriori, that neither the maximum, nor the average diameter, correlate in a significant manner with the folding rate or transition state placement.
III Conclusions
We have analysed important topological descriptors of organised networks (in our case the spatial network of native contacts) that could be used, individually, or in mutual conjunction, to describe and predict experimental parameters used to characterize the folding process. It is found that, besides the previously introduced contact order, a topologic parameter, termed cliquishness or clustering coefficient, is a powerful indicator of both the folding velocity and the transition state placement for two- and three-state folders. The predicting power of the cluquishness is that it takes into account the presence and organisation of clusters of interdependent contacts that are putatively responsible for the cooperative formation of native-like regions. This property appears well-suited to reproduce important features in the transition state that are otherwise elusive to other topologic analysis. The high statistical significance of the observed correlations testifies the strong influence of geometric structural issues on the folding process. The maximum predicting power is obtained when the topologic information contained in the cliquishness is used in combination with the contact order; this allows to reach a linear correlation as high as 0.74 with experimental folding rates recorder in 40 experimental measurements.
IV Methods
IV.1 Cross correlations
The linear correlation between two sets of data, and is obtained from the normalised scalar products of the covariations:
| (4) |
Without loss of generality, in the following we shall consider the sets of data to be with zero average and with unit norm, so that the expression of the correlation simplifies
| (5) |
We now formulate the following problem. Two sets of data, and have linear correlation and respectively with a third (reference set), . What is the maximum and minimum correlations we can expect between sets and ? We assume that and are positive since this condition can always be met by changing sign, if necessary, to the vector components.
The answer is easily found by decomposing and into their components parallel and orthogonal to :
| (6) |
Since is equal to , and hence is fixed, the maximum [minimum] correlation is found when and are [anti]parallel. Thus,
| (7) |
Now we turn to a different, but related problem. How can we combine linearly and , so to have the maximum correlation with . The generic linear combination,
| (8) |
leads to the following correlations
| (9) |
The maximum is achieved for
| (10) |
which yields
| (11) |
IV.2 Generation of alternative compact structures
To generate the thirty randomly-collapsed structures used in the comparison of Fig. 8, we adopted a Monte Carlo technique. The length of the artificial proteins ranged uniformly in the interval 80-110. Starting from an open conformation, each structure was modified under the action of typical MC moves (single-bead, crankshaft, pivot) Sokal (1996). A newly generated modified configuration is accepted according to the ordinary Metropolis rule. The energy scoring function is composed of two terms: The first one contains a homopolymeric part that rewards the establishment of attractive interactions (cutoff of 6.0 Å) between any pair of non-consecutive residues. The second term is introduced to penalise structure realisations with radii of gyration larger than that found in naturally-occurring proteins with the same length. The Monte Carlo evaluation is embedded in a simulated annealing scheme Kirkpatrick et al. (1983) which allows to minimise efficiently the scoring function by slowly decreasing a temperature-like control parameter.
V Acknowledgements
We are indebted with Amos Maritan for several illuminating discussions and with Fabio Cecconi and Alessandro Flammini for a careful reading of the manuscript. Support from INFM and MURST Cofin99 is acknowledged.
References
- Anfinsen (1973) C. Anfinsen, Science 181, 223 (1973).
- Creighton (1993) T. Creighton, Proteins, structure and molecular properties (W.H.Freeman and Company, New York, 1993), 2nd ed.
- Branden and Tooze (1991) C. Branden and J. Tooze, Introduction to protein structure (Garland Publishing, New York, 1991).
- Jackson and Fersht (1991) S. E. Jackson and A. R. Fersht, Biochemistry 30, 10428 (1991).
- Jackson (1998) S. E. Jackson, Folding and Design 3, R81 (1998).
- Huang and Oas (1995) G. S. Huang and T. G. Oas, Biochemistry 34, 3884 (1995).
- Burton et al. (1996) R. E. Burton, G. S. Huang, M. A. Daugherty, P. W. Fullbright, and T. G. Oas, J. Mol. Biol. 163, 311 (1996).
- Kragelund et al. (1995) B. B. Kragelund, C. V. Robinson, J. Knudsen, C. M. Dobson, and F. M. Poulsen, Biochemistry 34, 7217 (1995).
- Kragelund et al. (1996) B. B. Kragelund, P. Hojrup, M. S. Jensen, Schjerling, E. Juul, J. Knudsen, and F. M. P. FM, J. Mol. Biol. 256, 187 (1996).
- Mines et al. (1996) G. A. Mines, T. Pascher, S. C. Lee, J. R. Winkler, and H. B. Gray, Chem. Biol. 3, 491 (1996).
- Schonbrunner et al. (1997) N. Schonbrunner, K. P. Kofler, and T. Kiefhaber, J. Mol. Biol. 268, 526 (1997).
- Reid et al. (1998) K. L. Reid, H. M. Rodriguez, B. J. Hillier, and L. M. Gregoret, Protein Sci. 7, 470 (1998).
- Grantcharova and Baker (1997) V. P. Grantcharova and D. Baker, Biochemistry 36, 15685 (1997).
- Villegas et al. (1995) V. Villegas, A. Azuaga, L. Catasus, D. Reverter, P. L. Mateo, F. X. Aviles, and L. Serrano, Biochemistry 34, 15105 (1995).
- Khorasanizadeh et al. (1993) S. Khorasanizadeh, I. D. Peters, T. R. Butt, and H. Roder, Nat. Struct. Biol. 3, 193 (1993).
- Scalley et al. (1997) M. L. Scalley, Q. Yi, H. D. Gu, A. McCormack, J. R. Yates, and D. Baker, Biochemistry 36, 3373 (1997).
- Silow and Oliveberg (1997) M. Silow and M. Oliveberg, Biochemistry 36, 7633 (1997).
- Van Nuland et al. (1998) N. A. J. Van Nuland, W. Meijberg, J. Warner, V. Forge, R. M. Schee, G. T. Robillard, and C. M. Dobson, Biochemistry 37, 622 (1998).
- Taddei et al. (1999) N. Taddei, F. Chiti, P. Paoli, T. Fiaschi, M. Bucciantini, M. Stefani, C. M. Dobson, and G. Ramponi, Biochemistry 38, 2135 (1999).
- Ferguson et al. (1999) N. Ferguson, A. P. Capaldi, R. James, C. Kleanthous, and S. E. Radford, J. Mol. Biol. 286, 1597 (1999).
- Smith et al. (1996) C. K. Smith, Z. M. Bu, J. M. S. K. S. Anderson, D. M. Engelman, and L. Regan, Protein Sci 5, 2009 (1996).
- Kuhlman et al. (1998) B. Kuhlman, D. L. Luisi, P. A. Evans, and D. P. Raleigh, J. Mol. Biol. 284, 1661 (1998).
- Hamill et al. (1998) S. J. Hamill, A. E. Meekhof, and J. Clarke, Biochemistry 37, 8071 (1998).
- Tan et al. (1996) Y.-J. Tan, M. Oliveberg, and A. R. Fersht, J. Mol. Biol. 264, 377 (1996).
- Plaxco et al. (1998a) K. W. Plaxco, K. T. Simons, and D. Baker, J. Mol. Biol. 277, 985 (1998a).
- Debe and Goddard III (1999) D. A. Debe and W. A. Goddard III, J. Mol. Biol. 294, 619 (1999).
- Dinner and Karplus (2001) A. R. Dinner and M. Karplus, Nat. Struct. Biol. 8, 21 (2001).
- Ivankov and Finkelstein (2001) D. N. Ivankov and A. Finkelstein, Biochemistry 40, 9957 (2001).
- Aurora et al. (1997) R. Aurora, T. P. Creamer, R. Srinivasan, and G. D. Rose, J. Mol. Biol. 272, 1413 (1997).
- Maritan et al. (2000a) A. Maritan, C. Micheletti, and J. R. Banavar, Phys. Rev. Lett. 84, 3009 (2000a).
- Capaldi and Radford (1998) A. P. Capaldi and S. E. Radford, Curr. Op. Str. Biol. 8, 86 (1998).
- Clarke et al. (1999) J. Clarke, E. Cota, S. B. Fowler, and S. J. Hamill, Structure 7, 1145 (1999).
- Bollabas (1985) B. Bollabas, Random Graphs (Academic, London, 1985).
- Watts and Strogatz (1998) D. J. Watts and S. H. Strogatz, Nature 393, 440 (1998).
- Strogatz (2001) S. H. Strogatz, Nature 410, 268 (2001).
- Go and Scheraga (1976) N. Go and H. A. Scheraga, Macromolecules 9, 535 (1976).
- Bryngelson et al. (1995) J. D. Bryngelson, J. N. Onuchic, N. D. Socci, and P. G. Wolynes, Proteins 21, 167 (1995).
- Wolynes et al. (1995) P. G. Wolynes, J. N. Onuchic, and D. Thirumalai, Science 267, 1619 (1995).
- Dill and Chan (1997) K. A. Dill and H. S. Chan, Nature Structural Biology 4, 10 (1997).
- Dobson et al. (1998) Dobson, C. M., Sali, A., Karplus, and M, Angew. Chem. Int. Edit. 37, 868 (1998).
- Sali et al. (1994) A. Sali, E. Shakhnovich, and M. Karplus, Nature 369, 248 (1994).
- Chan and Dill (1990) H. S. Chan and K. A. Dill, J. Chem. Phys. 92, 3118 (1990).
- Cecconi et al. (2001) F. Cecconi, C. Micheletti, P. Carloni, and A. Maritan, Proteins: Structure Function and Genetics 43, 365 (2001).
- Baker (2000) D. A. Baker, Nature 405, 39 (2000).
- Micheletti et al. (1999) C. Micheletti, J. R. Banavar, A. Maritan, and F. Seno, Phys. Rev. Lett. 82, 3372 (1999).
- Clementi et al. (2000) C. Clementi, H. Nymeyer, and J. N. Onuchic, J. Mol. Biol. 298, 937 (2000).
- Galzitskaya and Finkelstein (1999) O. V. Galzitskaya and A. V. Finkelstein, Proc. Natl. Acad. Sci. USA 96, 11299 (1999).
- Munoz et al. (1999) V. Munoz, E. R. Henry, J. Hofrichter, and W. A. Eaton, Proc. Natl. Acad. Sci. USA 95, 5872 (1999).
- Alm and Baker (1999) E. Alm and D. Baker, Proc. Natl. Acad. Sci. USA 96, 11305 (1999).
- Klimov and Thirumalai (2000) D. K. Klimov and D. Thirumalai, Proc. Natnl. Acad. Sci. USA 97, 7254 (2000).
- Chothia (1984) C. Chothia, Annu. Rev. Biochem. 53, 537 (1984).
- Chothia (1992) C. Chothia, Nature 357, 543 (1992).
- Levitt and Chothia (1976) M. Levitt and C. Chothia, Nature 261, 552 (1976).
- Rose and Seltzer (1977) G. D. Rose and J. P. Seltzer, J. Mol. Biol. 113, 153 (1977).
- Maritan et al. (2000b) A. Maritan, C. Micheletti, A. Trovato, and J. R. Banavar, Nature 406, 287 (2000b).
- Denton and Marshall (2001) M. Denton and C. Marshall, Nature 410, 417 (2001).
- Hunt et al. (1994) N. G. Hunt, L. M. Gregoret, and F. E. Cohen, J. Mol. Biol. 241, 214 (1994).
- Socci et al. (1994) N. D. Socci, W. S. Bialek, , and J. N. Onuchic, Phys. Rev. E 49, 3440 (1994).
- Sokal (1996) A. D. Sokal, Nuclear Physics B47, 172 (1996).
- Kirkpatrick et al. (1983) S. Kirkpatrick, C. D. Gelatt, and M. P. Vecchi, Science 220, 671 (1983).
- Viguera et al. (1994) A. Viguera, J. Martinez, V. Filimonov, P. Mateo, and L. Serrano, Biochemistry 33, 2142 (1994).
- Chan et al. (1997) C. Chan, Y. Hu, S. Takahashi, D. L. Rousseau, W. A. Eaton, and J. Hofrichter, Proc. Natl. Acad. Sci. USA 94, 1779 (1997).
- Plaxco et al. (1998b) K. Plaxco, J. Guijarro, C. Morton, M. Pitkeathly, I. Campbell, and C. Dobson, Biochemistry 37, 2529 (1998b).
- Perl et al. (1998) D. Perl, C. Welker, T. Schindler, K. Schroeder, M. A. Marahiel, R. Jaenicke, and F. Schmid, Nat. Struct. Biol. 5, 229 (1998).
- Guijarro et al. (1998) I. Guijarro, C. Morton, K. W. Plaxco, I. D. Campbell, and C. Dobson, J. Mol. Biol. 276, 657 (1998).
- Clarke et al. (1997) J. Clarke, S. J. Hamill, and C. M. Johnson, J. Mol. Biol. 270, 771 (1997).
| Protein | Length | Family | ln | Cliquishness | |
|---|---|---|---|---|---|
| ( Å) | |||||
| 1shg Viguera et al. (1994) | 57 | 2.10 | 0.69 | 0.546 | |
| 1lmb Huang and Oas (1995); Burton et al. (1996) | 80 | 8.50 | 0.46 | 0.555 | |
| 2abd Kragelund et al. (1995, 1996) | 86 | 6.55 | 0.61 | 0.550 | |
| 1imq Debe and Goddard III (1999) | 86 | 7.31 | — | 0.545 | |
| 1ycc Mines et al. (1996) | 103 | 9.61 | 0.34 | 0.548 | |
| 1hrc Chan et al. (1997) | 104 | 7.94 | 0.47 | 0.538 | |
| 1hrc, horse, oxidized FeIII Chan et al. (1997) | 104 | 5.99 | 0.40 | 0.538 | |
| 2gb1 Smith et al. (1996) | 56 | 6.26 | — | 0.553 | |
| 2ptl Scalley et al. (1997) | 61 | 4.22 | 0.75 | 0.551 | |
| 2ci2 Jackson and Fersht (1991) | 65 | 3.87 | 0.61 | 0.535 | |
| 1cis Tan et al. (1996) | 66 | 3.87 | 0.61 | 0.540 | |
| 1hdn Van Nuland et al. (1998) | 85 | 2.70 | 0.64 | 0.526 | |
| 1aye Villegas et al. (1995) | 92 | 6.80 | 0.74 | 0.554 | |
| 1urn Silow and Oliveberg (1997) | 96 | 5.73 | 0.55 | 0.520 | |
| 1aps Taddei et al. (1999) | 98 | -1.47 | 0.79 | 0.511 | |
| 1fkb Jackson (1998) | 107 | 1.46 | 0.67 | 0.512 | |
| 2vik Jackson (1998) | 126 | 6.80 | 0.73 | 0.546 | |
| 1srl Grantcharova and Baker (1997) | 56 | 4.04 | 0.69 | 0.536 | |
| 1shf.a Plaxco et al. (1998b) | 59 | 4.55 | 0.68 | 0.534 | |
| 1tud Debe and Goddard III (1999) | 60 | 3.45 | — | 0.531 | |
| 1csp Perl et al. (1998) | 67 | 6.04 | 0.85 | 0.539 | |
| 1mjc Reid et al. (1998) | 69 | 5.23 | 0.91 | 0.532 | |
| 3mef Reid et al. (1998) | 69 | 5.30 | 0.94 | 0.531 | |
| 2ait Schonbrunner et al. (1997) | 74 | 4.20 | 0.65 | 0.542 | |
| 1pks Guijarro et al. (1998) | 76 | -1.05 | 0.60 | 0.545 | |
| 1ten Clarke et al. (1997) | 89 | -1.10 | 0.76 | 0.511 | |
| 1fnf, 9FN-III Clarke et al. (1999) | 90 | -0.90 | 0.63 | 0.513 | |
| 1wit Clarke et al. (1999) | 93 | 0.41 | 0.70 | 0.526 | |
| 1fnf, 10FN-III Clarke et al. (1999) | 94 | 5.00 | 0.65 | 0.536 |
| Protein | Length | Family | ln | Cliquishness | |
|---|---|---|---|---|---|
| ( Å) | |||||
| 1bta | 89 | 3.40 | 0.87 | 0.532 | |
| 1ubq | 76 | 5.90 | 0.59 | 0.532 | |
| 1bni | 108 | 2.60 | 0.88 | 0.524 | |
| 1hel | 129 | 1.30 | 0.75 | 0.507 | |
| 3chy | 128 | 1.0 | 0.71 | 0.512 | |
| 1dk7 | 146 | 0.80 | 0.78 | 0.513 | |
| 2rn2, Urea, pH 5.5 | 155 | -0.50 | 0.80 | 0.502 | |
| 2rn2, GdnHCl, pH 5.5 | 155 | 1.40 | 0.63 | 0.502 | |
| 1php.n | 175 | 2.30 | 0.84 | 0.505 | |
| 1hng, pH 7.0 | 97 | 1.80 | 0.68 | 0.502 | |
| 1hng, pH 4.5 | 97 | 2.63 | 0.62 | 0.502 |
Figure captions
-
•
Fig. 1. Correlation of cliquishness, relative and absolute contact order against folding rates of two-state folders. The values of the correlation coefficients are plotted as a function of the cutoff, , used in the definition of the contact map.
-
•
Fig. 2. Correlation of cliquishness, relative and absolute contact order against transition state placement of two-state folders. The values of the correlation coefficients are plotted as a function of the interaction cutoff, .
-
•
Fig. 3. Correlation of cliquishness, relative and absolute contact order against folding rates of two- and three-state folders. The values of the correlation coefficients are plotted as a function of the cutoff, , used in the definition of the contact map.
-
•
Fig. 4. Correlation of cliquishness, relative and absolute contact order against transition state placement of two- and three-state folders. The values of the correlation coefficients are plotted as a function of the interaction cutoff, .
-
•
Fig. 5. Scatter plot of cliquishness (left) and absolute contact order (right) versus folding rates of the 40 entries of Tables 1 and 2. The used values of are the optimal ones reported in the text. Filled circles, open squares and starred points denote proteins belonging to the , and families, respectively.
-
•
Fig. 6. Scatter plot of cliquishness (left) and absolute contact order (right) versus of the entries of Tables 1 and 2. The used values of are the optimal ones reported in the text. Filled circles, open squares and starred points denote proteins belonging to the , and families, respectively.
-
•
Fig. 7. Scatter plot of the logarithm of folding rates for the entries of Tables 1 and 2, against data from optimally combined cliquishness and contact order. The optimal linear superposition, see Methods, is obtained for , ( and being the cliquishness and contact order data respectively. Filled circles, open squares and starred points denote proteins belonging to the , and families, respectively.
-
•
Fig. 8. Scatter plot of average cliquishness versus absolute contact order, for randomly collapsed structures generated by stochastic numerical methods.