Very low shot noise in carbon nanotubes
Abstract
We have performed noise measurements on suspended ropes of single wall carbon nanotubes (SWNT) between 1 and 300 K for different values of dc current through the ropes. We find that the shot noise is suppressed by more than a factor 100 compared to the full shot noise 2eI. We have also measured an individual SWNT and found a level of noise which is smaller than the minimum expected. Another finding is the very low level of 1/f noise, which is significantly lower than previous observations. We propose two possible interpretations for this strong shot noise reduction: i) Transport within a rope takes place through a few nearly ballistic tubes within a rope and possibly involves non integer effective charges with . ii) A substantial fraction of the tubes conduct with a strong reduction of effective charge (by more than a factor 50).
pacs:
72.70.+mElectronic transport in condensed matter: Noise processes and phenomena:Electronic transport in mesoscopic or nanoscale materials and structures and 73.50.TdElectronic structure and electrical properties of surfaces, interfaces, thin films, and low-dimensional structures:Noise processes and phenomena1 Introduction
Metallic single wall carbon nanotubes (SWNT) are known to be model systems for the study of one dimensional(1D) electronic transport. Depending on diameter and helicity, SWNT have at most 2 conducting channels and in the absence of disorder their minimum resistance is predicted to be Dresselhaus ; Hamada . In 1D, electronic interactions are expected to lead to a breakdown of the Fermi liquid state. Nanotubes should then be described by Luttinger Liquids (LL) theories Kane ; egger , with collective low energy excitations. Indications of the validity of LL description with repulsive interactions in SWNT were given by the measurement of a resistance diverging as a power law with temperature down to 10 K bockrath . It has been shown that another experimental signature of a Luttinger liquid is the existence of non integer charge excitations where g is the Luttinger parameter which depends on the interaction strength ( g=1 in the absence of interactions.) These excitations can in principle be detected in a 2-wire measurement on a sample containing an impurity in the weak backscattering regime blanter ; kanefrac . Indeed, non integer charge excitations create a current noise which has the form:
| (1) |
where is the back-scattered current. Edge states in 2 D electron systems in the fractional quantum Hall regime have provided an elegant demonstration of this prediction exp . However carbon nanotubes, contrary to the edge states in the fractional quantum hall regime, are expected to constitute a non chiral Luttinger Liquid where forward and backward electrons are not spatially separated. Theoretical predictions for the non chiral LL are quite controversial. Although the initial prediction eq.1 kanefrac was obtained for a non chiral infinite LL, it has been recently claimed jap ; trauz that the shot noise in a LL between two reservoirs does not reveal the quasi-particle non integer charge and the authors in trauz predict instead an integer charge of 1e, in the expression of shot noise. These calculations however rely on drastic hypothesis concerning screening of electron interactions and boundary conditions with the reservoirs which validity can be questioned lederer . The investigation of shot noise in carbon nanotubes is therefore an important issue. The measurements we present on SWNT show a surprisingly high shot noise reduction.
2 Experimental set-up
The SWNT are prepared by an electrical arc method with a mixture of nickel and yttrium as a catalyst Journet ; Vaccarini . SWNT with diameters of the order of 1.4 nm are obtained. They are purified by the cross-flow filtration method Vaccarini . The tubes usually come assembled in ropes of a few hundred parallel tubes, but individual tubes can also be obtained after chemical treatment with a surfactant burghard . Isolation of an individual rope and connection to measuring pads are performed according to the following nano-soldering technique. A target covered with nanotubes is placed above a metal-coated MetalCoating suspended membrane, in which a roughly 1 by 100 slit has been etched with a focused ion beam. Following ref. Kasumov2 a focused UV laser beam pulse (power 10 kW) is applied for 10 ns, a nanotube drops from the target and connects the edges of the slit. Since the metal electrodes on each side of the slit are locally molten, the tube gets soldered into good contact. The resulting samples can then be characterized using transmission electronic microscopy. The measurement of large supercurrents when the tubes are soldered to superconducting electrodes Kasumov indicate that the contact resistance is much smaller than the intrinsic resistance of the tubes.
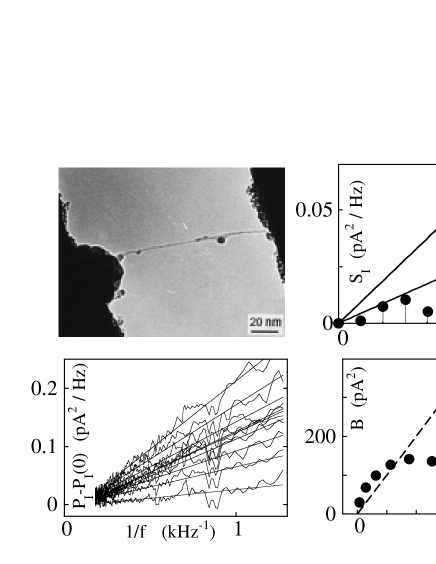
Using this technique, we have obtained individual carbon nanotubes such as the sample presented in fig.(5), with resistances as low as , that present a quasi metallic behavior down to very low temperature with less than a increase of resistance between 300 K and 1 K. Ropes containing few tens of nearly ordered carbon nanotubes soldered using the same technique present a wide range of measured resistances that can vary between and at 300 K. These ropes are generally metallic when their resistances are below at room temperature. The data presented here are taken on ropes that have a resistance less than 1 . (More resistive ropes usually had a level of 1/f noise that prevents the measurement of shot noise.) The temperature dependence of these low resistance ropes (see inset of fig. 1) is also very weak but in contrast with what is observed in individual tubes, it is not monotonous as already reported in fisher . The resistance decreases linearly as temperature is lowered between room temperature and 30 K indicating the freezing-out of phonon modes, and then increases as T is further decreased, just as in individual tubes.
The noise was recorded as a voltage fluctuation across the samples biased with various DC currents . The spectrum of voltage noise power
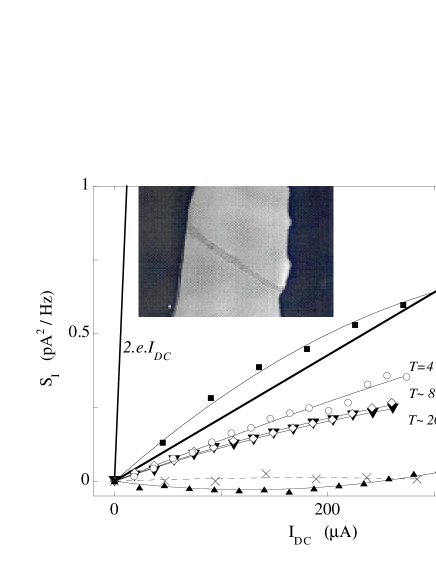
was averaged during over roughly 10 minutes and converted into a current noise according to , where is the sample resistance and is a correction factor which accounts for the finite impedance of the biasing circuit. For all the samples tested, this correction factor never exceeds the value . In practice, a spectrum analyser calculated the noise power spectrum by correlating the output signals from two low noise differential preamplifiers (model LI-75A by NF Electronic Instruments) which were independently connected across the samples. The measuring procedure has been checked by replacing the samples with a macroscopic resistor, for which zero shot noise is expected. The experiment, conducted at 4.2 K, gave the expected result within (see fig. 2). Another validation of the apparatus and correlation procedure was provided by the measurement of the full shot noise 2eI across the PN junction of a commercial transistor at room temperature.
3 Results
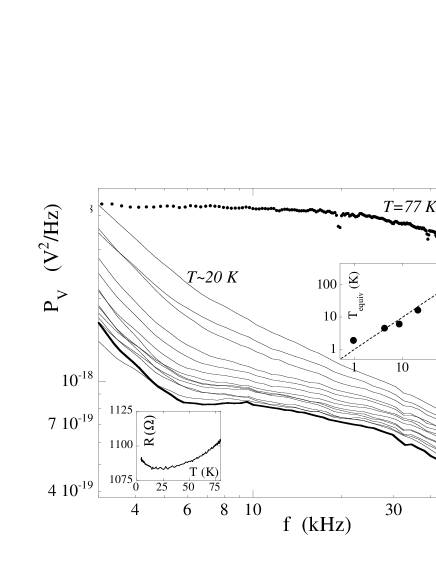
Typical noise spectra obtained on a rope of 200 tubes, which resistance varies between and are shown on fig.1 for currents up to (Rope A). On all spectra, we have eliminated parasitic peaks (due to harmonics of 50 Hz and radiations of monitors and screens), which are independent of . They represent about of the investigated frequencies. To increase the readability of the fig.1, the data used for the plot have been smoothed over a 600 Hz frequency window. One can note also the high frequency cutoff above 30 kHz which is due to input filters in the experiment.
Every sample exhibits three intrinsic noise contributions : Johnson Nyquist thermal noise, shot noise and low frequency noise. In addition, the major sources of background noise are the circuit resistances and preamplifiers voltage and current noise. These different parasitic contributions have been characterized independently with specific experiments, in particular at 140 mK in order to reduce the thermal noises. For all measurements, the total background noise is dominated by the amplifiers current noise ( at 10 kHz) and it always remains smaller than the noise from the sample itself.
For and beyond the low frequency region, the white noise is identified with Johnson Nyquist noise. Its level was determined after correction for the high frequency cutoff, which is due to knwon filter capacitances. This noise power can be expressed as an equivalent temperature according to . The upper inset of fig.1 shows that is always close to the measured value of T, which provides a basic experimental check.
The quantity we consider from now on is the difference between the noise power spectra obtained with and without DC current bias : . This difference only contains shot noise and low frequency noise. We find that the low frequency noise roughly scales as , which is the basic signature of 1/f noise originating from the a population of active two-level systems in a metallic conductor dutta .
Note that the amplitude of 1/f noise we measure is very small compared to the values already published on carbon nanotubes paalanen ; postma . A possible explanation is the suspended character of our samples in contrast with deposited nanotubes which can interact with residual mobile charges present on any substrate. Following the analysis in postma we characterize the amplitude of 1/f noise by the dimensionless coefficient B defined as . For rope A, we find nearly independent of temperature between 300 K and 1 K. For the highest currents (typically ), an additional low frequency noise appears with a dependence which saturates at very low frequency. This behavior is typical of telegraphic noise which characteristic frequency increases with (see fig. 1) and is similar to previous observations in nanometer scales metallic samples where the resistance noise is dominated by the activity of an individual or a very few number of two-level-systems.ralls . We fit the tail of the low frequency noise by a power law, and the remaining white noise is identified to the shot noise . Above 5-10 , the amplitude of the white noise level is not found to depend on the details of the low frequency fit, at least for arbitrarily chosen between 1 and 2.
We now focus exclusively on this shot noise. In fig. 2, is plotted as a function of for Rope A. As expected we observe a roughly linear dependence. Interestingly, the current noise is strongly reduced (by more than a factor 150) compared to the full shot noise value . For this reason it cannot be detected for currents below . This strong reduction of shot noise is the central result of our paper. Note however that we cannot discriminate in these experiments the intrinsic noise of the tubes from the noise of the contacts. It is thus possible that the intrinsic noise of the nanotubes is even smaller than these measured values.
This small shot noise amplitude decreases systematically as temperature is increased between 1 and 20 K and is not measurable anymore at 77 K just like in a macroscopic resistor. Shot noise is indeed expected to disappear at temperatures for which inelastic electron phonon scattering takes place inside the sample, with scattering lengths much smaller than the sample length. (And indeed the increase of resistance measured above 30 K indicates that e-phonon scattering takes place inside the sample at this temperature).
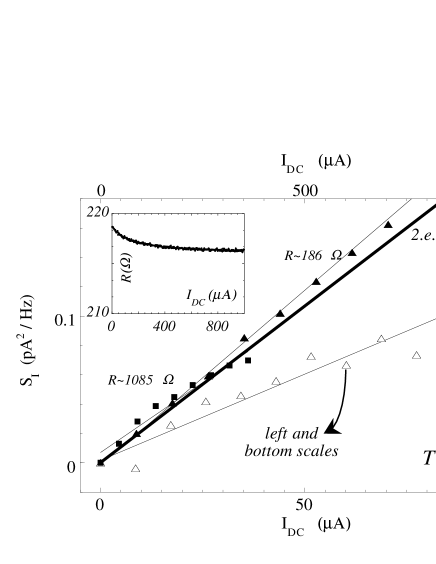
Similar shot noise reductions where also seen (see fig.3) in the less resistive ropes B () and C () where reduction factors are respectively measured to be 270 and 150 at 1K. We have also performed noise measurements on an individual tube at 1 K (fig. 4)which resistance varies between 10.5 and between and . The amplitude of 1/f noise measured in this sample is much higher than in ropes, and presents strong non-linearities with above as shown on fig.5. At current below it can be described by the coefficient which is about smaller than the value recently measured at 8 K in an individual tube 5 times more resistive by Postma et al. postma . The strong difference by more than a factor of the amplitude of 1/f noise between ropes containing 300 tubes and an individual tube may seem surprising. But it can be qualitatively understood considering that transport through a rope essentially probes the most conducting tubes which are also likely to be the less noisy ones. This large amount of 1/f noise in the individual tube sample makes the analysis of the shot noise component more difficult. The data shown in fig. 5 shows that there is barely no detectable shot noise in this sample. We can nevertheless give an upper-bound estimate of the amount of shot noise which are the data points shown.

4 Discussion
We now discuss the possible physical mechanisms which could be at the origin of the strong shot noise reduction.
i) Strong electron phonon scattering in the sample or at the contacts. Electron phonon scattering characterized by a typical scattering length has been shown to induce a shot noise reduction of a factor for a sample of length L much longer than wees88 . However in order to explain the noise reduction factor observed in the present experiments an inelastic length as short as 5 is needed which is quite unphysical at 1 K and at low current. Observation of proximity induced superconductivity in the same type of samples is a confirmation of long inelastic scattering lengths in the tubes and absence of inelastic scattering at the contacts. Of course, this electron phonon scattering is expected to increase at high currents, as has been invoked to explain the strong non-linearities observed in low temperature transport in individual tubes observed above per tube yao . We have checked that non linearities for all measured samples discussed here remain extremely small: less than 1 percent of resistance (see inset of fig. 3) and are opposite in sign compared to what is expected for current-induced electron phonon scattering where R should exhibit an increase with current instead of the small decrease observed here.
ii) Ballistic transport through the tubes in a Landauer type of picture landauer . Assuming that carbon nanotubes in a rope behave as independent 2 channel conductors characterized by their transmissions and , the total conductance of a rope reads :
| (2) |
where is the conductance quantum. The shot noise spectral density through the sample biased with the voltage V in the limit is:
| (3) |
From the dimensionless value of the conductance of Rope A, which varies with between =11.80 and =11.93 it is possible to deduce the configuration of which yields the minimum value of . It is obtained assuming that all tubes except 6 are insulator which means conducting channels for the rope. If 5 tubes are perfectly conducting () and the sixth one is such that: then . We deduce a shot noise reduction factor which yields between and when the resistance varies between 1085 and 1100 i.e. of the order of the observed value (see fig.6). It is interesting to consider also the situation in which all the conducting channels have the same transmission. The maximum noise reduction is obtained again when the number of conducting channels is minimum (). Fig.6 (thick dashed line) shows that reduction factor peaks for integer values of , which correspond again to a full transmission () for all conducting channels.

It is thus in principle nearly possible to explain the low level of shot noise measured in the ropes by considering them as a small number ( channels) of independent quasi ballistic conductors of non interacting electrons. For Rope A, this implies for all channels either a transmission equal to 0 or 1 within (), with the very strong additional constraint that The preliminary results obtained on the individual tube presented in fig.5 also indicate that the level of shot noise is reduced by more than a factor 3 compared to the maximum shot noise reduction obtained assuming that the nanotube consists of 2 independent channels of non interacting electrons. As discussed above the presence of electron-electron interactions can induce a Luttinger liquid state in a 1D system resulting in non-integer charge excitations with where g is the LL parameter estimated to be of the order of 0.3 in carbon nanotubes. Replacing e by e* in (3) could help fit our experimental reduction of shot noise for all the samples. However we want to stress that the assumption we have made, that only a very small number of nearly perfectly ballistic conducting tubes contribute to transport through the ropes, implies that the current per tube in our experiments can exceed per tube within a rope without damaging the sample nor giving rise to observable non-linearities. This is in apparent contradiction with previous experiments both in individual tubes and ropes where non-linearities start to show up at and the maximum current which can be sustained by an individual SWNT is observed to be of the order of yao ; avouris . It is possible that the absence of non-linearities in our samples is due to their suspended character: emitted phonons can not leave the tubes via the substrate and are reabsorbed by other electrons as observed in point contacts kulik which can also sustain very high currents.
Assuming instead that more that channels participate to transport will yield a shot noise reduction factor which decreases very rapidly with . For example, let us assume that conducting channels have the same transmission . Fig.6 (thin lines) shows the noise reduction factor for and . For all ropes, it falls well below the experimental values. For , the effect is much more drastic with a reduction factor approaching 2. Such low reductions cannot explain our results. It therefore seems in this hypothesis that a much smaller effective charge is needed to explain the severe reduction we observe.
It may then be necessary to take into account strong correlations between the current noise in the different tubes constituting the rope or coupling between the two channels within each nanotube. The effect of inter-tubes correlations has been recently discussed theoretically by Trauzettel et al. trauz in a more sophisticated experimental setup where coupled nanotubes can be independently addressed. These authors propose a scenario with a perfect locking of the noise in different tubes. Such positive correlations are expected to increase shot noise. Our experiments indicate instead strong anticorrelations.
Note that strong Coulomb repulsion between electrons in vacuum diodes or triodes have already been shown 60 years ago rack to provide a very efficient mechanism for shot noise reduction. At this stage both more experimental and theoretical work are needed to understand our results.
We have benifited fom a number of fruitful discussions with Y. Blanter, M. Büttiker, K. Imura, P. Lederer, K.V. Pham and F. Piechon. A.K. thanks the Russian foundation for basic research and solid state nanostructures for financial support, and thanks CNRS for a visitor’s position. P.-E. R. is grateful to C. Glattli and B. Douçot for their comments.
References
- (1) M.S. Dresselhaus, G. Dresselhaus, and P.C. Eklund, Science of Fullerenes and Carbon nanotubes (Academic, San Diego, 1996).
- (2) N. Hamada, S. I. Sawada and A. Oshiyama, Phys. Rev. Lett. 68, 1579 (1992).
- (3) C. Kane, L. Balents and M. P. Fisher, Phys. Rev. Lett 79, 5086 (1997).
- (4) R. Egger, A. Gogolin, Phys. Rev. Lett. 79, 5082 (1997) ; R. Egger, Phys. Rev. Lett. 83, 5547 (1999).
- (5) M. Bockrath et al., Nature 397, 598 (1999).
- (6) Ya.M. Blanter and M. Büttiker Physics Reports 3361, (2000).
- (7) C.L. Kane and M.P.A. Fisher, Phys. Rev. Lett.72,724 (1994). K.-V. Pham, M. Gabay and P. Lederer, Phys. Rev. B 61, 16397 (2000).
- (8) R. de Picciotto et al.. Nature 389, 162 (1997); L. Saminadayar, D.C. Glattli,Y. Jin and B. Etienne Phys. Rev. Lett.79,2526 (1997).
- (9) V.V. Ponomarenko and N. Nagaosa, Phys.Rev.B 60,16865 (1999).
- (10) B. Trauzettel, R. Egger and H. Grabert cond-mat/0109022.
- (11) K.I. Imura, K.V. Pham, P. Lederer and F. Piechon cond-mat/0111358 and to be published.
- (12) C. Journet, et al., Nature 388, 756 (1997).
- (13) L. Vaccarini, et al., C.R. Acad. Sci.327, 925 (1999).
- (14) M. Burghard et al., Electronic Properties of Novel Materials (Eds H. Kuzmany et al.,) AIP, New York (1998).
- (15) A.Yu. Kasumov, I.I. Khodos, P.M. Ajayan, C. Colliex, Europhys. Lett. 34, 429 (1996); A.Yu. Kasumov et al., Europhys. Lett. 43, 89 (1998).
- (16) typically a Cr/Au or Pt/Au bilayer.
- (17) A.Yu. Kasumov et al., Science 284, 1508 (1999).
- (18) J.E. Fisher et al.. Phys. Rev. B,55, 4921 (1997).
- (19) P. Dutta and P.M. Horn, Rev. Mod. Phys. 53,497 (1981).
- (20) K. Ralls and R. Burhman, Phys. Rev. Lett. 60,2434 (1988).
- (21) P.G. Collins et. al. Appl.Phys.Lett. 76, 89 4 (2000),L. Roschier et al.. Appl. Phys. Lett. 78, 3295 (2001).
- (22) H.W. Postma et al.. to appear in Moriond 2001 proceedings.
- (23) Z. Yao, C.L. Kane, C. Decker Phys. Rev. Lett. 84, 2941 (2000).
- (24) B.J. Van Wees et al.. Phys. Rev. Lett.60,848 (1988).
- (25) R. Landauer and Th. Martin Physica B 175,167(1991).
- (26) P. Collins et al.. Science 292,706 (2001).
- (27) O.P. Balakahin and I.I. Kulik, Physica B 218, 50 (1996).
- (28) A.W. Hull and N.H. Williams, Phys. Rev. 25, 147 (1925); A. J. Rack, Bell Syst. Tech. J. 17, 592 (1938);D. O. North, RCA Rev.4, 441 (1940)