Anisotropic, Fermi-Surface-Induced Variation in in Alloys
Abstract
Using coherent-potential to describe disorder, Gaspari-Gyorffy approach to evaluate electron-phonon coupling, and Allen-Dynes equation to calculate , we show that in ( or ) alloys (i) the way changes depends on the location of the added/modified k-resolved states on the Fermi surface and (ii) the variation of as a function of concentration is dictated by the DOS. In addition, using full-potential calculations for , we show that (i) at a superstructure can form in but not in or , and (ii) layer shifts towards the impurity layer, more for than for or .
pacs:
PACS numbers: 74.25.Jb, 74.70.AdSince the discovery of superconductivity in [1] the experimental [1, 2, 3, 4, 5, 6] and theoretical [7, 8, 9, 10, 11, 12, 13, 14, 15, 16] efforts have greatly improved our understanding of the nature of interaction responsible for superconductivity (SC) in It has become clear that almost all facets of the phonon-mediated electron-electron interaction have a dramatic influence over the superconducting behavior of For example, the electron-phonon matrix elements change considerably as one moves away from the cylindrical Fermi sheets along to [9, 16], anharmonic effects [6, 15] have to be included in the dynamical matrix [16], and finally k-dependent fully anisotropic Eliashberg equations have to be solved [16] for a complete and accurate description of the superconducting properties of Such a strong dependence of the superconducting properties of on different aspects of the interaction has opened up the possibility of dramatically modifying its superconducting behavior by changing the interaction in various ways and thereby learning more about the interaction itself. Alloying with various elements and then studying their SC properties offers such an opportunity.
There have been several studies of changes in the SC properties of upon substitutions of various elements such as and others [5, 17, 18, 19, 20]. The main effects of alloying are seen to be (i) a decrease in transition temperature, , with increasing concentration of the alloying elements although the rate at which the changes depends on the element being substituted, (ii) a slight increase in the in case of [19, 20] substitution while for and the remains essentially the same, (iii) persistence of superconductivity up to in [5, 17], (iv) a change in crystal structure and the formation of a superstructure at in [17], and (v) a change in the lattice parameters and
In an effort to understand the changes in the electronic structure and the superconducting properties of alloys, we have carried out ab initio studies of and alloys. We have used Korringa-Kohn-Rostoker coherent-potential approximation [21, 22] in the atomic-sphere approximation (KKR-ASA CPA) method for taking into account the effects of disorder, Gaspari-Gyorffy formalism [23] for calculating the electron-phonon coupling constant , and Allen-Dynes equation [24] for calculating in and alloys as a function of and concentrations, respectively. We have analyzed our results in terms of the changes in the spectral function [22] along to evaluated at the Fermi energy, , and the total density of states (DOS), in particular the changes in the contribution to the total DOS, as a function of concentration .
For examining the possibility of superstructure formation at we have used ABINIT code [25], based on psuedopotentials and plane waves to optimize the cell parameters and as well as relax the cell-internal atomic positions of and in structures. We have used these atomic positions to carry out a total energy comparison using KKR-ASA CPA between the ordered and the substitutionally disordered and alloys at . Such an approach allows us to check the possibility of formation of a layered or a mixed superstructure at in these alloys. Before we describe our results, we outline some of the computational details.
The charge self-consistent electronic structure of and alloys as a function of has been calculated using the KKR-ASA CPA method. We have used the CPA rather than a rigid-band model because CPA has been found to reliably describe the effects of disorder in metallic alloys [21, 22]. We parametrized the exchange-correlation potential as suggested by Perdew-Wang [26] within the generalized gradient approximation. The Brillouin zone (BZ) integration was carried out using points in the irreducible part of the BZ. For DOS and spectral function calculations, we added a small imaginary component of and , respectively, to the energy and used k-points in the irreducible part of the BZ. The lattice constants for and alloys as a function of were taken from experiments [17, 18, 19]. The Wigner- Seitz radii for , and were slightly larger than that of . The sphere overlap which is crucial in ASA, was less than % and the maximum used was = .
The electron-phonon coupling constant was calculated using Gaspari-Gyorffy [23] formalism with the charge self-consistent potentials of and obtained with the KKR-ASA CPA method. Subsequently, the variation of as a function of , and concentrations was calculated using Allen-Dynes equation [24]. The average values of phonon frequencies for and were taken from Refs. [9, 10] respectively. For intermediate concentrations, we took to be the concentration-weighted average of and . For and we used the same value of as that for .
The structural relaxation of and was carried out by the molecular dynamics program ABINIT with Broyden-Fletcher-Goldfarb-Shanno minimization technique [25] using Troullier-Martins psuedopotentials [27], 512 Monkhorst-Pack [28] k-points and Teter parameterization [25] for exchange-correlation. The kinetic energy cutoff for the plane waves was 110 Ry.
Based on our calculations, described below, we find that in and alloys (i) the way changes depends on the location of the added/modified k-resolved states on the Fermi surface, (ii) the variation of as a function of concentration is dictated by the contribution to the total DOS, (iii) at a superstructure can form in but not in or , and (iv) layer shifts towards the impurity layer, more for than for or
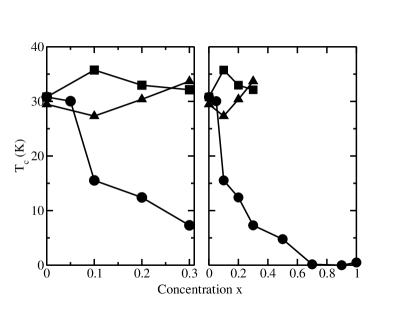
The main results of our calculations are shown in Fig. 1, where we have plotted the variation in of and alloys as a function of concentration . The calculations were carried out as described earlier with the same value of for all the concentrations. The for is equal to which is consistent with the results of other works [7, 9, 10] with similar approximations. The corresponding is equal to For , the increases slightly for and , while it decreases substantially for as is found experimentally [5, 17]. Note that for our calculation shows to have a higher than that of by about [18, 19, 20]. In Fig.1 (right panel) we have shown the variation in in alloys as a function of concentration for As a function of concentration, the decrease rapidly from at to about at The decreases slowly between and At the vanishes and remains essentially zero thereafter. The calculated variation in , as shown in Fig. 1, is in very good qualitative agreement with the experiments [5].
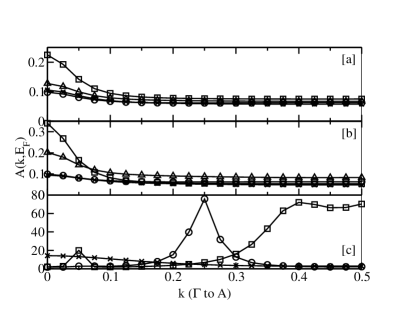
In order to understand the variation of in and alloys as a function of concentration , we have analyzed our results in terms of the spectral functions, the contribution of Boron -electrons to the total DOS and the total DOS. In Fig. 2(a)-(c), we show the spectral functions along to direction evaluated at in and alloys for (Fig. 2(a)), (Fig.2(b)), and (Fig. 2(c)). From Figs. 2(a)-(b) it is clear that the substitution of in leads to creation of more new states along to direction than the substitution of or Since the hole-like cylindrical Fermi sheet along to contributes much more to the electron-phonon coupling [16], the creation of new electron states along to direction weakens considerably the overall coupling constant which, in turn, reduces the more in than in either or . Thus, in our opinion, the way changes in upon alloying depends dramatically on the location of the added/modified k-resolved states on the Fermi surface.
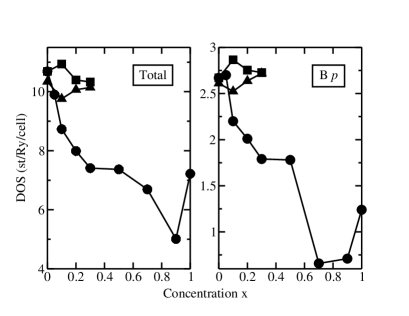
Having explained the differences in behavior of upon alloying with and we now try to understand the changes in their properties as a function of concentration In Fig. 3(a)-(b) we have shown the total DOS at (Fig. 3(a)) and the contribution to the total DOS at (Fig. 3(b)) in and alloys as a function of concentration We find that as a function of concentration, the variation in , as shown in Fig.1, follows closely the behavior of the total DOS at and in particular the variation in contribution to the total DOS at . It is also not surprising to see that the vanishing of superconductivity in at coincides with a very small contribution to the total DOS.
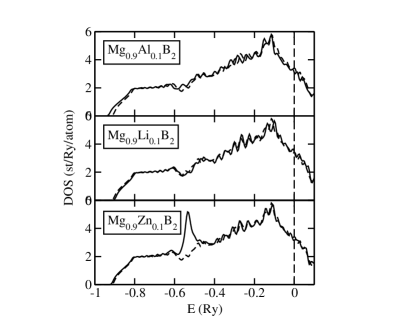
In Fig. 4(a)-(c) we show the total DOS of , and alloys, respectively, at In the same plot we also show the total DOS of obtained using the same approach. The overall downward (upward) movement of the total DOS in () with respect to that of is due to the addition (removal) of electrons. In Fig. 4(c), the peak in the total DOS at around below is due to the states of
Finally, we discuss the possibility of superstructure formation at . In Table I we show the optimized cell parameters as well as the cell-internal relaxations for and calculated using the ABINIT program. We find that the Boron layer shifts significantly more towards layer in than towards either or layer in or , respectively. The shift of layer by towards layer in compares well with the corresponding shift obtained in Ref. [29]. However, the shift of layer towards and layers in and respectively implies that it is not simply due to the extra positive charge on the impurity layer, as suggested in Ref. [29] in the case of In Table I we have also listed the calculated ordering energy, which is the difference between the total energies of the ordered , and and the corresponding disordered and alloys, obtained using KKR-ASA CPA method. It clearly shows the possibility of formation of a superstructure in because the fully-relaxed is lower in energy by in comparison to the disordered However, within the limitations of our approach, we find that and are unlikely to form superstructures since is positive in these two cases. Our results also show that a structure made up of layers consisting of a random mixing of and atoms and described by CPA, is higher in energy than a structure made up of alternate layers of and atoms [29].
| Alloy | ||||
|---|---|---|---|---|
| 5.799 | 2.242 | 0.24 | -12.1 | |
| 5.685 | 2.287 | 0.04 | +4.8 | |
| 5.789 | 2.254 | 0.08 | +1.2 |
In conclusion, we have shown that in and alloys (i) the way changes depends on the location of the added/modified k-resolved states on the Fermi surface, (ii) the variation of as a function of concentration is dictated by the contribution to the total DOS at , (iii) at a superstructure can form in but not in or , and (iv) layer shifts towards the impurity layer, more for than for or
REFERENCES
- [1] J. Nagamatsu et al., Nature, 410, 63 (2001).
- [2] S. L. Bud’ko et al., Phys. Rev. Lett. 86, 1877 (2001).
- [3] D. G. Hinks et al., Nature 411, 457 (2001).
- [4] T. Takahashi et al., Phys. Rev. Lett. 86, 4915 (2001).
- [5] Cristina Buzea and Tsutomu Yamashita, cond-mat/ 0108265; and references therein.
- [6] T. Yildirim et al., Phys. Rev. Lett. 86, 5771 (2001).
- [7] J. Kortus et al., Phys. Rev. Lett. 86, 4656 (2001).
- [8] M. An and W. E. Pickett, Phys. Rev. Lett. 86, 4366 (2001).
- [9] Y. Kong et al., Phys. Rev. B 64, 020501 (2001).
- [10] K.-P. Bohnen et al., Phys. Rev. Lett. 86, 5771 (2001).
- [11] Prabhakar P. Singh Phys. Rev. Lett. 87, 087004 (2001).
- [12] N. I. Medvedeva et al., Phys. Rev. B 64, 020502 (2001).
- [13] G. Satta et al., Phys. Rev. B 64, 104507 (2001).
- [14] K. D. Belaschenko et al., Phys. Rev. B 64, 092503 (2001).
- [15] A. Liu et al., Phys. Rev. Lett. 87, 87005 (2001).
- [16] H. J. Choi et al., cond-mat/0111182 and cond-mat/0111183 (2001).
- [17] J. Y. Xiang et al., cond-mat/0104366 (2001).
- [18] Y. G. Zhang et al., Phys. C 361, 91 (2001).
- [19] S. M. Kazakov et al., cond-mat/0103350 (2001).
- [20] Y. Moritomo et al., cond-mat/0104568 (2001).
- [21] Prabhakar P. Singh and A. Gonis, Phys. Rev. B 49, 1642 (1994).
- [22] J. S. Faulkner, Prog. Mat. Sci 27, 1 (1982); and references therein.
- [23] G. D. Gaspari and B. L. Gyorffy, Phys. Rev. Lett. 28, 801 (1972).
- [24] P. B. Allen and R. C. Dynes, Phys. Rev. B 12, 905 (1975).
- [25] See URL http://www.pcpm.ucl.ac.be/abinit.
- [26] J. P. Perdew and Y. Wang, Phys. Rev. B 45, 13244 (1992); J. Perdew et al., Phys. Rev. Lett. 77, 3865 (1996).
- [27] N. Troullier and J. L. Martins, Phys. Rev. B 43, 1993 (1991).
- [28] H. J. Monkhorst and J. D. Pack, Phys. Rev. B 13, 5188 (1976).
- [29] S. V. Barabash et al., cond-mat/0111392 (2001).