Temperature-dependent anisotropy in MgB2 as inferred from measurements on polycrystals
Abstract
We present data on temperature-dependent anisotropy of the upper
critical field of MgB2 obtained from the analysis
of measurements on high purity, low resistivity polycrystals.
The anisotropy
decreases in a monotonic fashion with increase of temperature.
pacs:
74.70.Ad, 74.60.EcThe recent discovery [1] of superconductivity with a high critical temperature, K, in the simple, binary intermetallic compound MgB2 evoked intense experimental and theoretical studies of the physical properties of this material that resulted in understanding of superconductivity in this material as being of the BCS type superconductor in which the observed value of is a result of the anisotropy of the electron-phonon coupling and anharmonicity in the relevant (boron ) phonon modes. [2, 3, 4]
One of the imporant superconducting properties of MgB2 is the anisotropy of its upper critical field. Reported values of span between [5] and . [6] These values were obtained on MgB2 in different forms and sample quality. For sub- single crystallites of magnesium diboride the anisotropy was communicated to be in the range of . [7, 8, 9, 10] Recently the anisotropy of the upper critical field of single crystallites of MgB2 was studied using torque magnetometry [11] and it was found to be temperature (and applied field) dependent, changing monotonically from at 35 K to at 15 K. It has to be mentioned that while these results [11] have an advantage of being obtained by direct measurements on small single crystals, the state-of-the-art single crystals [7, 8, 9, 10, 11, 12] have their lower ( K) than that of good polycrystalline samples [13, 14, 15] and also have rather moderate vales of residual resistivity ratio: 5-7 for crystallites as opposed to 20 for high purity polycrystalline samples.
Temperature-dependent implies a breakdown of the standard anisotropic Ginzburg-Landau theory with a temperature and field independent effective mass anisotropy. Temperature-dependent anisotropy of , , has been observed in a number of materials [16, 17, 18, 19, 20] and was found to depend on the form and purity of the material. Since establishing the intrinsic anisotropy of the upper critical field for MgB2 and its temperature dependence is of importance for understanding of the properties of this material, we will present an alternate evaluation of the behavior in a wide temperature range ( K) for samples with optimal K and high residual resistivity ratio (). The drawback of the approach is that the results are inferred from analysis of the measurements on polycrystalline material, however this analysis is robust enough to reflect the intrinsic anisotropic properties. In a recent communication [21] we presented anisotropic data for K and extracted a value of (25 K) 6. In this report we extend these data so as to determine the full plot.
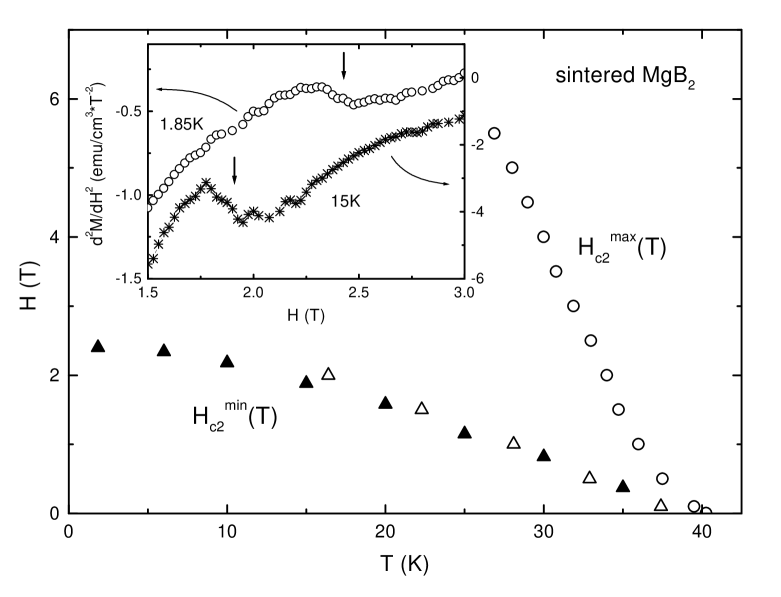
Anisotropic and data for K obtained from the analysis of the temperature-dependent magnetization of randomly (continuously) oriented MgB2 powders are readily available from Ref. [21]. Applying the qualitative arguments used in Ref. [21] for data to magnetization isotherms, , [22] one would expect to detect an anomaly at . As in the case the feature should be present for any continuous (but not necessary random) distribution of grains. Some theoretical discussion, albeit with additional approximations, related to the anomaly in second derivative of was presented more than a decade ago [23] in relation to high temperature copper oxide superconductors. In the case of MgB2 (sintered sample similar to the one used in [[21]]) the anomaly in the second derivative is clearly seen (see inset to Fig. 1). The temperature-dependent data between 1.8 K and 35 K was obtained by monitoring this feature at different temperatures (see Fig. 1). The results deduced from the magnetization data taken along different lines in the space are consistent.
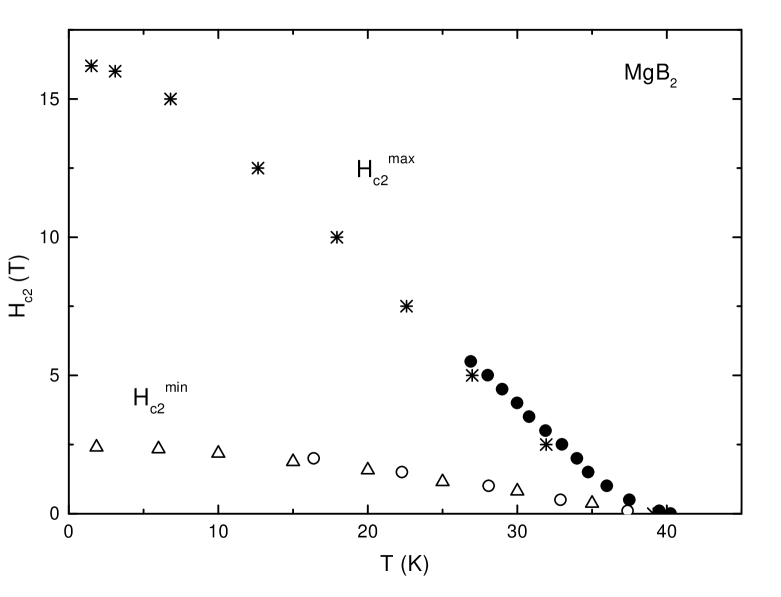
Upon application of all grains in a polycrystalline sample become normal, i.e. coincides with measured on a polycrystal. Since the polycrystalline is very similar for our sintered pellets [24] and wire segments [15, 25], we will use the data for wire segments [25] as an approximation for below 25 K. The data are consistent with the results obtained by analysis of curves [21] in the shared temperature region (above 25 K). The combined phase diagram for a whole temperature range is presented in Fig. 2. The anisotropy of , , is straightforwardly determined from this phase diagram.
Temperature-dependent anisotropy of the upper critical field of
magnesium diboride inferred from the measurements on
polycrystalline samples
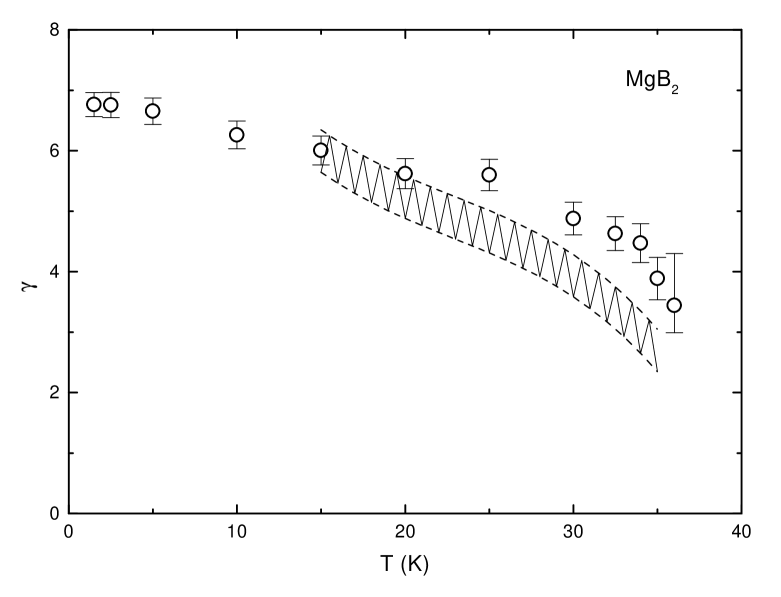
is shown in Fig. 3 together with the data from Ref.
[11].
Our data show a similar, but somewhat less pronounced, temperature
dependence of the anisotropy: changes from 3.5 to 7 with
decrease of the temperature from 36 K down to 1.8 K.
The fact that the two sets of data are qualitatively similar probably points
to the intrinsic character of the observed temperature dependence of
.
In conclusion, anisotropy of the upper critical field of high purity,
high
( K) and high ()
MgB2 samples is
temperature dependent.
decreases monotonically with increase of temperature
from ( K) to ( K). The data
are qualitatively consistent with the results of the measurements
on sub- single crystals. [11]
We would like to thank V. G. Kogan for useful discussions. Ames Laboratory is operated for the U. S. Department of Energy by Iowa State University under contract No. W-7405-ENG-82. This work was supported by the Director of Energy Research, Office of Basic Energy Sciences.
REFERENCES
- [1] J. Akimiitsu, Symposium on Transition Metal Oxides, Sendai, January 10, 2001; J. Nagamatsu, N. Nakagawa, T. Muranaka, Y. Zenitani, and J. Akimitsu, Nature 410, 63 (2001).
- [2] T. Yildirim, O. Gülseren, J. W. Lynn, C. M. Brown, T. J. Udovic, Q. Huang, N. Rogado, K. A. Regan, M. A. Hayward, J. S. Slusky, T. He, M. K. Haas, P. Khalifah, K. Inumaru, and R. J. Cava, Phys. Rev. Lett. 87, 037001 (2001).
- [3] H. J. Choi, D. Roundy, H. Sun, M. L. Cohen, and S. G. Louie, cond-mat/0111182 (unpublished).
- [4] H. J. Choi, D. Roundy, H. Sun, M. L. Cohen, and S. G. Louie, cond-mat/0111183 (unpublished).
- [5] X. H. Chen, Y. Y. Xue, R. L. Meng, and C. W. Chu, Phys. Rev. B 64, 172501 (2001).
- [6] S. R. Shinde, S. B. Ogale, A. Biswas, R. L. Greene, and T. Venkatesan, cond-mat/0110541 (unpublished).
- [7] K. H. P. Kim, J - H. Choi, C. U. Jung, P. Chowdhury, M - S. Park, H - J. Kim, J. Y. Kim, Z. Du, M - S. Kim, W. N. Kang, S - I. Lee, G. Y. Sung, and J. Y. Lee, cond-mat/0105330 (unpublished).
- [8] M. Xu, H. Kitazawa, Y. Takano, J. Ye, K. Nishida, H. Abe, A. Matsushita, and G. Kido, Appl. Phys. Lett. 79, 2779 (2001).
- [9] S. Lee, H. Mori, T. Masui, Yu. Eltsev, A. Yamamoto, and S. Tajima, J. Phys. Soc. Jpn. 70, 2255 (2001).
- [10] A. K. Pradhan, Z. X. Shi, M. Tokunaga, T. Tamegai, Y. Takano, K. Togano, H. Kito, and H. Ihara, Phys. Rev. B 64, 212509 (2001).
- [11] M. Angst, R. Puzniak, A. Wisniewski, J. Jun, S. M. Kazakov, J. Karpinski, J. Roos, and H. Keller, cond-mat/0112166 (unpublished).
- [12] A. V. Sologubenko, J. Jun, S. M. Kazakov, J. Karpinski, and H. R. Ott, cond-mat/0112191 (unpublished).
- [13] S. L. Bud’ko, G. Lapertot, C. Petrovic, C. E. Cunningham, N. Anderson, and P. C. Canfield, Phys. Rev. Lett. 86, 1877 (2001).
- [14] D. G. Hinks, H. Claus, and J. D. Jorgensen, Nature 411, 457 (2001).
- [15] P. C. Canfield, D. K. Finnemore, S. L. Bud’ko, J. E. Ostenson, G. Lapertot, C. E. Cunningham, and C. Petrovic, Phys. Rev. Lett. 86, 2423 (2001).
- [16] D. E. Farrell, B. S. Chandrasekhar, and S. Huang, Phys. Rev. 176, 562 (1968).
- [17] S. J. Williamson, Phys. Rev. B 2, 3545 (1970).
- [18] Y. Muto, K. Noto, H. Nakatsuji, and N. Toyota, Nuovo Cimento B 38, 503 (1977).
- [19] C. Uher, J. L. Cohn, and I. K. Schuller, Phys. Rev. B 34, 4906 (1986).
- [20] V. Metlushko, U. Welp, A. Koshelev, I. Aranson, G. W. Crabtree, and P. C. Canfield, Phys. Rev. Lett. 79, 1738 (1997).
- [21] S. L. Bud’ko, V. G. Kogan, and P. C. Canfield, Phys. Rev. B 64, 180506 (2001).
- [22] S. L. Bud’ko, P. C. Canfield, and V. G. Kogan, Proc. ICMC/CEC 2001, (Madison, July 2001), in press.
- [23] L. I. Glazman, A. E. Koshelev, and A. G. Lebed’, Zh. Exper. Teor. Fiz. 94, 259 (1988) [Sov. Phys. JETP, 67, 1235 (1988)].
- [24] D. K. Finnemore, J. E. Ostenson, S. L. Bud’ko, G. Lapertot, and P. C. Canfield, Phys. Rev. Lett. 86, 2420 (2001).
- [25] S. L. Bud’ko, C. Petrovic, G. Lapertot, C. E. Cunningham, P. C. Canfield, M-H. Jung, and A. H. Lacerda, Phys. Rev. B 63, 220503 (2001).