[
Inelastic X-ray scattering study of the collective dynamics in liquid sodium.
Abstract
Inelastic X-ray scattering data have been collected for liquid sodium at K, i.e. slightly above the melting point. Owing to the very high instrumental resolution, pushed up to 1.5 meV, it has been possible to determine accurately the dynamic structure factor, , in a wide wavevector range, nm-1, and to investigate on the dynamical processes underlying the collective dynamics. A detailed analysis of the lineshape of , similarly to other liquid metals, reveals the co-existence of two different relaxation processes with slow and fast characteristic timescales respectively. The present data lead to the conclusion that: i) the picture of the relaxation mechanism based on a simple viscoelastic model fails; ii) although the comparison with other liquid metals reveals similar behavior, the data do not exhibit an exact scaling law as the principle of corresponding state would predict.
pacs:
PACS numbers: 67.55.Jd, 67.40.Fd, 61.10.Eq, 63.50.+x]
I INTRODUCTION
Liquid metals are well known to exhibit remarkably pronounced inelastic features (Brillouin peaks) in their density fluctuations spectra up to very high values (well beyond the hydrodynamic regime). For this main reason, in the last decades, the dynamic structure factor of these systems has been used as a benchmark for the comprehension of the mechanisms underlying the atomic motions at the microscopic level in liquids. In particular, in the special case of alkali metals, collective oscillatory modes persist down to wavelengths of the order of one or two interparticle distances, a feature which makes them ideal candidates to test different models for collective properties at finite wavevectors.
In the last thirty years many experimental investigations have been performed on these systems by means of inelastic neutron scattering (INS), which was, up to a few years ago, the only tool adequate to investigate the dynamic of condensed matter in the mesoscopic wavevector region. Indeed, since the very first inelastic neutron scattering experiments by Copley and Rowe [1] in liquid rubidium, many similar studies have been reported for similar systems: lithium [2], sodium [3], potassium [4], cesium [5] and again rubidium [6]. In the most favorable cases (for example in cesium), important features such as the so called positive dispersion of sound, namely an upwards deviation from the low-, linear dispersion behavior, have been reported. Moreover, a description of the coherent dynamic structure factor has been given in terms of a single relaxation process (viscoelastic model). On the other hand, in some of the above mentioned systems, an accurate investigation of the collective properties is prevented by two drawbacks of INS technique, namely the presence of both coherent and incoherent contribution to the inelastic scattering cross section, and the occurrence of kinematic restrictions which confine the minimum accessible wavevector above a threshold value which is already outside the linear dispersion regime. This is particularly the case of lighter elements such as lithium and sodium.
Despite the lack of experimental information on the collective properties in these systems, significant advances have been done by means of computer simulation techniques, where the afore mentioned restrictions do not apply. Consequently, many numerical studies have been reported aiming at the study of the density fluctuation spectra of liquid metals [7, 8, 9, 10, 11, 12, 13]. Moreover, by these numerical techniques one can access a wider set of correlation functions, while an inelastic scattering experiment basically probes the density autocorrelation function.
On the theoretical side, thanks to development of approaches such as the memory function formalism, the relaxation concept, the kinetic theory, [14, 15, 16, 17, 18, 19, 20, 21, 22, 23, 24] it has been built up a framework able to account for the behavior of the afore mentioned correlation functions. Along this line, a general picture of the dynamics of the density fluctuations in simple liquids gradually emerged. In particular it is now established that the decay of the density autocorrelation function occurs through mechanisms characterized by different time scales. In addition to a first mechanism related to the coupling of the density and the temperature modes (thermal relaxation), one must allow for the dynamical effects of the stress correlation function (viscous relaxation). This latter process is thought to proceed throughout two distinct relaxation channels, active over quite different time scales: a first rapid decay, customarily ascribed to the interaction of each atom and the ”cage” of its neighboring atoms, is followed by a slower process which yields a long lasting tail. This mechanism stems from slow, temperature-dependent rearrangements which eventually, in those systems capable to sustain supercooling, may cause a structural arrest (glass transition). This structural relaxation process has widely been studied within the mode coupling formalism. Recently, in the specific case of liquid alkali metals, remarkable attempts have been made to set up self consistent approaches which include all these mechanisms from the very start [22, 25].
This theoretical framework has been tested on a number of numerical studies (see, for example, [14]). On the experimental side, however, the lineshapes extracted by INS in those systems where one may access a significant () region did not allow to discriminate between different models including all the relevant relaxation processes [5].
Although trough of INS enormous advances in the comprehension of the collective properties of condensed matter have been reported, some basic aspects remain still unsettled. In particular, due to the previously mentioned features of INS, sufficiently accurate measurements of the coherent dynamic structure factor, have hardly been reported, with the result that a quantitative description of the relaxation dynamics in monoatomic fluids was mainly based on simulation data.
Only in the recent past, the development of new synchrotron radiation facilities opened the possibility of using X-rays to measure in the non-hydrodynamic region; in this case the photon speed is obviously much larger than the velocity of the excitations, and no kinematic restriction occurs. Moreover, in a monatomic system, the X-ray scattering cross section is purely coherent, and consequently can be directly associated with the coherent dynamic structure factor [14, 26]. After some early, pioneering data [27], IXS rapidly developed in the last decade, becoming fully operational with the advent of the third generation sources [28, 29]. The applicability of IXS to the study of collective and single particle dynamics of light liquid metals has been then exploited in several works performed at the beamline ID16 of the european synchrotron radiation facility (ESRF) in Grenoble [30, 31, 32], thus showing the complementarity of IXS and INS. More recently, IXS has been pushed to the top of its theoretical performance in terms of flux and resolution, and therefore new and more accurate IXS studies on liquid metals allowed to explore the relaxation processes underlying the microscopic dynamics in monoatomic fluids [33, 34, 35]. In particular, it has been possible to detect experimentally and to quantify the presence of the relaxation scenario predicted by the theory of simple liquids. In detail, the data have been analyzed within a generalized hydrodynamic approach [14, 15] and, following a memory function formalism [16] in the mesoscopic wavevector region, it has been possible to detect the presence of two viscous relaxation processes in addition to the thermal process [34]. These results, obtained with a phenomenological ansatz for the memory function originally proposed in a theoretical work by Levesque et al. [17], has then been deeply discussed in order to clarify the physical origin of all these dynamical processes [33].
In this work, we report the results of a very high resolution determination of the dynamic structure factor in liquid sodium at the melting point at several fixed values. Several approximation are adopted for the analysis of the experimental data, and the number and the role of the involved relaxation processes is discussed in detail. Finally, a comparison with similar experimental data on different liquid metals is presented.
II The Experiment
In liquid sodium, the coherent and incoherent INS cross sections are almost equivalent, and the adiabatic speed of sound is about 2500 m/s. As a result, a study of the collective properties in the Q-region characterized by a linear dispersion (the first Brillouin pseudo-zone) is quite hard to perform [3]. The use of IXS to these systems is, therefore, particularly advantageous and, as shown in ref. [32], the inelastic features of the dynamic structure factor can easily be detected even around the Q position of the first sharp diffraction peak ( nm-1).
Data have been collected for liquid sodium at the new IXS beamline ID28 of ESRF (which is now fully operative), allowing an energy resolution of meV FWHM. The experiment has been performed at fixed exchanged wavevector over a region nm-1. Each energy scan ( meV) took about 300 minutes, and has been repeated for a total integration time of about 500 seconds/point. A five analyzers bench, operating in horizontal scattering geometry, allowed us to collect simultaneously photons at five different values of exchanged wavevector for each single scan. As sample environment we used a setup similar to the one adopted in previous experiments performed on liquid lithium [31], namely an austenitic steel cell heated by thermal contact with a resistor connected to a voltage regulated supply. The sample length has been optimized by matching the absorption length of sodium at the working energy 21747 eV (corresponding to the Si (11 11 11) reflection in backscattering geometry) which is about 5 mm.
In Fig. 1, a selection of experimental spectra is reported. Since the incident flux on the sample varies with time, data have been normalized to the monitor. Moreover, since the five analyzers have different scattering efficiencies, to extract from the raw spectra the data have been put in absolute units using the knowledge of the lower order frequency momenta of the dynamic structure factor:
| (1) | |||
| (2) |
where the tilde indicates the true quantum dynamic structure factor, to distinguish it from its classical representation.
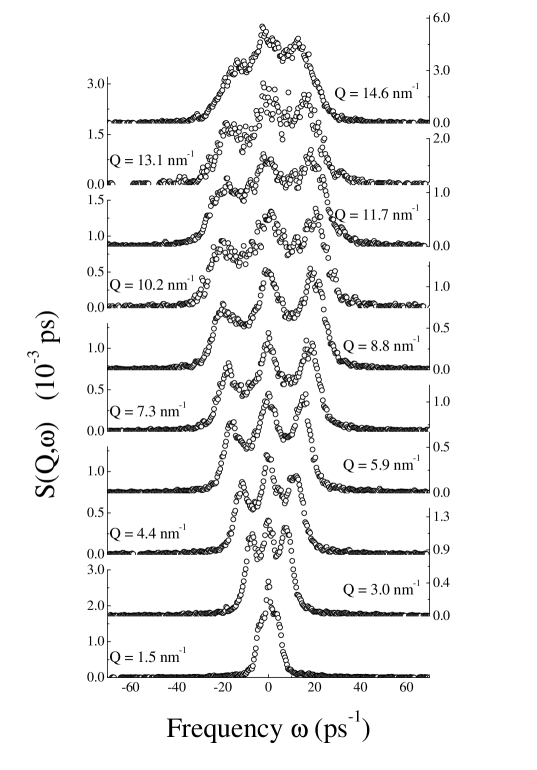
This procedure can be summarized as follows. The actual experimental spectrum is proportional to the convolution of the scattering law with the resolution :
| (3) |
In terms of the first two spectral moments of and : , , , , one easily deduces that
| (4) |
Consequently, the normalized spectrum (still affected by the resolution broadening) reads:
| (5) |
The reliability of this procedure will be discussed in the next section.
III Data Analysis
The data analysis has been performed following a memory function approach, similar to the one adopted for lithium and aluminum data [33, 34, 35].
Within the generalized Langevin equation formalism, it is possible to express the classical dynamic structure factor in terms of a complex function, , (memory function) related to the interaction details. In particular, can be expressed in terms of the real and imaginary part of , the Fourier-Laplace transform of as [14]:
| (6) |
where the quantity is related to the generalized isothermal sound speed through the relation .
In order to use the above expression to reproduce the experimental spectra, , it has to be modified to be quantum-compliant with the detailed balance condition, and finally must be convoluted with the instrumental resolution . Utilizing one of the most common quantum transformation, one finds that
| (7) |
The above expression can finally be used as a fitting function to the experimental data to obtain the relevant relaxation parameters, i.e. relaxation times and strengths. In this procedure, the values of are extracted from the experimental data exploiting Eq. (4).
As memory function, , we utilized a multiple exponential ansatz. In Ref. [34], indeed, it has been shown that in a similar system, namely liquid lithium: i) at least three distinct relaxation processes (one thermal and two viscous) are necessary to reproduce the IXS lineshape; and ii) a multi-exponential shape is an acceptable approximation of the actual memory function. Consequently, the total memory function reads
| (8) | |||||
| (9) |
The first term of the above equation comes from the coupling between thermal and density degrees of freedom, and depends on the thermal conductivity and the specific heat ratio . The remaining two contributions in Eq. (8) are the genuine viscous processes. Through the fitting procedure, the unknown parameters (the relaxation times), (the relative weight of the viscous processes), and (the total viscous strength), can be deduced.
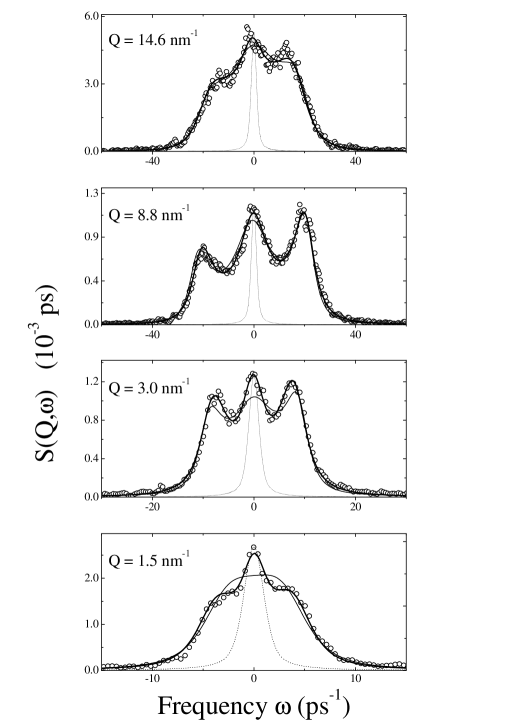
In Fig. 2, we report the outcome of this fitting procedure, i.e. a comparison between and . Both the results of a one and a two time ansatz are shown. As in the case of lithium and aluminum, a single relaxation time description (viscoelastic model) appears to yield a rather poor reproduction of the data. In particular, at low ’s the simultaneous presence of two processes is crucial even to catch just the qualitative features of the spectra.
As previously mentioned, once that the experimental values of are introduced in Eq. (6), the only free fitting parameters are the relaxation times and strength. A consistency check has however been obtained comparing these values of (sum rules) with the one calculated from left as free parameter in Eq. (6).
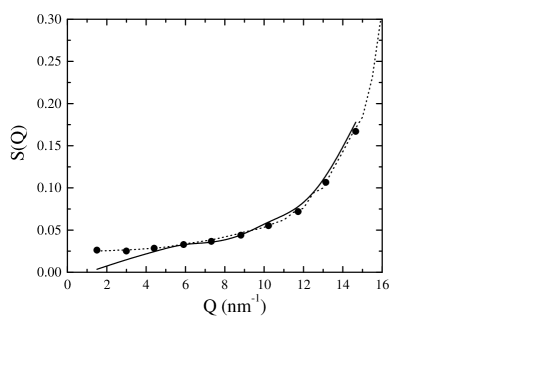

In Fig. 3 the results are shown, together with the experimental determination of from neutron diffraction data [36].
In Fig. 4 we show the two relaxation times, and as obtained by the fitting procedure. The slower process is almost constant, with an abrupt increase below nm-1. Such an increase is probably an artifact, since it occurs as the timescale approaches the inverse of the resolution width, here reported as a dashed line. Consequently the determination of the relaxation time below this value is no longer reliable. The relaxation process shows instead a slightly decreasing dependence. In the insets, we report as function of for the two processes, where omega is the dominant frequency of the density fluctuations at a given (i.e. the frequency of the Brillouin component). The quantity gives important indications about the role of the two processes. The faster one, indeed, has values of always smaller than one, so that it is mainly responsible for the acoustic damping (Brillouin linewidth). Moreover, shows an increase in the same wavevector region where the sound dispersion occurs (approximately, up to values of one half of the position of the first sharp diffraction peak), so that an increase of the apparent peak position ruled by the strength of the fast process has to be expected. The is always larger than one. Consequently the alpha process mainly control the sharper portion of the quasielastic scattering, while it only gives a moderate contribution to the speed of sound over all the explored range (the strength of the process is negligible with respect to that of the fast relaxation).

The above mentioned increase of the speed of sound is illustrated in Fig. 5, where , the maximum of the longitudinal current correlation spectrum is reported in the main frame, and the associated sound speed is reported in the inset. The positive dispersion turns out to be of the order of , similarly to what is found in other liquid metals [14]. In contrast with the results reported in Ref.[32], we find that the isothermal value of the sound speed is not yet reached at the minimum wavevector probed in our experiment, i.e. 1.5 nm-1. At this low resolution effects are particularly important: even with the present resolution (1.5 meV FWHM) the Brillouin components of the appear as shoulders of the quasielastic signal, therefore we believe that this discrepancy may be ascribed to the lower resolutions of the previous experiment that prevents an accurate determination of the actual lineshape at such small value. Both the isothermal (low frequency) [37] and the infinite frequency values of the sound speed have been reported as obtained by the fit. This latter quantity is always higher than the maximum value reached by the apparent sound speed, consistently with the behavior of the relaxation times: as shown in Fig.4, the faster process (which is the one with the dominant strength) has a relaxation time which never exceeds the dominant timescale of the density fluctuation at the probed wavevector. This notwithstanding, the actual values of reported in Fig. 5 can partially be affected by the oversimplifications given by the assumption of exponential lineshape for the memory functions [33].
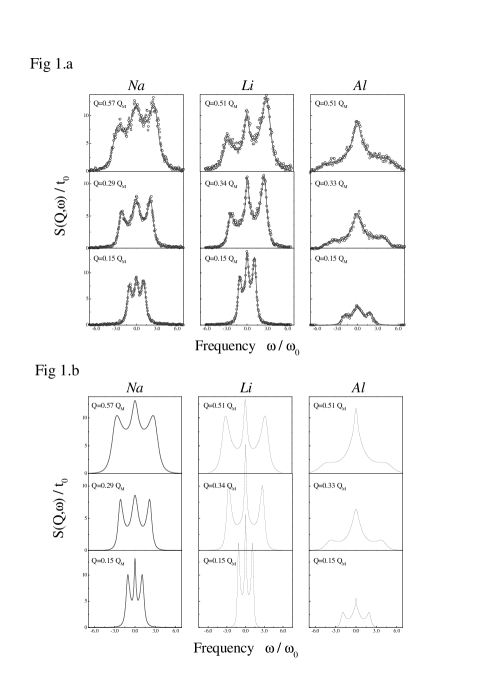
We conclude this investigation with the comparison of the of three different liquid metals. In Fig. 6 the IXS data on liquid sodium are compared with those of lithium and aluminium by introducing a set of length, mass and time units for each system. Such a procedure can be considered meaningful as far as is valid a corresponding state principle. As length unit, , we have chosen , the inverse of the position of the static structure factor S(Q). The time unit, , has been instead chosen as , with the melting temperature and the atomic mass. In the upper panel the raw IXS signal, scaled on this units is reported. The values have been selected among the available ones as closer as possible for three different regions of the dispersion curve. It is worth to point out that all the spectra are resolution broadened and, moreover, that the three experiments have been performed in different condition of resolutions. To bypass the instrumental resolution bias, one can compare the lineshape obtained by the fits, i.e. the classical deconvoluted dynamical structure factor that better reproduces the experimental data after the transformation of Eq. (7). The result of such a comparison is reported in the lower panel of Fig. 6. The aluminum spectra clearly have a different lineshape, while lithium and sodium are much more similar when scaled in their respective absolute units. This notwithstanding, the lineshapes of the two alkali systems do not coincide, implying that the principle of corresponding state is not entirely valid for these systems. One comes to the same conclusion even looking at some basic quantities such as the sound speed: the scaling factors between lithium and sodium, for example, are not the same if one looks at or . Also the static structure factor , rather of being universal quantity, depends on the considered system.
IV CONCLUSIONS
In conclusion, we presented a very high resolution experimental study of the collective dynamic structure factor in liquid sodium at the melting temperature. In order to account for all the spectral details, beside the usual thermal process coupling temperature and density, at least two additional viscous relaxation processes have to be invoked. The viscoelastic approximation do not give, indeed, a satisfactory description of our data. These results have finally been compared with those obtained in other liquid metals. Although the mechanisms ruling the dynamics turn out to lie in a general framework characterizing both alkali and non-alkali simple liquids, some important quantitative differences are found: in particular, a scaling law among alkali systems seems to be unapplicable, in contrast to some previous findings obtained by computer simulation data.
V ACKNOWLEDGEMENTS
We are thankful to the ESRF staff for the great experimental conditions and for the assistance during the experiment. One of the authors (T.S.) acknowledges R. Yulmetyev and M. Silbert for stimulating discussions.
REFERENCES
- [1] J. R. D. Copley and M. Rowe, Phys. Rev. A, 9, 1656 (1974).
- [2] P. Verkerk, P. H. K. De Jong, M. Arai, S. M. Bennington, W. S. Howells and A. D. Taylor, Physica B 180 & 181, 834 (1992); P. H. K. De Jong, Ph. D. Thesis, Technische Universiteit Delft, Netherlands, 1993.
- [3] P. D. Randolph, Phys. Lett. 3, 162 (1963); C. Morkel and W. Glaser, Phys. Rev. A 33, 3383 (1986); A. Stangl, C. Morkel, U. Balucani and A. Torcini, J. Non-Cryst. Solids 205-207, 402 (1996).
- [4] A. G. Novikov, V. V. Savostin, A. L. Shimkevich and R. M. Yulmetyev, Physica B 228, 312 (1996).
- [5] T. Bodensteiner, Chr. Morkel, W. Gläser and B. Dorner, Phys. Rev. A, 45, 5709 (1992).
- [6] P. Chieux, J. Dupuy-Philon, J. F. Jal and J. B. Suck, J. Non Cryst. Solids 205-207, 370 (1996).
- [7] A. Rahman, Phys. Rev. Lett. 32, 52 (1974).
- [8] A. Torcini, U. Balucani, P. H. K. De Jong and P. Verkerk, Phys. Rev. E 51, 3126 (1995).
- [9] U. Balucani, A. Torcini and R. Vallauri, Phys. Rev. A 46, 2159 (1992) and Phys. Rev. B 47, 3011 (1993).
- [10] S. Kambayashi and G. Kahl, Phys. Rev. A 46, 3255 (1992).
- [11] M. Canales, L. E. Gonzalez and J. A. Padrò, Phys. Rev. E 50,3656 (1994).
- [12] F. Shimojo, K. Hoshino, M. Watabe, J. Phys. Soc. Japan 63, 141 (1994).
- [13] M. Foley, E. Smargiassi, P.A. Madden, J. Phys.: Condens. Matter 6, 5231 (1994).
- [14] U. Balucani, M. Zoppi ”Dynamics of the liquid state”, Clarendon Press, Oxford, (1983).
- [15] J. P. Boon and S. Yip, ”Molecular Hydrodynamics” (McGraw-Hill, NewYork, 1980).
- [16] H. Mori, Prog. Theor. Phys., 33, 423, (1965).
- [17] D. Levesque, J. Verlet and J. Kurkijarvi, Phys. Rev. A 7, 1690, (1973).
- [18] W. Gotze and M. Lucke, Phys. Rev. A 11, 2173 (1975).
- [19] L. Sjogren, Phys. Rev. A 22, 2866 and 2883 (1980).
- [20] I. M. de Schepper and E. G. D. Cohen, J. Stat. Phys. 27, 223 (1982).
- [21] U. Bengtzelius, W. Gotze and A. Sjolander, J. Phys. C 84, 1744 (1986).
- [22] J. Casas, D. J. Gonzalez and L. E. Gonzalez, Phys. Rev. B 60, 10094 (1999).
- [23] K. N. Pathak, S. Ranganathan, R. E. Johnson, R. K. Sharma, K. Tankeshwar, Phys. Rev. E 57, 6195-6197 (1998).
- [24] R. M. Yulmetyev, A. V. Mokshin, P. Hanggi and V. Yu. Shurygin, to appear in Phys. Rev. E (2001).
- [25] J. Casas, D. J. Gonzalez, L. E. Gonzalez and M. Silbert, Jorn. Non Cryst. Solids 250, 102-106 (1999).
- [26] S. W. Lovesey, ”Theory of neutron scattering from condensed matter”, Clarendon Press, Oxford (pag. 120) (1994).
- [27] E. Burkel, 1991, ”Inelastic Scattering of X-rays with very high Energy Resolution”, Springer Verlag, Berlin; E. Burkel and H. Sinn, J. Phys. Condens. Matter 6, A225-A228 (1994); E. Burkel and H. Sinn, Int. J. Thermophys. 16, 1135-1142 (1995).
- [28] R. Verbeni, F. Sette, M. Krisch, U.Bergman, B. Gorges, C. Halcoussis, K. Martel, C. Masciovecchio, J. F. Ribois, G. Ruocco and H. Sinn, J. Of Synchrotron Radiation, 3, 62 (1996).
- [29] C. Masciovecchio, U. Bergman, M. Krisch, G. Ruocco, F. Sette and R. Verbeni, Nucl. Inst. and Meth., B-111, 181 and B-117, 339 (1986).
- [30] H. Sinn, F. Sette, U. Bergmann, Ch. Halcousis, M. Krisch, R. Verbeni and E. Burkel, Phys. Rev. Lett. 78, 1715 (1997).
- [31] T. Scopigno, U. Balucani, A. Cunsolo, C. Masciovecchio, G. Ruocco, F. Sette and R. Verbeni, Europhys. Lett. 50, 189 (2000).
- [32] W.C. Pilgrim, S. Hosokawa, H. Saggau, H. Sinn, E. Burkel, J. Non Cryst. Solids 250-252, 96 (1999).
- [33] T. Scopigno, U. Balucani, G. Ruocco and F. Sette, Journal of Physics C 12, 8009 (2000).
- [34] T.Scopigno, U. Balucani, G. Ruocco, F. Sette, Phys. Rev. Lett. 85, 4076 (2000).
- [35] T.Scopigno, U. Balucani, G. Ruocco, F. Sette, Phys. Rev. E 63, 011210 (2001).
- [36] ”Handbook of Thermodynamic and Transport Properties of Alkali Metals”, (Ohse et al., ed.) Blackwell Scientific Publications, pag. 735 (1985), and references therein.
- [37] Due to the high thermal conductivity of liquid metals as compared to that of ordinary fluids, the crossover in the sound speed associated with the thermal relaxation occurs well below 1 nm-1, which is approximately the lower accessible to IXS. Consequently, in the IXS window the low frequency limit of the sound speed is the isothermal rather than the adiabatic sound speed. [33]