Cyclotron resonance in the layered perovskite superconductor Sr2RuO4
Abstract
We report a detailed study of the magnetic-field-orientation dependence of the millimetre-wave magnetoconductivity of the superconductor Sr2RuO4. We find two harmonic series of cyclotron resonances. We assign the first, corresponding to a quasiparticle mass of , where is the free-electron mass, to the Fermi-surface section. We assign the second series, which contains only odd harmonics, to cyclotron resonance of the Fermi-surface section, yielding a quasiparticle mass of . A third, single cyclotron resonance, corresponding to a quasiparticle mass of , is attributed to the Fermi-surface section. In addition, we find a very strong absorption mode in the presence of a magnetic field component parallel to the quasi-two-dimensional planes of the sample. Its dependence on the orientation of the magnetic field cannot be described in the context of conventional cyclotron resonance, and the origin of this mode is not yet clear.
1 Introduction
Great interest surrounded the discovery of superconductivity in Sr2RuO4 in 1994 [1]. The structural similarity of Sr2RuO4 to “high-” cuprate superconductors along with the striking differences in superconducting transition temperature (La2-xBaxCuO4 has K whereas Sr2RuO4 has K) invited comparisons and further investigation [2]. Since then, compelling evidence for the existence of an unconventional spin-triplet superconducting state in Sr2RuO4 has been found [2]. Large quasiparticle mass enhancements [3] suggest that strong electron correlation effects, favoring unconventional superconductivity, are important in Sr2RuO4 [1, 2]. Another key signature of unconventional superconductivity— the strong suppression of by non-magnetic as well as magnetic impurities— is also found [4], and Josephson junction experiments point to non s-wave pairing [5]. Nuclear magnetic resonance (NMR) and nuclear quadrupole resonance (NQR) experiments show behaviour which cannot be explained by the s-wave model [6]: the relaxation rate drops abruptly below without the Hebel-Slichter coherence peak, and the relation constant remains true well below .
Rice and Sigrist suggested the possibility of an odd-parity (, p-wave) pairing state in Sr2RuO4 [7]. Such spin-triplet superconductivity in Sr2RuO4 is supported by 17O NMR Knight shift data showing that the spin susceptibility is not affected by the superconducting state for magnetic fields parallel to the RuO2 planes [8]. Muon-spin rotation (Sr) experiments confirm the appearance of an internal magnetic field below the transition temperature; thus, time-reversal symmetry is broken pointing to an odd-parity p-wave state [9]. However, the actual symmetry of the superconducting state in Sr2RuO4 is still a matter of debate. Possible f-wave superconductivity in Sr2RuO4 has been suggested [10] based on evidence of a line-node gap [11] which does not fit with the previously proposed isotropic (full energy gap) p-wave model, prompting further investigation [12, 13].
The above discussion suggests that it is important to understand the mechanisms that lead to the large quasiparticle mass enhancements [3] in Sr2RuO4. One possible method to achieve this is to compare cyclotron resonance measurements with magnetic quantum oscillations [14, 15, 16]. Quantum oscillation measurements allow one to deduce quasiparticle masses renormalized by both electron-electron and electron-phonon interactions (the orbitally-averaged effective mass ) [14, 15, 16]. By contrast, a cyclotron resonance experiment provides information about the dynamical mass , which, to first order, is expected to be affected only by electron-phonon interactions [14, 15, 16]. Therefore, a comparison of and potentially allows one to identify the relative importance of electron-electron and electron-phonon interactions. In this paper, we describe a measurement of cyclotron resonance in Sr2RuO4. A resonant cavity that is able to rotate in the magnetic field [17] allows a detailed study of the evolution of resonance features with angle, allowing unambiguous association of the resonances with the various Fermi-surface sections.
2 Experimental Details
Cyclotron resonance in Sr2RuO4 was observed using a millimetre-wave cavity perturbation technique [17]. Such measurements have been shown to probe the bulk conductivity properties of a number of anisotropic conductors [17, 18, 19, 20]. In the current experiment, changes in the dissipation of the cavity ( factor) are measured as a function of an external quasistatic magnetic field with the millimetre-wave frequency held constant [17]. It is assumed that changes in the dissipation of the cavity are due to changes in the dissipation of the sample inside [17, 21].
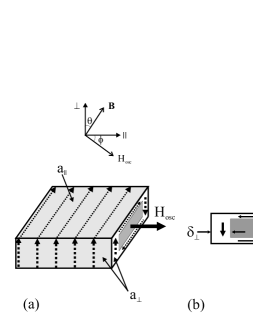
The sample is placed in the middle of a rectangular cavity such that the millimetre-wave magnetic field is polarized parallel to the sample’s highly conducting planes (perpendicular to the -axis) (see Figure 1) [17]. The response of an anisotropic conductor such as Sr2RuO4 in this electromagnetic environment is understood by examining the polarizations of the currents induced in the sample by . For parallel to the plane (the highly-conducting plane), both in-plane and interlayer currents are induced (Figure 1) [17]. These currents flow within a distance (here is the skin depth) from the sample’s edges and faces (Figure 1 (b)). We can estimate in-plane () and interlayer () skin depths in Sr2RuO4 using the expression where is the conductivity and is the measurement frequency [22]. At 0.7 K, GHz (the resonant frequency of the cavity [17]) and m-1 [23], where is the conductivity within the planes; hence, the in-plane skin depth is m. The corresponding interlayer skin depth is expected to be m, since [23].
Single crystals of Sr2RuO4 from two batches were used for the current experiments; Sample A (lower quality) was from batch C85A10a (=1.36 K, sample size mm3), whereas Sample B (higher quality) was from batch C129A1 (=1.42 K, sample size mm3). In the skin-depth regime, the dissipation in the sample is governed by the surface resistance which is proportional to the appropriate skin depth ( or ) multiplied by an appropriate sample area ( or ) for the surface across which the current travels [17, 19, 22, 24]. The ratio of the power dissipation due to interlayer and in-plane currents is given by . For Sample B the area ratio is and the power dissipation ratio is , which indicates that both and contribute to the dissipation within the cavity. Thus we expect to be sensitive to high-frequency effects involving both in-plane and interlayer currents [17].
The cavity, constructed out of silver rectangular waveguide, has dimensions mm and resonates in the TE102 mode at 70.9 GHz [17]. The sample is placed in the centre of the cavity; thus for the TE102 mode the sample sits in the oscillating magnetic field antinode. On introducing a typical crystal, the quality factor of the cavity changes from 1500 to 1200 and the resonant frequency shifts by 130 MHz. The oscillatory electromagnetic field in the cavity induces currents in the sample with a magnitude proportional to the sample’s conductivity [17, 18, 20, 21]. The currents dissipate energy, affecting the quality factor of the cavity and thus the amplitude of the millimetre-wave transmitted through it. Cyclotron resonance appears as a maximum in the high-frequency conductivity; we detect it as a minimum in the transmission of the cavity. The cavity is mounted inside a special 3He cryostat (temperatures K) which allows it to be rotated in the magnetic field [17]; the radiation travels to and from the cavity via a pair of rectangular stainless steel waveguide. The waveguide and the cavity are coupled using recessed circular coupling holes and two rexolite cylinders which align the iris in the waveguide with the cavity iris and provide a convenient rotation axis for the cavity [17]. A Millimetre-wave Vector Network Analyser (MVNA) was used as a source and detector of the millimetre-wave radiation [17].
The measurement was performed in quasistatic magnetic fields of up to 45 T supplied by resistive and hybrid magnets at NHMFL, Florida State University; further experiments employed a superconducting magnet in Oxford, which provided fields of up to 17 T.
3 Measurements and Results
The cavity transmission was measured with the cavity and sample at many different orientations in the static magnetic field. Two angles, and , are used describe the geometry of the measurements.
-
•
describes the orientation of the sample inside the cavity. It is the angle between the sample -axis and the direction of the oscillating magnetic field inside the cavity, . The angles were studied for sample B (=1.42 K) and for sample A (=1.36 K).
-
•
is defined as the angle between the external quasi-static magnetic field and the normal to the sample plane, i.e. the angle between the magnetic field and the Fermi cylinder axes. The angle provides detailed information about the evolution of cyclotron resonance features.
Following the angle-dependent-magnetoresistance-oscillation (AMRO) [25] and de Haas-van Alphen oscillation [26, 27, 28] experiments which have been used to derive the Fermi-surface topology, we expect a twofold symmetry of the cyclotron resonance with respect to (negative and positive angles) and a fourfold symmetry with respect to .
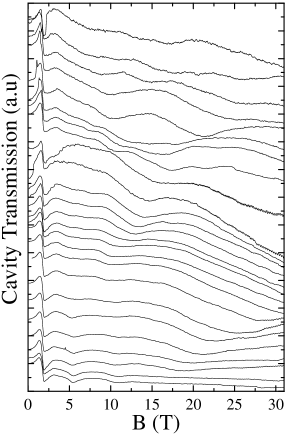
The left-hand side of Figure 2 shows the data collected for and Sample B (=1.42 K). Here, the transmission of the cavity is plotted as a function of the magnetic field for a range of field orientations, . Measurements were taken every 2.5∘ for . Above the signal-to-noise ratio becomes poor because the coupling between the waves in the waveguide and the wave in the cavity is reduced with angle by a factor (); hence the amplitude of transmission of the whole system (signal in and out) falls by a factor () (reduction factor ) [17, 18]. The data are shown offset for clarity, with no background subtraction. The absorption visible in every trace at 2 T is due to magnetic impurities in the stainless steel waveguide used to construct the insert [17, 18]. This absorption is independent of and of temperature. The sweeps also show quantum oscillations; analysis of their frequency is in good agreement with the and frequencies reported previously [26, 27, 28]. Thus, we can be confident that the millimetre waves are well coupled to the sample within the cavity. The detailed angle dependence of the quantum oscillations is described in Section 5.2.
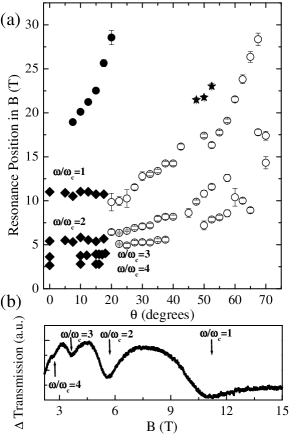
Initially, for , three absorption features are clearly visible in Figure 2 and their evolution can be easily tracked at small angles. For the spectrum becomes increasingly complicated, with many additional absorption features becoming visible. The positions in field of the observed minima in transmission (corresponding to maxima in the conductivity of the sample) are plotted in the right-hand side of Figure 2 as a function of angle. This visually simplifies the complex evolution of features; for example, inset (b) of Figure 2 shows one set of raw data taken for at low field. Four absorptions can be observed; their positions are plotted above in (a), corresponding to the four black diamonds at .
We have also performed a more detailed exploration of the angle dependence of the transmission for a different orientation of the sample within the cavity. The left-hand side of Figure 3 shows the transmission of the cavity containing Sample B as a function of magnetic field and angle . The sample was again placed in the cavity centre but its orientation was changed so that . For the angle was changed in increments up to . These data and data obtained at various angles for the lower quality sample, show that the spectra are independent, confirming the largely cylindrically symmetric nature of the Fermi-surface sections [29].
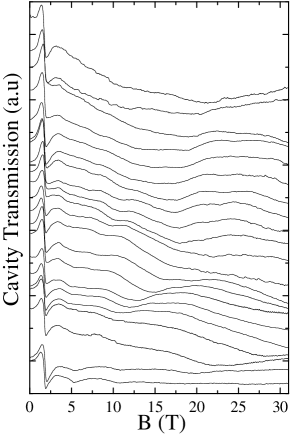
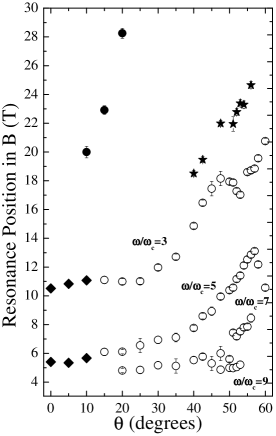
The absorption features evolve identically to the ones obtained for . The position of the absorption features in field is plotted against in the right-hand side of Figure 3. Data obtained from the lower quality sample (=1.36 K) are also qualitatively similar, although the features are less clearly resolved and their evolution is more difficult to trace. The good agreement between the various measurements means that we can be confident that the absorption features we observe and the trends we identify in their evolution are robust and reproducible.
4 Interpretation of data
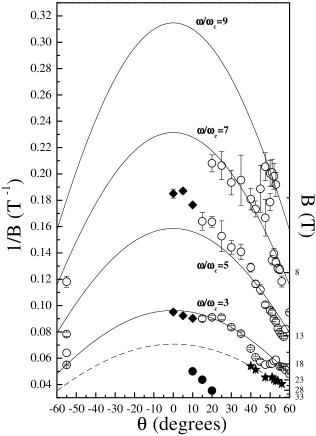
We shall now explain the origin of the features identified by open circles, and black circles, squares, diamonds and stars shown in Figure 4. This figure plots the inverse of the resonance field positions for Sample B as a function of ; as will become apparent below, this method of displaying the data makes identification of the various series of cyclotron resonances much easier.
Before allocating the different resonances to the various Fermi-surface sections of Sr2RuO4, it is necessary to discuss the various mechanisms that give rise to harmonics of cyclotron resonance.
4.1 Cyclotron harmonics
The presence of harmonics of the fundamental cyclotron resonance frequency is most easily discussed in terms of the semiclassical motion of quasiparticles on the Fermi surface in a magnetic field. This is determined by the Lorentz force [30],
| (1) |
where is the quasiparticle charge and where the quasiparticle velocity v is given by
| (2) |
Here is the gradient operation in -space and is the quasiparticle energy [30]. Equations 1 and 2 produce orbits on the Fermi surface in planes perpendicular to the magnetic field.
All three Fermi-surface sections in Sr2RuO4 are known to be weakly corrugated cylinders [29]. As long as B is not applied in the intralayer plane, all of the field-induced orbits in Sr2RuO4 will be closed orbits, enabling cyclotron frequencies to be defined;
| (3) |
where is defined by
| (4) |
Here is the cross-sectional -space area of the closed orbit [30]. In Sr2RuO4, the weak distortions in the interlayer () direction have little effect on the cross-sectional areas of the almost-cylindrical Fermi-surface sections [29]; hence, the corresponding cyclotron frequencies will not depend much on .
The contributions that this orbital motion makes to the various components of the frequency-dependent conductivity tensor are determined by the evolution of the quasiparticle velocity [17, 31, 32]. Oscillations in a particular velocity component at frequencies that are harmonics of will lead to resonances in the corresponding conductivity tensor component at the same harmonics [17, 31, 32]. We now distinguish two sources of these oscillations.
4.1.1 Odd harmonics of in the intralayer conductivity
If a cylindrical Fermi-surface section has a non-elliptical cross-section, then the intraplane quasiparticle velocity components and will oscillate non-sinusoidally, the oscillation being describable by a series of Fourier components at harmonics of [31]. When, as is the case in Sr2RuO4, the Fermi-surface section has inversion symmetry [29], only odd harmonics are observed [31]. Therefore, resonances in the frequency-dependent intralayer conductivity are expected at odd harmonics of .
4.1.2 Odd and even harmonics of in the interlayer conductivity
The weak distortions of a Fermi-surface section in the interlayer direction cause the quasiparticle velocity to “rock up and down” in the interlayer direction as the quasiparticle traverses a cyclotron orbit [32]. This will induce an oscillatory component into the interlayer velocity ; experiments [17] and calculations [32] have shown that both odd and even harmonics of are possible. Therefore resonances in the frequency-dependent interlayer conductivity components , are expected at integer harmonics of .
4.2 Identification of cyclotron resonance series
The almost-cylindrical nature of the Fermi-surface sections of Sr2RuO4 [29] means that the cyclotron frequency will have the straightforward angular dependence , where it the angle between B and the () direction and is the cyclotron mass observed at [34]. Harmonics will therefore occur at frequencies , where is an integer.
In our experiment, the measurement frequency is fixed and the magnetic field is swept. Absorption is observed at particular values of defined by
| (5) |
The harmonic branches and their cosinusoidal dependence on are most easily identified when is plotted against (see Figure 4); the harmonics are evenly spaced in , and vary as .
| Fit () | ||||
| 0.0966 0.002 | 0.160 0.002 | 0.219 0.002 | - | |
| 4.10 0.09 | 2.47 0.05 | 1.81 0.01 | - | |
| 0.0963 0.001 | 0.159 0.003 | 0.231 0.004 | 0.315 0.003 | |
| 4.11 0.03 | 2.50 0.05 | 1.71 0.03 | 1.26 0.01 | |
| Interpretation | 3rd Harmonic | 5th Harmonic | 7th Harmonic | 9th Harmonic |
| Fermi surface |
Four branches corresponding to the hollow circles are fitted by Equation 5 in Figure 4; the values of the fitting parameters and the corresponding cyclotron effective masses are given in Table 1. Inspection of the fitting parameters reveals that the ratio is very close to . This indicates that all of these resonances arise from a single Fermi-surface section, and that we are observing the third, fifth, seventh and ninth harmonics of the cyclotron resonance. The observation of only odd harmonics strongly suggests that the resonances result from the intralayer conductivity mechanism described in Section 4.1.1.
The fundamental frequency (first harmonic) of this series occurs at 31.2 T for , corresponding to a cyclotron mass of where is the free electron mass. Given the high cyclotron mass, it is probable that this series originates from the Fermi-surface section, for which a thermodynamic effective mass of has been deduced from analysis of magnetic quantum oscillations [3].
Further support for this assignment can be qualitatively derived from the attributes of the Fermi-surface section [29]. Bandstructure calculations [33] show that the Fermi velocity varies strongly around the sheet, which will tend to lead to a large contribution to the frequency-dependent intralayer magnetoconductivity [31]. By contrast, the sheet is only very weakly warped in the interlayer direction, leading one to expect that it only plays a small role in the interlayer conductivity [17, 31].111The Fermi surface accounts for only 6% of the -axis conductivity (as opposed to the sheet with an estimated 86% contribution) [29].
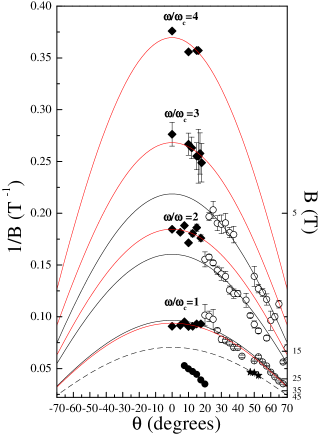
We now turn to data for angles , where the spectra are dominated by a different set of branches (filled diamonds). The fitting parameters for this series of resonances are listed in Table 2; the ratios are close to (solid line fits to Equation 5 in the right-hand side of Figure 4). In Figure 2(b)we show the raw data sweep and indicate the positions of the absorption features corresponding to the harmonics. The fundamental frequency (first harmonic) of this series occurs at 10.9 T for , corresponding to a cyclotron mass of . The fact that both even and odd harmonics are observed is suggestive of the interlayer conductivity mechanism for harmonics [32] described in Section 4.1.2.
| Fit () | ||||
| 0.0939 0.001 | 0.185 0.002 | 0.268 0.002 | 0.370 0.003 | |
| 4.22 0.04 | 2.14 0.03 | 1.48 0.01 | 1.07 0.01 | |
| 0.0932 0.001 | 0.184 0.003 | - | - | |
| 4.25 0.05 | 2.14 0.03 | - | - | |
| Interpretation | 1st Harmonic | 2nd Harmonic | 3rd Harmonic | 4th Harmonic |
| Fermi surface |
The sheet dominates the interlayer conductivity and is of a form that will generate strong harmonic content in the interlayer velocity [29]. We therefore assign the integer harmonic series to cyclotron resonance of the sheet. Comparison of the cyclotron mass with masses obtained from analysis of de Haas-van Alphen oscillations [3] also supports the assignment of this series to the sheet.
One further branch in Figure 4, corresponding to filled stars, is well fitted by Equation 5. However, it does not appear to be simply related to the other two harmonic series. A detailed angle dependence study in the orientation (every 1∘ at higher angles) clearly shows this cyclotron resonance feature in Figure 4 (filled stars). A fit to Equation 5 shown as a dashed line in Figure 4 gives as the value of the fitting parameter, which corresponds to T and a cyclotron mass of . This feature is observed at higher angles and has no simple relation to the other series of harmonics visible in this region. No cyclotron resonance harmonics are observed, and indeed it would be difficult to argue convincingly for their presence since they would lie very close to the other series of branches which have a much larger absorption amplitude.
This cyclotron resonance may originate from the Fermi pocket. The Fermi surface is of little importance in interlayer transport [27], and so this would be a fundamental cyclotron resonance observed in the in-plane conductivity. For the Fermi surface an effective mass of has been deduced from analysis of magnetic quantum oscillations [3].
4.3 Summary of cyclotron masses obtained
| source | ||||
|---|---|---|---|---|
| Band Calc. () | 1.1 | 2.0 | 2.9 | [3] |
| Effective | 3.4 | 7.5 | 14.6 | [3] |
| Cyclotron | 4.33 0.05 | 5.81 0.05 | 9.71 0.2 | [35]. |
| Cyclotron | 5.60 0.03 | 4.29 0.05 | 12.35 0.2 | This paper |
The quasiparticle masses obtained from the various series of cyclotron resonance harmonics () are summarised in the fourth row of Table 3, which also shows the corresponding (i.e. orbitally-averaged) bare masses from band calculations () and magnetic-quantum-oscillation experiments () (the latter is usually known as the effective mass). In the simpler theories of many-body effects [14, 15, 16], is closely related to the dynamical mass , which represents the bare band mass renormalised only by electron-phonon interactions. By contrast, contains additional contributions from electron-electron interactions. Hence, the simple expectation is that [14, 15, 16]. This does indeed seem to hold for the and Fermi-surface sections. However, in the case of the pocket, .
This variation in behaviour between the various Fermi-surface sections is not unexpected. A recent theory of Kanki and Yamada has shown that, if the translational invariance of a Fermi Liquid is broken, the mass measured in a cyclotron resonance experiment may exceed the effective mass under some circumstances [36]. The relationship between the mass measured in a cyclotron resonance experiment and that derived from magnetic quantum oscillations may depend strongly on bandfilling [36]. Moreover, recent attempts to account for the superconducting properties of Sr2RuO4 suggest that the many-body effects and interactions vary amongst the Fermi-surface sections, with, for example, some contributing to the superconductivity and others not [10, 12, 13].
Finally, Table 3 compares the present results with the cyclotron resonance experiment of Hill et al. [35], which employed an overmoded resonant cavity (sample in a magnetic field antinode) in fields of up to 31 T at 1.4 K. They obtained absorption spectra at several different frequencies but at only one orientation of the sample (). The features that we observe at very small angles replicate Hill’s measurement. However, Hill et al. went on to assign these features to fundamental cyclotron resonance modes associated with the in-plane conductivity from the three Fermi surface sections , , and . Our angle-dependent study shows that this assignment (although intuitive) is incorrect; it is necessary to make measurements at a whole range of sample orientations in order to observe the contributions from all of the Fermi-surface sections.
5 Other features in the Magneto-optical spectra
5.1 Large amplitude fast-moving resonance
One resonance branch in the spectra is difficult to assign, because it does not behave in a way consistent with the expected angle dependence for quasi-two-dimensional cyclotron resonance [34] (see Equation 5). The high-magnetic-field low- feature (filled circles in Figures 2, 3 and 4), plays a dominant role in the transmission spectra shown in Figure 2 and Figure 3. It is interesting that this large feature is not observed for the very small angles . Above , the feature moves out of our accessible field range.
We can make the following observations: the intensity of the feature increases rapidly as the in-plane component of the magnetic field grows; its amplitude then dominates the spectra; its position shows a rapid progression to high fields as the magnetic field is rotated away from the -axis. The first characteristic suggests that this feature arises from a resonance in the inter-plane conductivity. The large amplitude of the resonance suggests that it originates from the Fermi surface section, which dominates the interlayer transport [29]. The feature is visible alongside the odd and even harmonics we have ascribed to the variation of the interplane velocity on the Fermi surface. The most puzzling aspect of the feature is the unusual dependence of its resonant field on angle. The cyclotron orbit period increases with magnetic field angle more rapidly than , which cannot be explained by traditional descriptions of quasi-two-dimensional cyclotron resonance. Because of the limited amount of data we are able to collect on the feature, the precise dependence can not be reliably determined; even higher fields are necessary to follow this effect.
5.2 Magnetic Quantum Oscillations
In quasi two-dimensional conductors magnetic quantum oscillations have provided a valuable method for probing the Fermi-surface topology [29, 34]. In our experiment, quantum oscillations were observed both in the amplitude and in the phase of the transmission signal from the cavity containing a sample of Sr2RuO4. This assures us that the millimetre waves are well coupled to the sample and that changes in cavity signal are due to changes in the sample properties.
Fast Fourier Transform (FFT) analysis has been carried out on oscillations seen in the phase and in the amplitude of the signal transmitted by the loaded cavity with very similar results. The oscillations in the phase of the transmitted signal are more prominent then in the amplitude; this is expected because the phase changes very rapidly at resonance [17] so that small shifts in conductivity produce a large response. In this section, we therefore concentrate on the analysis of quantum oscillations seen in the phase of the transmission signal from the cavity.
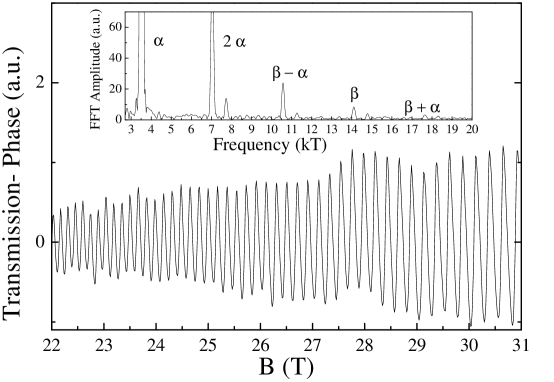
Oscillatory components corresponding to the cross sectional areas of the three Fermi-surface sections are expected [29]. In addition, components due to the sum or difference of the frequencies may be seen [3]. The quantum oscillations in the phase of the cavity signal show components with frequencies (2.88 kT), its second harmonic (5.77 kT), (11.55 kT) and the presence of the sum and difference frequencies (8.66 kT) and (14.45 kT) shown in the sweep in Figure 5. The frequency was not observed because of the relatively high temperature, T = 0.7 K (the amplitude of this frequency is very small even in sensitive Shubnikov-de Haas and de Haas-van Alphen measurements at 0.1 K [3, 29]). The evolution of the various quantum oscillation frequencies with angle is shown in Figure 6.
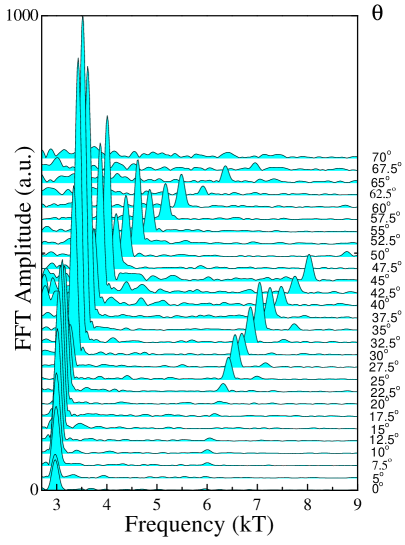
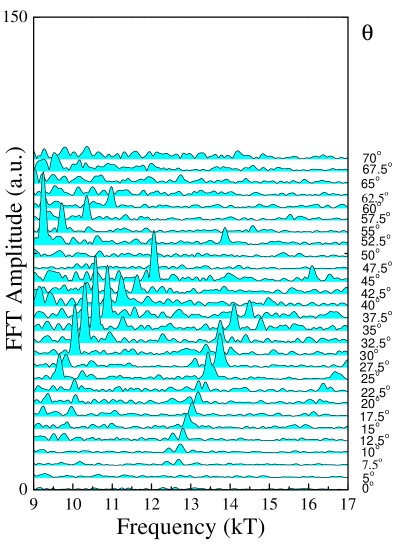
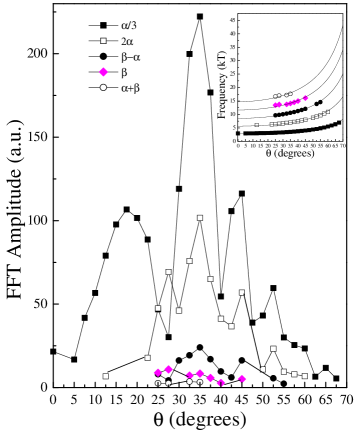
Figure 7 shows the amplitude of the observed oscillatory components as a function of the tilt angle . The inset of the figure shows that the frequencies of each component shift to higher values with increasing according to , consistent with the angle dependence of the cross-sectional area of the almost cylindrical Fermi surface [29]. It is clear that the amplitudes of all the observed frequencies are enhanced at the angle .
In a quasi-two-dimensional system, the amplitude of the magnetic quantum oscillations is enhanced at the so-called “Yamaji angles”, where the width of the distribution of cross-sectional areas of semiclassical orbits about a particular Fermi-surface section becomes a minimum [34, 38]. In this configuration, the system behaves much more like a purely-two-dimensional metal, as all of the cyclotron frequencies of orbits about the Fermi-surface section in question become very similar. We observe this effect for and at , in reasonable agreement with the maximum amplitudes of Shubnikov-de Haas oscillations seen at for the frequency and for the frequency [26, 28, 37].
The sum and difference frequencies and are also enhanced at . This is because these oscillations result mainly from the chemical potential oscillation effect (CPOE) [28, 34, 39]. In the CPOE, the chemical potential becomes pinned to very narrow Landau levels over finite ranges of magnetic field, modifying the way in which the Landau levels from other Fermi-surface sections depopulate [39]; hence sum and difference frequencies are generated. The CPOE becomes most pronounced when the Landau levels have the smallest width, i.e. when the system looks most like a purely two-dimensional metal [39]. Thus, the maximum effect of the CPOE (and therefore the maximum amplitude of the resulting mixed quantum-oscillation frequencies) is expected at the Yamaji angles, as observed [28].
6 Summary
This study of the angle-dependence of the magneto-optical response of Sr2RuO4 has revealed several postulated [31, 32] cyclotron-resonance related effects, some of which have not previously been observed. Because of these effects, which involve variations in the in-plane [31] and interplane [32] quasiparticle velocities, the magneto-optical response of Sr2RuO4 is very complicated. In order to identify the various resonances, it is necessary to measure magneto-optical spectra with the sample at many orientations in the magnetic field. Our data show that previous experiments, with the sample at one fixed orientation [35], resulted in incorrect assignments and values of the cyclotron masses.
We have observed odd cyclotron-resonance harmonics arising from the variation of the in-plane velocities of quasiparticles on the Fermi surface and obtained a corresponding quasiparticle mass of . We have also observed odd and even harmonics arising from the variation of the interplane velocities of quasiparticles on the Fermi surface; this gives a mass of . Another cyclotron resonance feature with a corresponding mass of was tentatively assigned to the pocket. Finally, we have noted an unusually strong absorption, the field of which evolves rapidly with sample orientation. This feature does not appear to be simply related to conventional cyclotron resonance.
The quasiparticle masses of the and Fermi-surface sections measured in our cyclotron resonance experiment are in accord with the expectations of simple many-body theories, in that they are considerably larger than the bare masses predicted by bandstructure calculations, but smaller than the effective masses deduced from de Haas-van Alphen experiments. In the case of the resonance attributed to the Fermi-surface pocket, the quasiparticle mass measured is larger than the effective mass from the de Haas-van Alphen effect. This may be related to recent calculations of many-body effects, which show that the mass measured in a cyclotron resonance experiment may exceed the effective mass under some circumstances, which depend on details of the bandstructure and band filling [36].
7 Acknowledgements
This work is supported by EPSRC (UK). The National High Magnetic Field Laboratory is supported by the US Department of Energy (DoE), the National Science Foundation and the State of Florida. We thank Christoph Bergemann, Steve Blundell, Neil Harrison, Stephen Hill, Albert Migliori and Andy Mackenzie for stimulating discussions.
8 References
References
- [1] Y. Maeno, H. Hashimoto, K. Yoshida, S. Nishizaki, T. Fujita, J.G. Bednorz, and F. Lichtenberg, Nature 372, 532, (1994).
- [2] Y. Maeno, Physica B 281&282, 865, (2000).
- [3] A.P. Mackenzie, S. Ikeda, Y. Maeno, T. Fujita, S.R. Julian, and G.G. Lonzarich, J. Phys. Soc. Jpn. 67, 385 (1998).
- [4] A.P. Mackenzie, R.K. Haselswimmer, A.W. Tyler, G.G. Lonzarich, Y. Mori, S. Nishizaki, and Y. Maeno, Phys. Rev. Lett. 80, 161 (1998).
- [5] R. Jin, Yu. Zadorozhny, Y. Liu, D.G. Schlom, Y. Mori, and Y. Maeno, Phys. Rev. B 59, 4433 (1999).
- [6] K. Ishida, Y. Kitaoka, K. Asayama, S Ikeda, S. Nishizaki, Y. Maeno, K. Yoshida, T. Fujita, Phys. Rev. B 56, R505 (1997).
- [7] T.M. Rice and M. Sigrist, J.Phys.: Condens. Matter 7, L643, (1995).
- [8] K. Ishida, H. Mukuda, Y. Kitaoka, K. Asayama, Z.Q. Mao, Y. Mori, and Y. Maeno, Nature 396, 658, (1998).
- [9] G.M. Luke, Y. Fudamoto, K.M. Kojima, M.I. Larkin, J. Merrin, B. Nachumi, Y.J. Uemura, Y. Maeno, Z.Q. Mao, Y. Mori, H. Nakamura, and M. Sigrist, Nature 394, 558, (1998).
- [10] H. Won and K. Maki, Europhys. Lett. 52, 427, (2000).
- [11] S. Nishizaki, Y. Maeno, and Z.Q. Mao, J. Phys. Soc. Jpn. 69, 572, (2000). K. Ishida, H. Makuda, Y. Kitaoka, Z.Q. Mao, Y. Mori, and Y. Maeno, Phys. Rev. Lett 84, 5387, (2000).
- [12] K. Kuroki, M. Ogata, R. Arita, and H. Aoki, Phys. Rev. B 63, 060506 (2001).
- [13] T. Takimoto, Phys. Rev. B 62, R14641 (2000).
- [14] W. Kohn, Phys. Rev. 123, 1242, (1961).
- [15] K.F. Quader, K.S. Bedell, and G.E. Brown, Phys. Rev. B 36, 156, (1987).
- [16] J. Singleton, F.L. Pratt, M. Doporto, T.J.B.M. Janssen, M. Kurmoo, J.A.A.J. Perenboom, W. Hayes, and P. Day, Phys. Rev. Lett. 68, 2500 (1992).
- [17] J.M. Schrama et al., J. Phys.: Condens. Matter 13, 2235 (2001).
- [18] A. Ardavan, J.M. Schrama, S.J. Blundell, J. Singleton, W. Hayes, M. Kurmoo, P. Day, and P. Goy, Phys. Rev. Lett. 81, 713 (1998).
- [19] S. Hill, Phys. Rev. B 62, 8699 (2000).
- [20] A. Polisskii, J. Singleton, P. Goy, W. Hayes, M. Kurmoo, and P. Day, J. Phys. Condens. Matter 8, L195, (1996).
- [21] M. Mola, S. Hill, P. Goy, M. Gross, Rev. Sci. Instrum. 71, 186 (2000).
- [22] B.I. Bleaney and B. Bleaney,Electricity and Magnetism, (Oxford University Press, London, 1976), Chapter 8.
- [23] A.P. Mackenzie, S.R. Julian, A.J. Driver, G.G. Lonzarich, N.E. Hussey, Y. Maeno, S. Nishizaki, and T. Fujita, Physica C 263, 510 (1996).
- [24] C.P. Poole, Electron Spin Resonance, (Interscience Publishers, New York, 1967), p 257-339.
- [25] E. Ohmichi, H. Adachi, Y. Mori, Y. Maeno, T. Ishiguro, and T. Oguchi, Phys. Rev. B 59, 7263 (1999); F. Ishii, and T. Oguchi, Physica B 281 & 282, 784, (2000).
- [26] Y. Yoshida, R. Settai, Y. 0̄nuki, H. Takei, K.Betsuyaku, and H. Harima, J. Phys. Soc. Jpn. 67, 1677 (1998).
- [27] A.P. Mackenzie, S.R. Julian, A.J. Diver, G.J. McMullan, M.P. Ray, G.G. Lonzarich, Y. Maeno, S. Nishizaki, and T. Fujita, Phys. Rev. Lett. 76, 3786 (1996).
- [28] E. Ohmichi, Y. Maeno, and T. Ishiguro, J. Phys. Soc. Jpn. 68, 24 (1999).
- [29] C. Bergemann, S.R. Julian, A.P. Mackenzie, S. NishiZaki, and Y. Maeno, Phys. Rev. Lett. 84, 2662 (2000).
- [30] N.W. Ashcroft, and N.D. Mermin, Solid State Physics, (Holt, Rinehart and Winston, New York, 1976).
- [31] S.J. Blundell, A. Ardavan, J. Singleton, Phys. Rev. B 55, R6129 (1997).
- [32] S. Hill, Phys. Rev. B 55, 4931 (1997).
- [33] I.I. Mazin and David J. Singh, Phys. Rev. Lett., 79, 733 (1997).
- [34] J. Singleton, Rep. Prog. Phys. 63, 1111 (2000).
- [35] S. Hill, J.S. Brooks, Z.Q. Mao, and Y. Maeno, Phys. Rev. Lett. 84, 3374 (2000).
- [36] K. Kanki, and K. Yamada, J. Phys. Soc. Jpn. 66, 1103 (1997).
- [37] Y. Yoshida, A. Mukai, K. Miyake, N. Watanabe, R. Settai, Y. 0̄nuki, T.D. Matsuda, A. Aoki, H. Sato, Y. Miyamoto, and N. Wada, Physica B 281&282, 959, (2000)
- [38] K. Yamaji, J. Phys. Soc. Jpn. 58, 1520 (1989).
- [39] N. Harrison, J. Caulfield, J. Singleton, P.H.P. Reinders, F. Herlach, W. Hayes, M. Kurmoo, and P. Day, J. Phys. Condens. Matter 8, 5415 (1996).