Correlation studies of open and closed states fluctuations in an ion channel: Analysis of ion current through a large conductance locust potassium channel
Abstract
Ion current fluctuations occurring within open and closed states of large conductance locust potassium channel (BK channel) were investigated for the existence of correlation. Both time series, extracted from the ion current signal, were studied by the autocorrelation function (AFA) and the detrended fluctuation analysis (DFA) methods. The persistent character of the short- and middle-range correlations of time series is shown by the slow decay of the autocorrelation function. The DFA exponent is significantly larger than 0.5. The existence of strongly-persistent long-range correlations was detected only for closed-states fluctuations, with . The long-range correlation of the BK channel action is therefore determined by the character of closed states. The main outcome of this study is that the memory effect is present not only between successive conducting states of the channel but also independently within the open and closed states themselves. As the ion current fluctuations give information about the dynamics of the channel protein, our results point to the correlated character of the protein movement regardless whether the channel is in its open or closed state.
PACS: 87.17.-d, 05.40.+j
Keywords: Ionic current, BK channel, detrended fluctuation analysis, autocorrelation function
I Introduction
Ion transport through biological channels is a phenomenon which has attracted attention of biophysicists and biologists for many years [1]. The main reason of this profound interest is that ion channels, abundant in most, if not all, eukaryotic cells, are involved in many physiological processes such as secretion, regulation and membrane potential, signal transduction and osmoregulation [1, 2]. A breakthrough in such studies was brought about by the patch clamp technique, which enables to measure single-channel ion currents with millisecond time resolution and therefore probes the dynamics of the channel protein [3]. The tiny, picoamp current through an individual ion channel ”clamped” at constant voltage does not lead to a constant signal but presents a peak-valley landscape pattern of high and low current values. The channel’s opening state can be determined on the basis of the ion current: a low current corresponds to a closed channel state, while high current values indicate an open state. The analysis of ion current recordings has been found to be a tremendous challenge for many theoreticians. Usually the data were analysed in terms of models and tools based on the assumption that the channel kinetics is a Markov process [5] over a small number of discrete states [1, 3, 4]. There is, however, clear evidence that the behavior of ion current is non-Markovian [6, 7]. For example, the method of testing Markovianity, based on the Smoluchowski-Chapman-Kolmogorov equation [8] distinctly revealed a non-Markovian action of the large conductance locust potassium channel (BK channel). Dwell-time series of the same system subjected to the (i) autocorrelation, (ii) Hurst and (iii) detrended fluctuation (DFA) analysis showed the existence of long-range memory effects in the BK channel [9].
Previously, the focus of attention has been on the character of the transitions between open and closed states of the channel without detailed studies of fluctuations occurring within one state. If large conformational changes of the channel protein result in channel closing and opening, observed as low and high values of the current, respectively, then the fluctuations of closed and open states can reflect the protein conformational substates. The existence of a spectrum of protein substates occurring on a wide time scale range is supported by strong experimental evidence, and has been widely discussed [10, 11, 12, 13, 14, 15, 16]. It would therefore be interesting to answer the question whether this channel action is also governed by a deterministic force, seen as a correlation between the substates.
A new way to examine this problem appeared after a thorough study of the effect of trends and noise in the detrended fluctuation analysis (DFA), as presented by Hu et al. [17]. These authors showed an elegant and rather thorough analysis of time series containing signals with different correlation characteristics. As ion current recordings can be also treated as a superposition of two signals, i.e. closed and open states dynamics, we have applied this DFA technique to a time series of ion current through BK channel. The experimental recording has been divided into two signals, containing closed and open state fluctuations, respectively. We consider therefore the closed (open) state as a whole with the opposite state as an ”interruption”. It enabled us to check the existence of long time-lag memory effects occurring in spite of the gaps in channel activity. The resulting time series have been subjected to both a DFA and an autocorrelation function analysis (AFA).
II Experimental design
Data sets from cell-attached patches of adult locust (Schistocerca gregaria) extensor tibiae fibers [8, 18] are discussed. The potassium current through a voltage-sensitive large conductance locust potassium channel (BK channel) was measured by the patch clamp technique [3] with a sampling frequency kHz and at a 60 mV voltage. Details of the experimental set-up and recordings of the data have been given in [8, 19]. The analyzed ion current data consist of one record of 25 s duration, composed of 250 000 points (see Fig. 1). All points in the time series have been first divided into two groups, to be called closed and open, depending on their values in relation with the threshold current pA, separating two modes in the ion current probability density function (PDF). The value of has been determined by (i) approximation of PDF by means of kernel density estimator technique, and (ii) presenting the resulted function in double-logarithmic coordinates [19]. The PDF has been treated as a superposition of two unimodal densities with distinct power laws, whose intersection determined the threshold separating closed and open states. A given ion current point is categorized as belonging to an open state if , otherwise it belongs to the closed state. As we want to investigate correlation properties of closed and open states separately, the fluctuations of the two states have to be extracted from the ion current time signal. This was achieved using the procedure discussed in [17], based on cutting out ”bad”, i.e. non-interesting parts of a time series: for extracting the closed state signal, all points belonging to the open states were cut out and the resulting segments ’stitched’ together. The same procedure has been applied for getting open states fluctuations: after cutting out closed states, the open states points were joined together. The resulting time series of closed and open states fluctuations contained 128 760 and 121 240 points, respectively; the signals are presented in Fig. 1.
III Results and discussion
A Detrended fluctuation analysis
The detrended fluctuation analysis is a tool for investigating correlations in a self-similar time series with stationary increments [17, 20, 21]. It provides a simple quantitative parameter - the scaling parameter , which is a signature of the correlation properties of the signal. The advantages of DFA over many methods are that it permits the detection of long-range correlations embedded in seemingly time series, and also that inherent are avoided at all time scales. The DFA technique, similar to the Hurst analysis, can be applied to a random walk ”mimicking” the cumulative time series. The DFA technique consists of dividing a time series of length into nonoverlapping boxes (called also windows), each containing points [22]. The local trend in each box is defined to be the ordinate of a linear least-square fit of the data points in that box. The detrended fluctuation function is then calculated following:
Averaging over the intervals gives the mean-square fluctuations as a function of window size . The DFA exponent is obtained from the power law scaling of the function with , and represents the correlation properties of the signal: indicates that the changes in the values of a time series are random and, therefore, uncorrelated with each other. If the signal is anti-persistent (anti-correlated), while points to the positive persistency (correlation) in the signal.
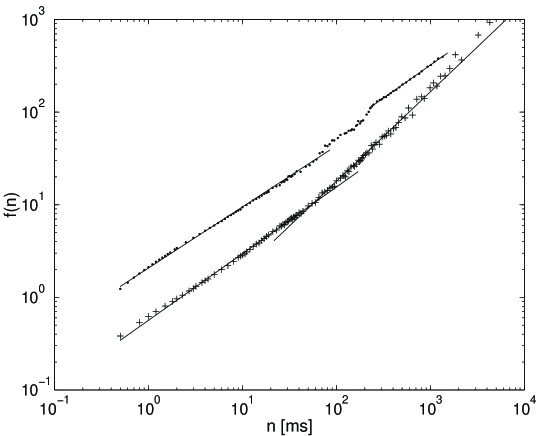
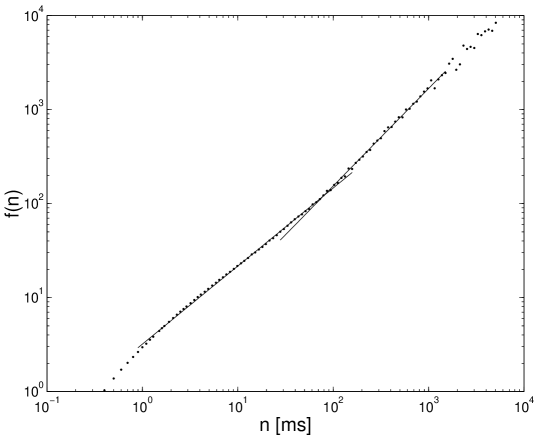
The results of the DFA analysis of cumulative ion current time series (studied before in [23]) and its two components: the series of closed and open states fluctuations, are presented in Figs. 3 and 2. The DFA analysis of the ion current signal is revisited here. In [23] the average for the whole examined time range has been found equal to . Here we show that the two significant regions of DFA scaling can be distinguished, with the threshold at 70 ms. For windows smaller than 70 ms while for ms . The significance (with 5% significance level) of the scaling difference in the two regions ( ms and ms), has been assessed by a t-test. The paired t-test has been used to show a significant difference between the two series obtained after fitting the DFA data with , and newly found values, respectively. As the existence of a threshold may depend on the order of DFA applied [17, 24], we confirmed that our results are the same also for DFA of higher orders [17].
A power law scaling of the function for the three signals has been found over a wide time scale range (three orders of magnitude); the DFA exponent significantly higher than 0.5, points to their persistent character. Note that the correlation ranges within the closed and open states are very similar. The analysis indicates that the character of channel dynamics within certain time scale range up to ca. 50 ms is the same, regardless of the channel conducting state.
The correlation properties of closed states shows crossover of the function at app. 50 ms. The function scales as following:
As the time series contains two closed states of duration longer than 200 ms, which corresponds to over 2000 experimental points, we calculated the local for those closed states. Similar analysis was not possible for open states as the longest duration of open state is only ms, which does not assure a reliable averaging required in the DFA analysis. For two closed states of duration 300.8 ms and 202.9 ms, in the range ms, , which is in a very good agreement with the value determined on the basis of the overall closed state signal for ms.
The mean-square fluctuation function for open states reads:
For the range of window size between 80 and 240 ms it was not possible to determine reliably the scaling exponent for open state fluctuations.
Note, that the crossover of DFA of closed states fluctuations (50 ms) is similar to the crossover found in the correlation between successive ionic current values (Fig. 3). For both signals the threshold determines the onset of strongly persistent long-range correlations with close to 1. Interestingly, a similar scaling behaviour was found in both, the time series of closed states’ durations as well as series consisting of all dwell-times, closed and open, studied in our previous paper [9]. The correlations between successive durations of closed states are characterised for ms also by a high exponent equal to . Similar scaling was found for the series of dwell-times durations with the threshold at . The memory within and between the closed states as well as between neighbouring conducting states, might therefore originate from a similar force(s), one of which is certainly the applied voltage. The influence of the external field is especially visible at large time scale ( ms): close to 1 for ion current signal, closed states, and dwell-times series, indicates a strongly persistent ion movement through the pore.
We would like to point out that our results, showing persistent self-similar changes of ion current within closed and open states of the channel, support fractal models of the ion channel action, developed by Liebovitch et al. [25, 26]. The power law (or scaling) nature of the ion channel function implies that the timing of channel switchings is self-similar therefore correlated within a certain time scale. It has further consequences for the state of the channel openings and closings, therefore rearrangements of the channel protein structure itself. If the channel protein operates in a fractal mode then the open-closed rearrangements do not happen all by themselves but rather result from smaller changes, introduced by the motion of small portions of the protein. The little pieces of the protein function, according to such a fractal model, ”in a concerted whole” when the channel switches [25]. Thus, the above results on the persistent character of the closed and open states fluctuations likely reflect the persistent, coherent conformational changes of the channel protein.
B Autocorrelation function
The autocorrelation function is next used in oder to investigate the correlation (memory) in the time series of closed and open states fluctuations as shown in [19]. The autocorrelation function of the signal is defined as
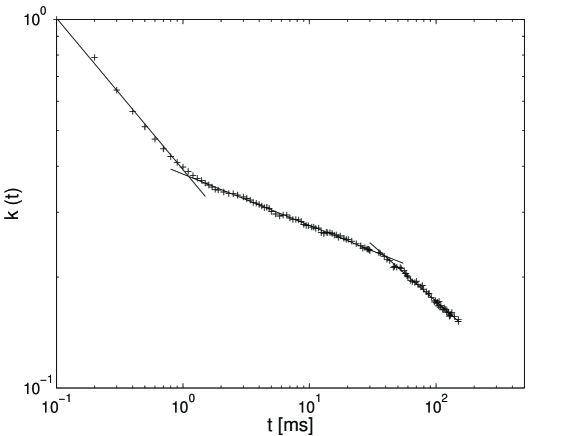
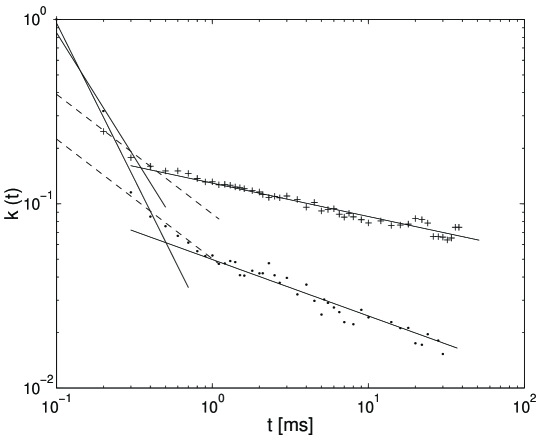
where is a standard deviation and is the mean value of the sample at the moment [19, 27]. The stationarity of the ion current signal, which implies the stationary character of the examined here closed and open states fluctuations, has been discussed in [8]. The time series has been divided into smaller sections whose similar statistical characteristics as well as lack of any trend have been found. The autocorrelation function of ion current signal was studied before [19]. Three regions of power law scaling have been determined with two crossovers: at 1 ms and 40 ms (Fig. 4). A power law behavior has also been found in the autocorrelation function of closed and open states fluctuations, presented in Fig. 5. For both time series the correlation drops significantly already at ms (to the value of app. 0.3). At ms the slow power law decay begins.
Autocorrelation function of closed states fluctuations scales as
For open states the function has the following form
Note, that the scaling exponent for ms, therefore describing the middle- and long-range correlation, for closed states fluctuations is very close to the value of the scaling exponent found in the autocorrelation function of ion current signal in the time range [1, 40] ms. The scaling exponent is in this region equal to (see Fig. 4) [19]. This finding confirms the DFA results showing that the closed state dynamics dominates ion channel behavior and the long range memory of the channel action is mainly due to correlation within and between closed states.
Having found the scaling exponents of DFA and AFA, and , respectively, we checked whether they are related with each other by the known formula [28]. We would like to note, that those exponents can be compared with each other only in the time region in which both data analysis methods have some overlap, i.e. in the low time lag scaling region ( ms, from Fig.3) for DFA, and the high time correlation region ( ms , from Fig.5) for AFA. Nevertheless, from the definition of the and one should notice that the equation relating them holds true only in the limits either or going to 1 ms. The exponents in the overlapping region are 0.69 and 0.65, for the closed and open states, respectively (Fig. 3). For comparison in Fig. 5, the scaling (this is just for suggesting a slope) is shown to indicate the expected validity of the theoretical relationship. It appears that while equals 1.62 and 1.84 for the closed and open states, respectively, from the best fit (Pearson correlation coefficient ), taking into account the 5 lowest experimental points, the value -0.65 also seems very reliable in both cases: near the crossover, there is a remarkable agreement for the open state case with such a value, and some reasonable one, for the closed state case.
IV Concluding Remarks
The main objective of the study was to investigate correlation properties of ion channel fluctuations within two extreme conducting states: closed and open, eliminating cross correlation. Previous studies showed the existence of correlations between successive durations of closed and open states [9]. The procedure of determining the dwell-time series was preceded by reconstructing the ion current time series into a dichotomous signal; therefore the individual state fluctuations were not taken into account. As the patch clamp technique, which enables to determine the time course of current states, gives some information about the conformational states of the channel, we wanted to examine the character of the dynamics of channel conformational substates. The closed and open states fluctuations were extracted from ion current time series using the procedure discussed in [17]. The approach of treating the closed (open) state as one entity enabled us look at the ”intrastate” correlation features, occurring within one, uninterrupted state of the channel, as well as ”interstate” correlation structure, present in the state with activity gaps. The resulting time series were subjected to DFA and AFA methods. Both techniques show that the correlation between sublevels of the closed states is stronger than between substates of the open channel. Long-range correlations in the fluctuations within the closed states are characterized by a DFA exponent close to 1, and by a slow decay of the autocorrelation function (with a power law exponent ). Both examined time series reveal very similar scaling properties at small and medium time lag scales: in both cases for ms is equal to app. 0.7.
The important problem to study is the time region at which the two methods overlap i.e. their exponents are not independent – related by the known linear formula [28]. We have found that for the examined data, the scaling exponents of DFA and AFA fulfill this relation in the time scale around 1 ms. Correlation properties for shorter lags are given by AFA, while the large time scale is covered only by DFA. In the examined system, the two presented methods are therefore complementary to each other.
The above results are consistent with previous analyses showing that the long-range correlations of the BK channel functioning are determined by the closed state correlation properties [9]. In this previous paper we focused on the correlation between successive durations of closed and open states, as well as correlation existing between subsequent dwell-times, therefore, neighouring closed and open (Fig. 7 and 8 in [9]). Here we looked in detail into the structure of each state. An interesting observation was made by comparing the results of those two approaches. Surprisingly, the DFA analysis showed the existence of a similar threshold at app. 50 ms, regardless whether the sucessive durations of the closed state, or the successive actual values of the current within the state are examined. Moreover, this threshold was also revealed by the DFA scaling of subsequent dwell-times durations. These findings suggest that there is a similar mechanism, regulating intra-state behaviour of the channel as well as duration of the dwell-times. Assuming that the observed memory effect is mainly due to the applied field, it can be concluded that external voltage influences the channel action on an amazingly broad time scale, starting from the short-range memory between the states distant by 0.1 ms, up to tens of ms range.
An interesting problem is to consider how the macroscopic electric field can interact with the many degrees of freedom of the channel protein, resulting in a correlated character of the protein dynamics. This question is related to the main function of the voltage-gated family of channels, i.e. stabilization of the transmembrane voltage, which is certainly influenced by the channel capability to close and to open. This question was examined in the multi-channel system consisting of voltage dependent Shaker channels, expressed in the membrane of a Xenopus oocyte [14, 15, 16]. The system was studied by observing voltage fluctuations for a various number of channels. For a low number of channels (the smallest number reported was 19) the observed fluctuations revealed a wide range of time scales, which pointed to the existence of multiple closed and open states. We focused here on the dynamics of a single voltage-gated channel, (studied on the basis of ion current fluctuations), and showed the self-similarity of both closed and open states independently of each other. Our results point to the necessity of performing a thorough analysis of the dynamics of a single channel, before creating models of the possible connection between microscopic dynamics of the channel protein and macroscopic biological phenomena such as transmembrane potential. Indeed, we show that the most important outcome of this study is to show the existence of dynamical correlation already in a single-channel, with two conducting states.
A Acknowledgments
We are grateful to Professor P.N.R. Usherwood and Dr I. Mellor from the University of Nottingham for providing us with the experimental data of ion current through a large conductance locust potassium channel. The authors are grateful to Prof. Karina Weron, Dr Szymon Mercik and Hilmar Spohr for discussions and careful reading of the manuscript.
Z. S. greatly acknowledges financial support from the Foundation for Polish Science; she was granted a one-year post-doc fellowship at the Gesellschaft für Schwerionenforschung in Darmstadt, Germany.
REFERENCES
- [1] B. Hille, Ionic Channels of Excitable Membranes, (MA: Sinauer Inc., Sunderland, 1992).
- [2] H. Schrempf, O. Schmidt, R. Kuemmerlen, S. Hinnah, D. Mueller, M. Betzler, T. Steinkamp, and R. Wagner, EMBO J. 14, 5170 (1995).
- [3] E. Neher and B. Sakmann, Nature 260, 799 (1976).
- [4] J. W. Mozrzymas, M. Martina, and F. Ruzzier, Eur. J. Physiol. 433, 413 (1997).
- [5] W. Gardiner, Handbook of stochastic methods (Springer, Berlin, 1990).
- [6] D. Petracchi, C. Ascoli, M. Barbi, S. Chillemi, M. Pellegrini, and M. Pellegrino, J. Stat. Phys. 70, 393 (1993).
- [7] J. Timmer and S. Klein, Phys. Rev. E 55, 3306 (1997).
- [8] A. Fuliński, Z. Grzywna, I. Mellor, Z. Siwy, and P. N. R. Usherwood, Phys. Rev. E 58, 919 (1998).
- [9] Z. Siwy, Sz. Mercik, K. Weron, and M. Ausloos, Physica A 297, 79 (2001).
- [10] M. Karplus and J. A. McCammon, Ann. Rev. Bioch. 53, 263 (1983).
- [11] L.S. Liebovitch, Biophys.J. 55, 373 (1989).
- [12] L.S. Liebovitch and T.I. Toth, J.Theor.Biol. 148, 243 (1989).
- [13] L.S. Liebovitch and A.T. Todorov, International Journal of Neural Systems 7, 321 (1996).
- [14] H. Salman, Y. Soen, and E. Braun, Phys. Rev. Lett. 77, 4458 (1996).
- [15] H. Salman and E. Braun, Phys.Rev.E, 56, 852 (1997).
- [16] E. Braun, Physica A 249, 64 (1998).
- [17] K. Hu, P. Ch. Ivanov, Z. Chen, P. Carpena, and H. E. Stanley, Phys. Rev.E, 64(1), 011114(19) (2001).
- [18] E. Gorczyńska, P. L. Huddie, B. A. Miller, I. R. Mellor, R. L. Ramsey, and P. N. R. Usherwood, Pflüges Arch. Ges. Physiol. Menschen Tiere 432, 597 (1996).
- [19] Sz. Mercik, K. Weron, and Z. Siwy, Phys. Rev. E 60, 7343 (1999).
- [20] M. Ausloos, N. Vandewalle, Ph. Boveroux, A. Minguet, and K. Ivanova, Physica A 274, 229 (1999).
- [21] N. Vandewalle and M. Ausloos, Physica A. 246, 454 (1997).
- [22] H. E. Stanley, S. V. Buldyrev, A. L. Goldberger, S. Havlin, C.-K. Peng, and M. Simmons, Physica A 200, 4 (1996).
- [23] Sz. Mercik and K. Weron, Phys.Rev.E 63, 051910 (2001).
- [24] J. W. Kantelhardt, E. Koscielny-Bunde, H. H. A. Rego, S. Havlin, and A. Bunde, Physica A 295, 441 (2001).
- [25] L. S. Liebovitch Fractals and Chaos Simplified for Life Sciences, (Oxford Uniersity Press, New York, 1998).
- [26] S. B. Lowen, L. S. Liebovitch, and J. A .White, Phys.Rev.E 59, 5970 (1999).
- [27] W. Feller, An Introduction to Probability Theory and Its Applications, 2nd edn. (Wiley, New York, 1971).
- [28] J. B. Bassingthwaighte, L. S. Liebovitch, and B. J. West, Fractal Physiology (University Press, Oxford, 1994).