Paramagnetic and antiferromagnetic resonances
in the diamagnetically
diluted Haldane magnet PbNi2V2O8
Abstract
The impurity-induced antiferromagnetic ordering of the doped Haldane magnet Pb(Ni1-xMgx)2V2O8 was studied by electron spin resonance (ESR) on ceramic samples in the frequency range 9-110 GHz. Below the Néel temperature a transformation of the ESR spectrum was found, indicating an antiferromagnetic resonance mode of spin precession. The excitation gap of the spin-wave spectrum increases with increasing Mg-concentration in the same manner as the Néel temperature, reaching its maximum value of 80 GHz at 0.04. At small concentrations 0.02 the signals of antiferromagnetic resonance were found to coexist with the signal of the paramagnetic resonance indicating a microscopic separation of the magnetic phases.
pacs:
75.50.Ee, 75.30.Hx, 76.50+g, 76.30-vI Introduction
One dimensional magnetic systems exhibit a variety of different collective quantum states which are of significant physical interest. The ground state and magnetic properties of integer and half-integer 1D-spin systems are quite different. The ground state of the spin chain with antiferromagnetic exchange is a singlet, and the excited triplet states are separated by an energy gap (so called Haldane gap).Haldane The uniform antiferromagnetic spin chain exhibits also a singlet ground state but a gapless spectrum of the triplet excitations. desCloizeaux Both and spin chains are disordered in the ground state: the average spin projection equals zero for all spins of the chain. Nevertheless, there is a difference in the magnetic correlation length which is infinite for the uniform chain and finite for the Haldane chains.
A spin-gap opens also in the spectrum of chains, if the chains are alternated, i.e. the intrachain-exchange integral takes in turn two values . The correlation length of an alternated chain becomes finite. The alternating of spin chains may occur due to the crystal structure as, e.g., in the 1D magnet (VO)2P2O7, VOPO or due to the spin-Peierls transition Pytte as, e.g., in CuGeO3. Hase The magnetic behavior of spin-gap systems is marked by a characteristic freezing out of the magnetic susceptibility at low temperatures .
The impurities embedded in a spin-gap magnet provide magnetic degrees of freedom on the singlet background and result in a contribution to the magnetic susceptibility at low temperatures. The analysis of spin-Peierls Fukuyama ; Khomskii and of Haldane Miyashita systems shows that breaking of spin chains locally destroys the singlet state, and multi-spin clusters with a local staggered magnetization (nonzero ) occur in the vicinity of impurity atoms, on both sides of the diamagnetic impurity. The staggered magnetization decays exponentially with the distance apart from the impurity atom, thus the cluster includes spins placed on the chain part of the length of about of on one side of the impurity. These clusters have a net spin and a net magnetic moment. For a broken dimerized chain the net spin value of a cluster is obviously 1/2. An intriguing suggestion was made for spin chains stating that spin vacancies should result in effective degrees of freedom at the ends of the long chain segments s_one_half . ESR experiments confirmed the multi-spin nature of the magnetic defects created by impurities in the spin-Peierls magnet CuGeO3. Glazkov ; Glazkov2 The indications of degrees of freedom were found in ESR spectra of the doped Haldane system NENP s_one_half ; Clarum and for defects in the Haldane magnet Y2BaNiO5, Kimura while the effective spins were questioned in Ref. Ramirez, on the base of specific-heat measurements. A discussion of the problem may be found in Ref. Batista, ; Batista2, and in the review article Ref. Katsumata, .
Another interesting effect associated with defects in spin-gap systems is impurity-induced magnetic ordering. Doping of the spin-Peierls compound CuGeO3 with both magnetic and nonmagnetic impurities and the resulting antiferromagnetic ordering was extensively studied (see, e.g., Refs. Regnault, ; Renard, ; Grenier, ; Masuda, ; Glazkov3, ), while a spin-vacancy induced magnetic ordering in a Haldane magnet was only recently reported Uchiyama for PbNi2V2O8. The phenomenon of impurity-induced antiferromagnetic ordering in a spin-Peierls magnet was explained by the overlap of the wings of the soliton-like clusters of the staggered magnetization and the interchain exchange. Fukuyama ; Khomskii For Haldane systems an impurity-induced ordering was predicted taking into account the restoring of antiferromagnetic correlations by impurities. ShenderKivelson Both approaches have the same physical reason: the staggered magnetization is restored over a number of spins near the defect. The evolution from the isolated spin clusters to the long-range ordered system was followed by observations of ESR signals for the doped spin-Peierls magnet CuGeO3. Glazkov ; Glazkov2 ; Glazkov3 The gap in the spin-wave spectrum and other characteristics of the impurity-stimulated antiferromagnetic phase were derived from the spectrum of the antiferromagnetic resonance (AFMR). Glazkov ; Hase2 ; Smirnov ; Nojiri
The goal of the present work is an ESR study of defects and a search for the AFMR signals in the doped Haldane magnet PbNi2V2O8. The diamagnetic dilution is performed following Ref. Uchiyama, via the substitution of a small part of Ni2+ ions by Mg2+ ions. As a result we observed ESR signals from magnetic defects created by spin vacancies. Above the Néel point the ESR spectrum corresponds to the respective degrees of freedom. At the Néel point the ESR spectrum observed for high concentration of impurities exhibits a transformation to an antiferromagnetic resonance spectrum of a uniaxial antiferromagnet. At low concentrations () we observe the coexistence of paramagnetic and antiferromagnetic resonance. We believe that this coexistence reveals the microscopic separation of antiferromagnetic and paramagnetic phases as in the case of the spin-Peierls system CuGeO3.Glazkov3
II Samples and experimental details
Solid solutions of Pb(Ni1-xMgx)2V2O8 with were prepared by means of ceramic technology using oxides PbO, NiO, MgO and V2O5 of high purity as starting chemical reagents. Annealing was performed at 1050 K in air. At higher temperatures an incongruent melting of PbNi2V2O8 occurs. Single-phase samples were produced by treating the initial mixture at high temperatures for 800 hours with several intermediate grindings and pressings. The sample composition was controlled by x-ray diffraction using the Dmax IIIC diffractometer of Rigaku. According to the x-ray diffraction data, the single-phase samples have tetragonal structure of space group I41cd and are isostructural with SrNi2V2O8. The cell parameters of the pure compound are in accordance with those observed in Ref. Uchiyama, . Partial substitution of Ni by Mg results in a compression of the elementary cell with increasing Mg concentration. The change of the unit-cell parameters with doping is presented in the Table 1.
| , Å | , Å | , Å3 | |
|---|---|---|---|
| 0 | 12.251(3) | 8.353(4) | 1253.6(4) |
| 0.01 | 12.244(2) | 8.349(3) | 1251.8(3) |
| 0.02 | 12.230(3) | 8.341(3) | 1247.7(4) |
| 0.04 | 12.228(3) | 8.321(3) | 1241.9(8) |
| 0.06 | 12.205(3) | 8.315(3) | 1238.5(4) |
The molar concentration of impurity phases is estimated to be less than 1%.
The temperature dependences of the susceptibility were measured with a SQUID magnetometer (Quantum Design) in the range 1.8 – 400 K. The ESR spectra were measured in a spectrometer with a set of transmission-type resonators covering the range from 18 to 110 GHz and for temperatures 1.3 – 30 K. Magnetic resonance absorption lines were recorded as a function of the transmitted microwave power on the applied magnetic field. The reduction of the transmitted signal is proportional to the microwave power absorbed by the sample. In addition X-band (9.5 GHz) measurements were performed with a Bruker ELEXSYS E500 CW spectrometer.
III Experimental results
The temperature dependence of the susceptibility for several samples is shown in the Fig. 1. The susceptibility of the pure () compound exhibits a broad maximum at K and decreases with decreasing temperature. At K the susceptibility reveals a minimum and than shows a Curie-like increase due to defects. Below 10 K the total susceptibility of the nominally pure sample can be accounted for one percent of free Ni-ions.
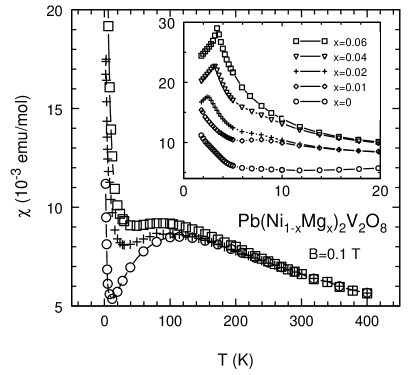
Doping with Mg results in an increase of the susceptibility which is proportional to the concentration of impurities . For one-percent doping the susceptibility at K amounts about two times the susceptibility of the pure sample. For the samples with the concentration 0.02, 0.04 and 0.06 we additionally observed kinks in the susceptibility curves indicating the Néel transition temperature in a good accordance with Ref.Uchiyama, . Some of the samples demonstrate a nonmonotoneous contribution to the susceptibility with a week smeared-out anomaly close to 8 K. A corresponding anomaly is observed in the temperature dependence of the microwave absorption (see below at the end of the Section), but is suppressed in magnetic fields larger than 0.2 T. The magnitude of this anomaly depends on the number of intermediate grindings and annealings and probably is due to onset of superconductivity within a parasitic plumbous phase.
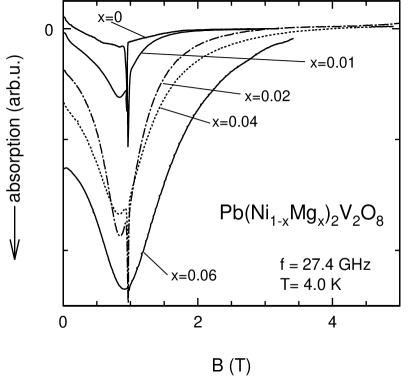
The ESR lines at K (this temperature is above TN for all samples) are plotted in Fig. 2. The relatively weak ESR signal in the nominally pure sample exhibits a complicated structure consisting of more than four spectral components. In doped samples in the paramagnetic state the ESR absorption is much more intensive and its spectrum consists of a single line at the position corresponding to a -factor of 2.2 in the frequency range 9 – 110 GHz.
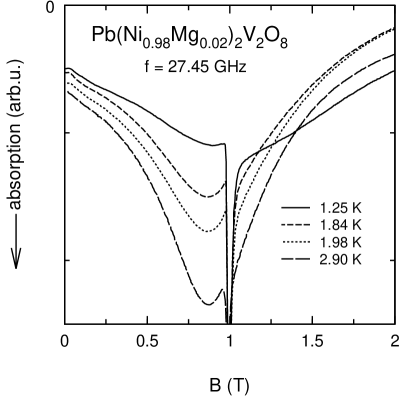
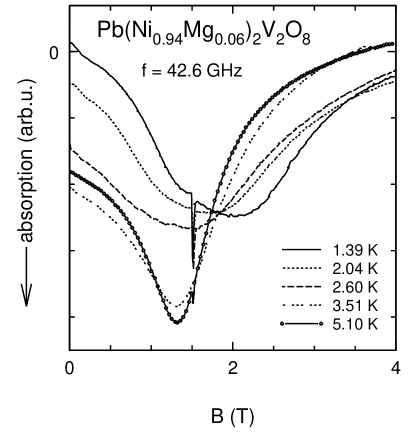
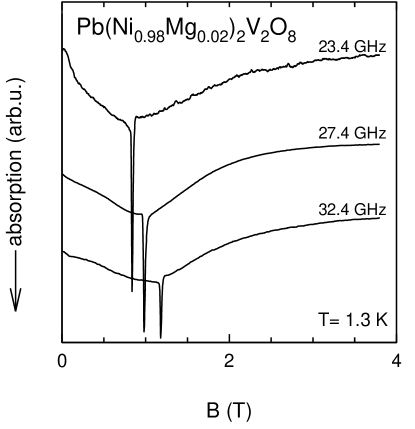
The temperature evolution of the ESR spectra of samples with different doping concentrations is shown in Figs. 3 and 4. One can see that below T ( is 2.4 K at 0.02 and K at 0.06) a transformation of the spectral density occurs: the maximum of the microwave absorption shifts to higher fields with respect to the resonance field of the paramagnetic phase. The ESR line transforms into a broad band of absorption. The transition temperature for is on the edge of the temperature range of the susceptibility measurements and was determined as 1.8 K from the appearance of ESR-line distortion and from the microwave anomaly in zero field described below. The transformation of the ESR line at is accompanied by a strong reduction of the absorption at the field of the paramagnetic resonance for and , while for and the absorption in this field remains comparable with that in the paramagnetic phase. With increasing frequency the band of absorption becomes wider as documented in Figs. 5 and 6. Although at and the local maximum of the ESR absorption remains at the paramagnetic position (see Fig. 3), nevertheless, at the line-shape changes from a Lorentzian to a line with additional absorption in the wings. As documented in Fig. 5, there is an enlarged absorption on the right wing of the ESR line at the lower frequencies of 23.4 GHz and 27.4 GHz and an enlarged absorption on both wings for the higher frequency of 32.4 GHz.
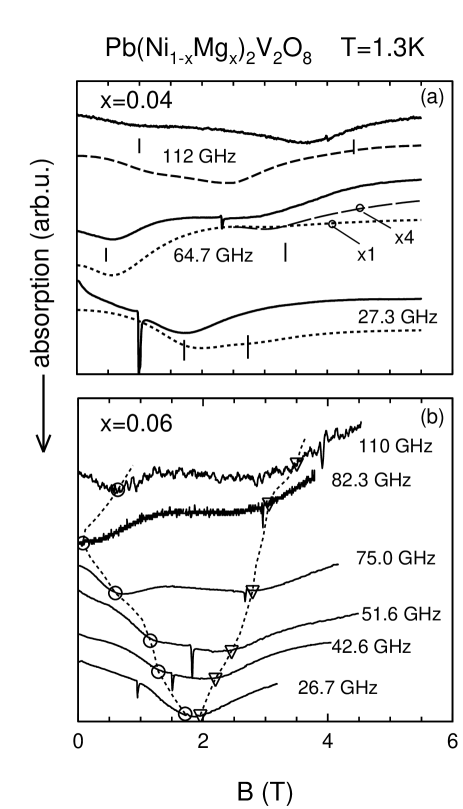
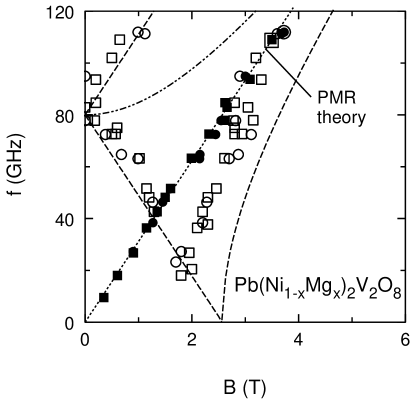
For the 0.04 and 0.06 samples the boundaries of the absorption band become clearly visible (see Figs. 6, panels (a) and (b) respectively). They were determined from the field values at the left and right edges of the band, where the absorption stops to grow or begins to diminish, respectively. These boundaries are marked in Fig. 6 (b) by circles and triangles connected with dashed lines. The frequency-field dependences of the left and right boundaries of the absorption are plotted in Fig. 7 along with the frequency-field dependence of the ESR in the paramagnetic phase at 4 K. The absorption-band edges for and exhibit a pattern typical for a powder of an antiferromagnet (see, e.g. Ref. Smirnov2, ) revealing an antiferromagnetic resonance gap of 80 GHz.
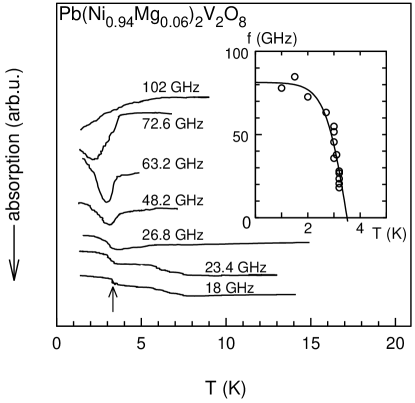
The AFMR gap should be temperature dependent being zero at and reaching its maximum value at . This fact enables the observation of the antiferromagnetic resonance in zero field by recording the microwave absorption vs. temperature. The temperature dependences of the transmitted microwave power at different frequencies are shown in Fig. 8 for . The inset of Fig. 8 shows the dependence of the zero-field resonance frequency on temperature determined from the maximum absorption at each frequency. The extrapolation of this frequency to zero temperature allows one to obtain the AFMR gap at . The abrupt change, which is visible in the temperature dependence of the microwave absorption at low frequencies , marks the Néel temperature (see the arrow on Fig. 8). The values of obtained by this method are in a good agreement with the results of dc-susceptibility for all concentrations.
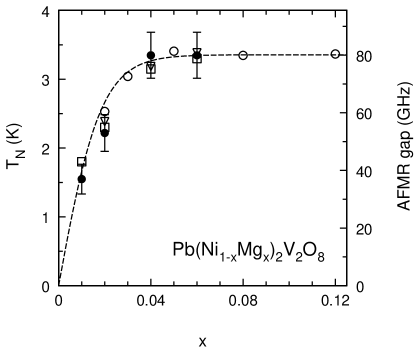
The values of the Néel temperatures and antiferromagnetic resonance gaps for samples with different are shown in Fig. 9. Both values increase approximately linear for and saturate above 0.04
IV Discussion
IV.1 Residual and substitutional defects
In our investigation we observed that the substitution of Ni- with Mg-ions strongly changes the magnetic susceptibility and the ESR spectra of PbNi2V2O8. The influence of inevitable impurity phases can be estimated from the residual low-temperature susceptibility which should tend to zero in a perfect Haldane magnet. The low-temperature susceptibility provided by these phases equals in magnitude the susceptibility due to one-percent Mg-doping and is definitely smaller than the susceptibility of the higher doped samples.
The integrated ESR intensity is a measure of the spin susceptibility in the paramagnetic state. The ESR signal of residual impurities observed in the nominally pure sample at low temperatures is two times smaller than the intensity which results from doping with 1% Mg. Thus the spin susceptibility provided by Mg doping prevails over the spin susceptibility of impurity phases.
The weak ESR signal of the residual defects has a complicated spectrum with four lines which are resolved at 1.4 K and which are smeared into one very broad line at 25 K. Analogous to Ref. Kimura, we ascribe this signal presumably to the Ni3+-ions appearing due to oxygen nonstoichiometry.
IV.2 Paramagnetic resonance
At 4 K the paramagnetic resonance frequency of all doped samples is proportional to the magnetic field for frequencies 9 GHz 110 GHz, as shown on Fig. 7 for concentrations and . We do not observe a zero-field ESR splitting which is usually expected for spin in a crystal field and which is absent for spin . From the data shown on Fig. 7 we derive an upper limit for the zero-field splitting of 0.5 GHz. The absence of a zero-field ESR splitting strongly confirms that the Mg-doping provides effective 1/2 degrees of freedom. The expected value of the zero-field splitting for the single Ni2+-ion is determined by the crystal-field parameter of the spin-Hamiltonian single-ion anisotropy term . For PbNi2V2O8 the value of was derived from the spectrum of spin excitations: meV Uchiyama and meV. Zheludev The discrepancy between these two values is due to different models of the magnetic interactions used for the data analysis. Even the smaller value should result in a zero-field splitting of the spin resonance mode of about 50 GHz. For the case of the ceramic sample it would result in a wide band of absorption which is not compatible with the observed resonance lines shown in Fig. 2. The effect of the single-ion anisotropy on the energy spectrum of the end of the Haldane chain was analyzed in Ref. Batista2, , were it was shown that the -term does not affect the central peak frequency of the ESR spectrum of long spin chain segments, and thus the spectrum is consistent with the concept of the effective spin . Our observations confirm this conclusion.
The samples of PbNi2V2O8 allow a relatively high extent of doping in comparison with other Haldane magnets (see, e.g. Refs. s_one_half, ; Batista2, ). This relatively high concentration of dopants enables to detect the interaction between defects by a comparison of the linewidth at different . From the ESR lines displayed on Fig. 2 we see that the linewidth at 0.02 is about 0.5 T larger than at 0.01. This huge increase cannot be ascribed to dipole-dipole interaction or to exchange interaction of neighboring spins at these concentration values. Taking into account the multi-spin nature of the magnetic defects we can explain this increase as follows. The staggered magnetization exists on the chain areas with the length of about at the ends of the chain segments. At small concentrations the portion of spin-chain segments which are shorter than equals approximately (here is measured in interspin distances). Thus at the reasonable value of 10 a significant portion of chain segments (about 0.4 at 0.02) should contain strongly interacting clusters, touching each other. This interaction may cause the broadening of the ESR line because the exchange interaction along with the single-ion anisotropy results in an effective anisotropic exchange giving rise to the line broadening.
IV.3 Antiferromagnetic resonance
By cooling through the Néel temperature we observed a significant transformation of the ESR spectra. The conversion of a single ESR line into a band of absorption in ceramic samples may be explained by the opening of an energy gap in the antiferromagnetic resonance spectrum and by the dependence of the AFMR frequency on the orientation of the magnetic field. The observation of the ”temperature resonance” by scanning the temperature confirms the opening of the AFMR gap at .
The antiferromagnetic spin structure on the tetragonal lattice should be of uniaxial anisotropy, therefore we fitted the boundaries of the absorption bands (Fig. 7) by the formulae for AFMR frequencies of a uniaxial antiferromagnet: AFMR
a) easy axis, :
| (1) |
b) easy axis, :
| (2) | |||
c) easy axis:
| (3) | |||
Here . For intermediate orientations the resonance frequencies lie between the values given by Eqns. (1-3). Thus, the magnetic fields determined by these formulae represent the boundaries of the absorption bands of the powder sample at a given frequency. The boundaries calculated in this way are shown in Fig. 7 along with the boundaries derived from the observed absorption for the samples with and .
The resonance frequencies for an arbitrary orientation of the magnetic field can also be calculated.AFMR We modeled the field dependence of the absorption of a ceramic sample by integration of the absorption over all orientations of the crystallites, taking into account the finite ESR linewidth and orientational dependence of AFMR frequencies and neglecting the dependence of the ESR susceptibility of both AFMR modes on the orientation of the vector of antiferromagnetism with respect to the magnetic microwave field. This neglecting may result in a loss of a nonresonant but field-dependent factor. The results of this calculation are plotted on Fig. 6(a) along with the experimental curves. The modeling at finite linewidths shows the smeared boundaries of the absorption bands near the field values calculated by Eqns. (1-3) which indicate boundaries of bands in the limit of narrow AFMR modes. These zero-width boundaries are marked on Fig. 6(a) by vertical segments.
We find qualitative agreement between the experimental results and the calculated AFMR frequencies plotted on Fig. 7 and between experimental and modeled absorption curves on Fig. 6. The comparison of modeled and experimental spectra allows us to estimate the AFMR linewidth as approximately 20 GHz. Due to this large linewidth the observed AFMR absorption deviates from the absorption of the usual antiferromagnetic powder, Smirnov2 for which the boundaries of absorption were observed as sharp anomalies at the limiting positions calculated from formulae like given above.
IV.4 Coexistence of two ESR modes in low-doped samples
The ESR spectra of the low-doped samples with and do not allow to obtain the frequency-field diagram of the boundaries of the absorption band, because the paramagnetic resonance line dominates within the complete frequency range. The absorption curve looks like a broad resonance line rather than an absorption band. Nevertheless the gap values can be determined from the absorption vs. temperature dependencies in the zero field. The observed absorption at the paramagnetic resonance field is definitely different from the AFMR absorption, because at the AFMR gap of 51 GHz the AFMR field for the 18 GHz measurement should be 1.9 T and not at 0.6 T as observed. In addition the field of the maximum of absorption is proportional to the frequency (see Fig. 5). This proportionality distinctly distinguishes the paramagnetic resonance mode from the AFMR mode. The presence of a paramagnetic resonance line of sufficient intensity (see Fig. 5) is not due to an inhomogeneity of the impurity concentration. An inhomogeneous impurity concentration should smear the Néel point and result in macroscopic antiferromagnetic and paramagnetic parts of the sample. Our susceptibility curves demonstrate a well defined antiferromagnetic transition with a width less than 0.2 K, whereas we observe a paramagnetic ESR line at K.
This coexistence of paramagnetic and antiferromagnetic resonance modes is related to the recent observation of a coexistence of these modes in the impurity-stimulated antiferromagnetic phase of the spin-Peierls magnet CuGeO3.Glazkov3 ; Smirnov Unfortunately in the present work we cannot distinguish between the AFMR and paramagnetic modes so clearly as in the case of single crystals of doped CuGeO3 with narrow ESR lines. The coexistence of these two kinds of resonance signals was explained in Ref. Glazkov3, taking into account the random distribution of the impurities and a respective dispersion of the length of spin-chain segments. As a result, there are relatively large antiferromagnetic areas, formed by coupled clusters, and isolated spin clusters, separated from each other by the nonmagnetic spin-gap phase. The isolated spin clusters (described in the Introduction) provide a paramagnetic resonance signal due to their net magnetic moment, while larger antiferromagnetic areas give rise to AFMR signals. This scenario of the microscopic phase separation may be derived also from the numerically simulated 2D pattern of the stimulated staggered magnetization at obtained both for spin-Peierls and Haldane magnets with an interchain interaction in Ref. Yasuda, . There are peaks of staggered magnetization around impurities and areas of a much lower order parameter between them. Assuming naturally that at finite temperature the areas of low order parameter will be disordered, we arrive at a pattern of islands of different sizes with local antiferromagnetic order.
IV.5 The average spin and the Néel temperature of the impurity induced order
The concentration-dependences of the AFMR gap and the Néel temperature are similar in the investigated range of concentrations. They are approximately linear at small and saturate at . The linear increase of the AFMR gap and of the Néel temperature at low may be explained using the concept of ”magnetic molecules” ShenderKivelson appearing near impurities. According to this consideration we take a cluster with the staggered magnetization appearing near an impurity as a ”magnetic molecule” with the number of spins of the order of the correlation length . The module of the spin projection averaged over the sample is estimated as follows:
| (4) |
The linear -dependence of at the diamagnetic dilution was also confirmed by the Monte-Carlo simulation. Yasuda
Further, analyzing the interaction of the magnetic molecules via the interchain exchange the following estimation for the Curie-Weiss-constant was found in the low concentration limit: ShenderKivelson
| (5) |
This estimate agrees well with the observed linear dependence of the Néel temperature on the concentration. In the molecular-field approximation the AFMR gap is determined by the expression
| (6) |
Here is the intrachain exchange. From Eq. (6), using the measured value of GHz and the values of (see above) and 9 meV determined in Ref. Uchiyama, , we estimate 0.06 for . The observed linear concentration dependence of the AFMR gap is in accordance with Eqs. (4) and (6). With the use of the measured value of , and of relation (5) we estimate , (here meV has been taken from Ref. Uchiyama, ). This evaluation of the correlation length is in accordance with the value taken above for the analysis of the dependence of the paramagnetic resonance linewidth on concentration and with the correlation length of the unperturbed Haldane chain which is known to be approximately 7 interspin distances. Miyashita
V Conclusion
We identified the defects created in the Haldane magnet PbNi2V2O8 via the diamagnetic dilution by means of ESR. The absence of a zero-field splitting in the paramagnetic spectra confirms the effective degrees of freedom created by breaking spin chains. Antiferromagnetic resonance modes were found for different doping concentrations below the ordering temperatures. The dependence of the antiferromagnetic resonance gap on the impurity concentration is similar to that of the Néel temperature. At low doping concentration the coexistence of paramagnetic and antiferromagnetic resonance modes was found. It is interpreted as a microscopic phase separation of the magnetic phases at the Néel point analogous to the phase separation in the doped spin-Peierls magnet.Glazkov3 The correlation length is estimated to be about 10 interspin distances. At low doping the Néel temperature and the antiferronagnetic resonance gap were found to be proportional to the concentration of the impurities in accordance with the molecular-field theory.
Acknowledgements.
We kindly acknowledge D. Vieweg for SQUID measurements. The work was supported by the Russian Foundation for Basic Research (RFBR), grant No.00-02-17317, by joined grant of RFBR and Deutsche Forschungs Gemeinschaft (DFG), by the INTAS project No. 99-0155, by Award No. RP1-2097 of the U.S. Civilian Research and Development Foundation for the Independent States of the former Soviet union (CRDF), by Bundesministerium für Bildung und Forschung under contract No. 13N6917(EKM), and DFG via Sonderforschungsbereich 484.References
- (1) F. D. M. Haldane, Phys. Rev. Lett.50, 1153 (1983).
- (2) J. des Cloizeaux and J. J. Pearson, Phys. Rev. 128, 2131 (1962).
- (3) A. W. Garrett, S. E. Nagler, D. A. Tennant, B. C. Sales and T. Barnes, Phys. Rev. Lett. 79, 745 (1997).
- (4) E. Pytte, Phys. Rev. B 10, 4637 (1974).
- (5) M. Hase, I. Terasaki and K. Uchinokura, Phys. Rev. Lett. 70, 3651 (1993).
- (6) H. Fukuyama, T. Tanimoto and M. Saito, J. Phys. Soc. Jpn. 65, 1182 (1996).
- (7) D. Khomskii, W. Geertsma and M. Mostovoy, Czech. J. Phys.46 S6, 3239 (1996).
- (8) S. Miyashita and S. Yamamoto, Phys. Rev. B 48, 913 (1993).
- (9) M. Hagiwara, K. Katsumata, I. Affleck, B. I. Halperin and J. P. Renard, Phys. Rev. Lett. 65, 3181 (1990).
- (10) V. N. Glazkov, A. I. Smirnov, O. A. Petrenko, D. McK. Paul, A. G. Vetkin, and R. M. Eremina, J. Phys.: Condens. Matter 10, 7879 (1998).
- (11) V. N. Glazkov, A. I. Smirnov, G. Dhalenne and A. Revcolevschi, Zh. Eksp. Teor. Fiz 120, 164 (2001) [JETP 93, 143 (2001)].
- (12) S. H. Glarum, S. Geschwind, K. M. Lee, M. L. Kaplan and J. Michel, Phys. Rev. Lett. 67, 1614 (1991).
- (13) S. Kimura, H. Ohta, M. Motokawa, T. Yokoo and J. Akimitsu, J. Phys. Soc. Jpn. 67, 2514 (1998).
- (14) A. P. Ramirez, S. -W. Cheong and M. L. Kaplan, Phys. Rev. Lett. 72, 3108 (1994).
- (15) C. D. Batista, K. Hallberg and A. A. Aligia, Phys. Rev. B 58, 9248 (1998).
- (16) C. D. Batista, K. Hallberg and A. A. Aligia, Phys. Rev. B 60, R12553 (1999).
- (17) K. Katsumata, J. Phys.: Condens. Matter 12, R589 (2000).
- (18) L. P. Regnault, J. P. Renard, G. Dhalenne and A. Revcolevschi, Europhys. Lett. 32, 579 (1995).
- (19) J.-P. Renard, K. Le Dang, P. Veillet, G. Dhalenne, A. Revcolevschi and L.-P. Regnault, Europhys. Lett. 30, 475 (1995).
- (20) B. Grenier, J.-P. Renard, P. Veillet, C. Paulsen, G. Dhalenne and A. Revcolevschi, Phys. Rev. B. 58 8202 (1998).
- (21) T. Masuda, A. Fujioka, Y. Uchiyama, I. Tsukada and K. Uchinokura, Phys. Rev. Letters 80, 4566 (1998).
- (22) V. N. Glazkov, A. I. Smirnov, K. Uchinokura and T. Masuda, preprint cond-mat/0105246.
- (23) Y. Uchiyama, Y. Sasago, I. Tsukada, K. Uchinokura, A. Zheludev, T. Hayashi, N. Miura, P. Böni, Phys. Rev. Lett . 83, 632 (1999).
- (24) E. F. Shender and S. A. Kivelson, Phys. Rev. Lett. 66, 2384 (1991).
- (25) M. Hase, M. Hagiwara and K. Katsumata, Phys. Rev. B 54, R3722 (1996).
- (26) A. I. Smirnov, V. N. Glazkov, A. N. Vasil’ev, L. I. Leonyuk, S. M. Coad, D. McK. Paul, G. Dhalenne and A. Revcolevschi, Pisma Zh. Eksp. Teor. Fiz. 64, 277 (1996) [ JETP Lett. 64, 305 (1996)].
- (27) H. Nojiri, T. Hamamoto, Z. J. Wang, S. Mitsudo, M. Motokawa, S. Kimura, H. Ohta, A. Ogiwara, O. Fujita and J. Akimitsu, J.Phys.: Condens. Matter 9, 1331 (1997.)
- (28) A. N. Vasil’ev, L. A. Ponomarenko, A. I. Smirnov, E.V.Antipov, Yu. A. Velikodny, M. Isobe and Y. Ueda, Phys. Rev. B 60, 3021 (1999).
- (29) A. Zheludev, T. Masuda, I. Tsukada, Y. Uchiyama, K. Uchinokura, P. Böni and S.-H. Lee, Phys. Rev. B 62, 8921 (2000).
- (30) T. Nagamiya, K. Yosida and R. Kubo, Adv. Phys. 4, 1 (1955); S.Foner in: Magnetism ed.G.T.Rado and H.Suhl, NY Academic Press 1963 v.1.
- (31) C. Yasuda, S. Todo, M. Matsumoto and H. Takayama, Phys. Rev. B 64, 092405 (2001).