Decoupled CuO2 and RuO2 layers in superconducting and magnetically ordered RuSr2GdCu2O8
Abstract
Comprehensive measurements of dc and ac susceptibility, dc resistance, magnetoresistance, Hall resistivity, and microwave absorption and dispersion in fields up to 8 T have been carried out on RuSr2GdCu2O8 with the aim to establish the properties of RuO2 and CuO2 planes. At 130 K, where the magnetic order develops in the RuO2 planes, one observes a change in the slope of dc resistance, change in the sign of magnetoresistance, and the appearance of an extraordinary Hall effect. These features indicate that the RuO2 planes are conducting. A detailed analysis of the ac susceptibility and microwave data on both, ceramic and powder samples show that the penetration depth remains frequency dependent and larger than the London penetration depth even at low temperatures. We conclude that the conductivity in the RuO2 planes remains normal even when superconducting order is developed in the CuO2 planes below 45 K. Thus, experimental evidence is provided in support of theoretical models which base the coexistence of superconductivity and magnetic order on decoupled CuO2 and RuO2 planes.
pacs:
74.72.-h 74.25.Nf 74.25.FyI Introduction
The coexistence of superconductivity and magnetic order has placed the ruthenium cuprates in the focus of considerable work recently. Felner:97 ; Bernhard:99 ; McLaughlin:99 ; Tallon:00 ; Pickett:99 ; Chmaissem:00 ; Lynn:00 ; Fainstein:99 ; Williams:00 ; Pozek:01 ; Kumagai:01 ; Tokunaga:01 These superconductors were originally synthesized by Bauernfeind et al.. Bauernfeind:95 ; Bauernfeind:96 Most recent reports have focused on RuSr2RCu2O8 where R=Gd or Eu. Its crystal structure can be viewed as similar to that of the YBa2Cu3O7 where the one dimensional (1D) CuO chains are replaced by two dimensional (2D) RuO2 layers. Within this picture, it comes as no surprise that superconductivity may occur when the CuO2 layers are properly doped, in analogy to other cuprate superconductors. Recent X-ray absorption near edge structure (XANES)RSLiu:01 and nuclear magnetic resonance (NMR) studies of RuSr2RCu2O8 Kumagai:01 ; Tokunaga:01 revealed that ruthenium occurs in a mixed valence state as Ru4+ and Ru5+ with almost equal concentration. Thus, from the point of view of superconductivity, the role of RuO2 planes is to act as the charge reservoir which is necessary to dope the superconducting CuO2 planes.
One can interpret the crystal structure of RuSr2RCu2O8 as CuO2 layers which are connected by perovskite ruthenate SrRuO3 via the apical oxygen atoms. Chen:01 From this perspective, it comes as no surprise that magnetic ordering may occur in RuSr2RCu2O8, as in most ruthenates of the Ruddlesden-Popper series Srn+1RunO3n+1.Ruddlesden:58 The most three dimensional member of the series is pseudocubic SrRuO3 (=), which ferromagnetically orders at =165 K.Randall:59 ; Kanbayashi:78 . The =3 member Sr4Ru3O10 is orthorhombic and becomes ferromagnetic below =148 K.Cao:97 The effective dimensionality is drastically lowered in the =2 member Sr3Ru2O7. It shows magnetic correlations dominated by ferromagnetic instability above =17 K, and develops a canted antiferromagnetic instability below . Ikeda:00 ; Liu:01 The 2D member Sr2RuO4 (=1) does not order magnetically, and becomes superconducting at very low temperatures.Maeno:94
The crystal structure of RuSr2RCu2O8 has an additional complexity when compared to YBa2Cu3O7. The RuO6 octahedra in RuSr2RCu2O8 are coherently rotated around the c-axis with domains extending up to 20 nm in diameter.McLaughlin:99 Rotations of the RuO6 octahedra are common in the ruthenates and it is believed that the different magnetic order is due to structurally induced changes in the band structure. The rotation of the RuO6 octahedra was observed in Sr3Ru2O7,Huang:98 which shows competing, nearly degenerate magnetic instabilities.Ikeda:00 ; Perry:01 The importance of the rotation of the RuO6 octahedra is best seen in Ca2-xSrxRuO4,Nakatsuji:00 which is the =1 member of the Ruddlesden-Popper series with Ca substitution for Sr. Since Ca2+ is smaller than Sr2+, the substitution brings about a structural distortion in which the RuO6 octahedra are rotated and flattened along the interlayer direction.Friedt:01 By varying the degree of the substitution, one obtains an intriguing phase diagram from paramagnetic metal to antiferromagnetic insulator. For some intermediate degrees of the substitution, one obtains a metallic system which shows an incomplete magnetic ordering at temperatures below , and metamagnetic behavior similar to that observed in the =2 member Sr3Ru2O7. Hence, it is not surprising that the reported studies of the magnetic structure in RuSr2RCu2O8 have shown some ambiguity. In some of the measurements of the zero field cooled (ZFC) dc susceptibility a clear ferromagnetic transition was observed,Kumagai:01 while in others a cusp-like signal characteristic of an antiferromagnetic transition was detected.Bernhard:99 ; Tallon:00 ; Williams:00 In all cases, though, there was a deviation of field cooled (FC) curves from ZFC ones, which proved the presence of a ferromagnetic component. Microscopic techniques could not resolve this ambiguity, either. For example, zero-field muon spin rotation study reported ferromagnetic order with the spontaneous magnetization in the ab plane.Bernhard:99 In contrast, neutron diffraction studies found evidence of antiferromagnetic order with the Ru moments aligned along the c axis.Lynn:00 ; Jorgensen:01 ; Takagiwa:01 The small ferromagnetic component was presumed to be produced by spin canting from the c axis. A recent magnetization study showed that the ferromagnetic component grows at higher fields.Williams:00 This provides evidence of a field induced transition which was attributed to a spin-flop transition. Similar field induced changes are observed in Sr3Ru2O7 and some partially substituted Ca2-xSrxRuO4 samples with distorted RuO6 octahedra. One should note, however, that the type of the magnetic order need not be simply related to the distortions of the RuO6 octahedra. For example, it was found that the other interesting ruthenate cuprate RuSr2R2-xCexCu2O10+δ has the same distortion of the RuO6 octahedra, as well as the same Ru-O-Ru and Ru-O-Cu bond lengths, found in RuSr2RCu2O8.Williams:02 Yet, RuSr2R2-xCexCu2O10+δ is ferromagnetic while RuSr2RCu2O8 is antiferromagnetically ordered at low fields.
A number of studies on RuSr2RCu2O8 have concluded that the RuO2 layers are insulating and the transport properties are dominated by the CuO2 layers. As mentioned above, it has also been concluded from a XANES study and NMR studies that Ru in the RuO2 layers shows a mixed Ru valence, which has not been reported in other ruthenate compounds. This could also be understood within the model of insulating RuO2 layers. However, the magnetoresistance above the magnetic ordering temperature has a dependence on magnetic field that is not observed in the high temperature superconducting cuprates (HTSC), McCrone:99 and clearly indicates that the transport process involves coupling to the Ru spins either from a conducting RuO2 layer or via coupling between the CuO2 layers and the spins in the RuO2 layers.
In the present paper, we address the question of the coexistence of superconductivity and magnetic order in RuSr2GdCu2O8. The question is reduced to the role played by CuO2 and RuO2 planes and their mutual couplings. We report our measurements of dc and ac susceptibility, dc resistance, magnetoresistance, Hall effect, and microwave absorption in RuSr2GdCu2O8. The measurements have been done on the same sample prepared as sintered ceramic and powder diluted in epoxy resin. This facilitates the distinction between intergranular and intrinsic intragranular properties. We find evidence that RuSr2GdCu2O8, as prepared in this study, has magnetic structure similar to Sr3Ru2O7, and partially substituted Ca2-xSrxRuO4, which have no CuO2 planes. Our results also show that the RuO2 planes are conducting, but do not become superconducting. In other words, our observations are consistent with the picture in which the charge carriers in the CuO2 and RuO2 planes are decoupled.
II Experimental Details
The RuSr2GdCu2O8 ceramic samples were prepared from a stoichiometric mix of RuO2, SrCO3, Gd2O3 and CuO2. The powder was calcined in air at 960∘C for 10 hours and then pressed into pellets, which were sintered at 1010∘C for 10 hours to obtain the Sr2GdCuO6 and CuO2 precursors. This process has been shown to prevent the formation of the SrRuO3 impurity phase. The compound was then sintered at 1050∘C in O2 gas for 10 hours, 1055∘C in O2 gas for 10 hours, 1060∘C in O2 gas for 10 hours and finally 1060∘C in O2 gas for 7 days. The sample was reground after each sintering step. The final processing has been shown to result in good quality samples where the transition into the bulk diamagnetic phase occurs for temperatures of up to 35 K.
It has been shown in our recent study on RuSr2EuCu2O8Pozek:01 that the electronic transport at low temperatures in the normal and superconducting states can be dominated by intergranular processes. This has the effect of masking the intrinsic intragranular properties. For this reason, part of the sample was ground into a fine powder and then embedded in an epoxy resin. Unfortunately, it has been found that it is not possible to align the ruthenate cuprates and hence we did not attempt to cure the resin in a magnetic field.
Resistivity, magnetoresistance and Hall effect measurements were done in the standard six-contact configuration using the rotational sample holder and the conventional ac technique (22 Hz, 1 mA), in magnetic fields up to 8 T. Temperature sweeps for the resistivity measurements were performed with carbon-glass and platinum thermometers, while magnetic field dependent sweeps were done at constant temperatures where the temperature was controlled with a capacitance thermometer.
The samples were characterized by both, dc and ac magnetization measurements using a SQUID magnetometer. The temperature dependent dc magnetization measurements were made in an applied magnetic field of 5 mT, while the ac susceptibility was measured in zero dc field with an ac field of 5 T and a frequency of 1 kHz.
The microwave measurements were made in an elliptical eTE111 copper cavity operating at 9.3 GHz. For the purpose of the present study it is essential to have a system with high stability so that very small changes of the -factor can be reproducibly measured over long time scales. Therefore, the body of the microwave cavity was kept at liquid helium temperature. The unloaded cavity had a -factor of about 25 000. The sample was mounted on a sapphire sample holder and positioned in the cavity center where the microwave electric field has maximum. The temperature of the sample could be varied from liquid helium to room temperature. The cryostat with the microwave cavity was placed in a superconducting magnet so that the sample could be exposed to a dc magnetic field of up to 8 T. The changes in the properties of the sample caused by either temperature variation or magnetic field were detected by a corresponding change in the -factor of the cavity and a resonant frequency shift. The quantity represents the total losses of the cavity and the sample. The experimental uncertainty in the determination of was about 0.03 ppm. We present our data as the difference between the measured values with and without the sample in the cavity. In the case of the powder samples, the subtracted background signal was measured with a piece of clear epoxy of the same size as the sample with the powder. The resonant frequency of the cavity loaded with the sample was measured with a microwave frequency counter and the results are expressed as where is the frequency at the beginning of the measurement and is the frequency shift. The details of the detection scheme are given elsewhere Nebendahl:01 .
In the present case, the microwave penetration depth is much less than the sample thickness and the measured quantities are simply related to the surface impedance of the material
| (1) |
where is the complex conductivity, and is the complex relative permeability at the operating frequency. Both quantities can be temperature and field dependent. The sample is placed in the center of the cavity where the magnetic component of the microwave field has a node in the empty cavity. However, the wavelength in the conducting sample is much shorter than in vacuum so that a magnetic microwave field is also present within the skin depth from the sample surface. The total microwave impedance comprises both nonresonant resistance and resonant spin contributions.
III Results and Analyses
III.1 Magnetization and ac susceptibility
The dc magnetization curves observed in our RuSr2GdCu2O8 samples are typical of those previously reported.Bernhard:99 ; Tallon:00 ; Williams:00 Here we present in Fig. 1 the ZFC and FC dc magnetization at 5 mT in ceramic and powder samples taken from the same pellet. These curves show that the magnetic behavior observed in the ceramic sample is well reproduced in the powder sample, i.e. the influence of the intergranular medium on the dc-magnetic properties is negligible. There are three main features in ZFC curves: (i) a peak in the dc magnetization at 130 K, (ii) a decrease in the dc magnetization for temperatures less than 47 K, and (iii) an upturn of the magnetization below 20 K. The first feature is due to the magnetic ordering in the RuO2 layers. The FC curves deviate strongly from the ZFC ones indicating that a ferromagnetic component is present in our samples, both ceramic and powder. The second feature near 47 K has been attributed to the superconducting transition, and the third feature below 20 K is due to the onset of the magnetic ordering of the Gd sublattice, which orders antiferromagnetically at 2.5 K.Bernhard:99 ; Lynn:00

The ac susceptibilities of the same ceramic and powder samples are shown in Fig. 2. The magnetic ordering at 130 K is clearly seen in both, ceramic and powder samples. However, the superconducting transition, which is clearly seen in these samples below 47 K by dc magnetization in Fig. 1 is not manifested in the same way in the ceramic and powder samples when ac susceptibilities are measured. This is an unusual observation. The ac susceptibility curves in other HTSC exhibit nearly the same shapes and transition temperature widths for ceramic and powder samples of the same compound. Athanassopoulou:96 ; Kirschner:99 In contrast, in Fig. 2 we observe that a large diamagnetic shielding, which starts below 33 K in the ceramic sample, is not present in the powder. Hence, the large shielding signal in the ceramic sample could be interpreted as due to the onset of the intergranular Josephson currents. Superconductivity is certainly developed in the grains already below 47 K, but the intragranular ac screening currents appear to be very weak. They are so weak that even the high temperature tail of the Gd paramagnetic signal is sufficient to obscure their manifestation. In Fig. 2b we present also the ac susceptibility of the powder sample of RuSr2RCu2O8 with R=Eu, which is not paramagnetic. The intragranular superconducting signal is detectable in this compound. However, instead of showing a rapid drop just below the superconducting transition temperature , this signal exhibits a gradual decrease in the whole temperature range of the measurement. Obviously, the penetration depth in RuSr2RCu2O8 does not drop rapidly from the normal state skin depth to the London penetration depth as in other HTSC. For the operating frequency of 1 kHz, is typically much larger than the grain size ( 1 cm).

Below , the ac conductivity becomes complex , where the real and imaginary parts are due to the uncondensed normal electrons and the superconducting fluid, respectively. In the cuprate HTSC one reaches the condition already a little below . The penetration depth is then determined mainly by the superconducting fluid, and equals independently of the operating frequency. Since is typically smaller than the grain size, the intragranular screening currents become effective. Therefore, the diamagnetic signal in the ac susceptibility is strong and follows the temperature dependence of . In the case of powder RuSr2EuCu2O8we observe only a weak ac susceptibility signal. Below the penetration depth is reduced from its normal state value , but obviously not enough to become smaller than the grain size. We have to conclude that a large fraction of the charge carriers remains in the normal state at all temperatures below 45 K. The penetration depth at 1 kHz is then a combined effect of both, superconducting and normal electrons, and remains larger than the grain size. The magnetization results do not allow us to determine the location of the normal state charge carriers at low temperatures below . They are likely to be located either in the RuO2 planes or in the CuO2 planes. However, as we show later in this paper, it is possible to gather further information about these low temperature normal state charge carriers and their location from microwave measurements.
III.2 DC resistance, magnetoresistance, and Hall effect
The resistivity of RuSr2GdCu2O8 has already been elaborated in some previous studies. Bernhard:99 ; Tallon:00 Here we focus on some features that have not been considered before and could elucidate the roles of CuO2 and RuO2 planes in the transport properties. Figure 3 shows the resistivity curves in zero field and 8 T field. For the latter a transverse geometry was used (). In general, the resistivity in ceramic samples may have contributions from intergranular medium and from intrinsic scattering process in the grains. We show below, using microwave measurements on a powder sample of RuSr2GdCu2O8, that the resistivity in the grains does not exhibit a semiconducting contribution. Thus, the upturn of the resistivity below 100 K in Fig. 3 can be attributed to the prevalence of the intergranular contribution. Above 100 K, the predominant contribution to the total resistivity comes from the intragranular scattering. The relevant question is whether the whole charge transport occurs only in the CuO2 planes, or there is an additional contribution of the RuO2 planes to the total conductivity. The ZFC curve in Fig. 3 shows a more rapid decrease of the resistivity near the magnetic ordering temperature . This phenomenon is better displayed in the upper inset to Fig. 3 where the derivative of the resistivity with respect to temperature is seen to have a maximum at . A peak in at is commonly observed in ferromagnetic conductors. Campbell:82 It was explained by Fisher and Langer Fisher:68 who considered the effect of short range fluctuations in the magnetization in ferromagnetic metals. A peak in was also observed in SrRuO3which is a ferromagnet,Klein:96 but the temperature dependence of near was different than that predicted by Fisher and Langer and observed in ferromagnetic metals.

This deviation was ascribed to the bad metallicity of SrRuO3. We may conclude that the observation of a peak in in our ceramic RuSr2GdCu2O8 is a clear sign that RuO2 planes are conducting. At this point one can only list the factors which may influence the form of this peak. First, the magnetic order in RuSr2GdCu2O8 is predominantly antiferromagnetic at low fields with only a small ferromagnetic component. Second, the magnetic scattering affects the charge carriers in the RuO2 planes but need not have much influence on the conductivity in the CuO2 planes. Finally, the total resistivity in Fig. 2 includes also the intergranular semiconducting contribution. It is not predominant at , but should not be totally neglected. For all these reasons, the form of the peak in the inset to Fig. 3 could deviate from that predicted by Fisher and Langer.
The effect of an applied magnetic field of 8 T is to decrease the transverse resistivity for temperatures less than 200 K, which is opposite to the effect observed in the HTSC. Harris:95 The general decrease in the resistivity at 8 T and for temperatures less than 200 K can be attributed to a decrease in the spin scattering contribution to the resistivity within the RuO2 layers due to ordering of the spins in the RuO2 layers. The decrease in the resistivity at 8 T is clearer in the lower insert to Fig. 3 where we plot the difference in the transverse resistivity against temperature. The resulting peak reflects the effect of spin fluctuations which can be suppressed by the applied magnetic field. Similar behavior is observed in the ferromagnetic metals SrRuO3 and Sr4Ru3O10 as the magnetic field is increased. This provides additional evidence that the RuO2 layers are conducting.

While the temperature dependence of the resistivity at 0 T and 8 T has features that are also observed in the ferromagnetic metals SrRuO3 and Sr4Ru3O10, we find that the transverse () and longitudinal () magnetoresistance in RuSr2GdCu2O8 deviates from the behavior observed in SrRuO3 and Sr4Ru3O10. This is apparent in Fig. 4 where we plot the transverse and longitudinal magnetoresistance above (Fig. 4a) and below (Fig. 4b) the magnetic ordering temperature. Far above the magnetic ordering temperature, in the region where is proportional to (above 200 K), we find that , where is the transverse magnetoresistance and =2. This observation is consistent with the results previously reported by McCrone et al..McCrone:99 A similar magnetization dependence is observed in SrRuO3 and Sr4Ru3O10. However, below 200 K we find that continously decreases to a value of =1 as the magnetic ordering temperature is approached. Furthermore, just below the magnetic ordering temperature, a positive transverse magnetoresistance is observed for low applied magnetic fields. A low field positive transverse magnetoresistance is observed in SrRuO3 but at a lower temperature and far below the ferromagnetic ordering temperature.Gausepohl:95 In the case of SrRuO3, longitudinal magnetoresistance () measurements do not reveal a positive magnetoresistance.
Therefore, the positive transverse magnetoresistance observed in SrRuO3 was interpreted as being due to orbital magnetoresistance. The appearance of a low field positive magnetoresistance in both, transverse and longitudinal cases in Fig. 4b calls for a different interpretation. It has been recently observed in Sr3Ru2O7Liu:01 that below = 17 K, where dc resistivity changes its slope and dc susceptibility exhibits a maximum, both, transverse and longitudinal magnetoresistance curves develop a positive low field contribution. The explanation was given in terms of magnetic instability present in this sample due to its distorted crystal structure. Similar features were found also in Ca2-xSrxRuO4.Nakatsuji:00 ; Friedt:01 It is possible that the positive transverse and longitudinal magnetoresistance observed in Fig. 4 are connected with the observation of antiferromagnetic and ferromagnetic order in RuSr2GdCu2O8. The simultaneous antiferromagnetic and ferromagnetic order in RuSr2GdCu2O8 may be driven by band structure effects because the ferromagnetic component is different for different rare earths. The low field ferromagnetic component is highest in RuSr2YCu2O8 (30 % of the AF component).
Besides having been useful in studying the nature of the magnetism in RuSr2GdCu2O8, the observed magnetoresistance implicitly proves that RuO2 planes are conducting, i.e. it supports further the conclusion reached from the analysis of the slope change in dc resistivity shown in Fig. 3. Further evidence that the RuO2 planes are conducting can be obtained from the analysis of the Hall effect in RuSr2GdCu2O8.
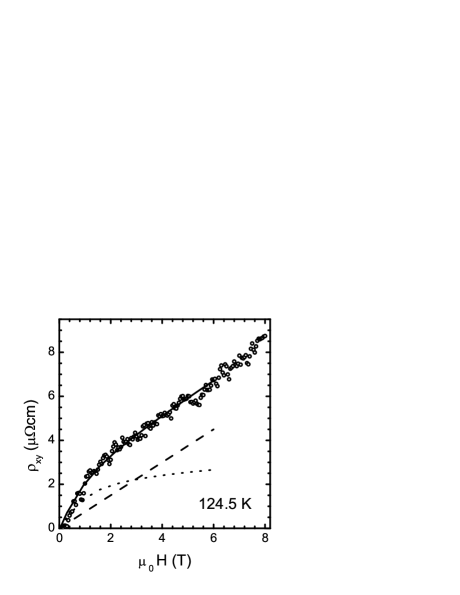
Hall resistance, , was measured as a function of the applied magnetic field at temperatures above and below . Fig. 5 shows the data at 124.5 K. For applied magnetic fields below 1 T a nonlinear increase of the Hall resistance with increasing is observed. For high magnetic fields a linear field dependence of dominates. The nonlinear increase in with increasing is due to an additional term arising from the extraordinary Hall effect. This term is present in magnetic metals and it is due to skew scattering where the probability of scattering from to is different from the probability of scattering from to . The Hall effect in magnetic metals is commonly given by
| (2) |
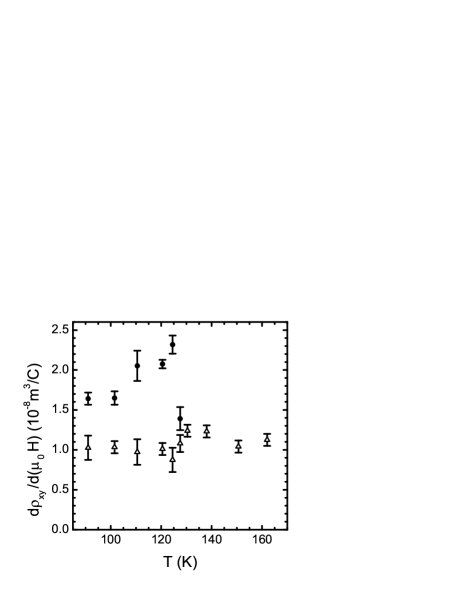
where is the ordinary Hall coefficient, is the extraordinary Hall coefficient, is the vacuum permeability and is the magnetization of the sample. We show in Fig. 5 (solid curve) that Eq. (2) does provide a reasonable representation of the data where from the RuO2 layers was obtained from SQUID measurements. Previous measurements of the Hall coefficient McCrone:99 were made at 8 T only, where it was found that the Hall coefficient displayed a peak near 160 K and decreased for temperatures less than 160 K. However, the Hall coefficient measured in this way will be significantly affected by the anomalous Hall effect. The development of the anomalous Hall effect can be seen in Fig. 6 where we plot the average for low and high fields. It can be seen that the high field is temperature independent and for the values are lower than those found from the average low field . We note that the ordinary Hall effect contains contributions from both the CuO2 and RuO2 planes. We find that the high field is slightly greater than that observed in YBa2Cu3O7-δ with a similar ( m3C-1)Segawa:01 while it is significantly greater than that observed in SrRuO3 ( m3C-1)Klein:00 . This might suggest that the ordinary Hall effect in RuSr2GdCu2O8 is dominated by the CuO2 layers. However, the occurrence of the extraordinary Hall effect in RuSr2GdCu2O8 indicates that the RuO2 planes are conducting.
III.3 Microwave measurements
In Fig. 7 we plot the temperature dependences of for the ceramic and powder samples in zero and 8 T applied magnetic field. We first consider the microwave impedance in the normal state. It is apparent in Fig. 7a that the zero field of the ceramic sample shows a peak at the magnetic ordering transition temperature. Note that such a peak is not observed in the dc resistivity data of the same ceramic sample presented earlier, where a peak is observed only in the derivative . When shown on an expanded scale in the insert to Fig. 7a, this peak is seen to be superimposed on a decreasing resistive signal with some curvature due to the intergranular semiconducting medium. A similar peak was observed also in ceramic RuSr2EuCu2O8 but the temperature dependence below the magnetic
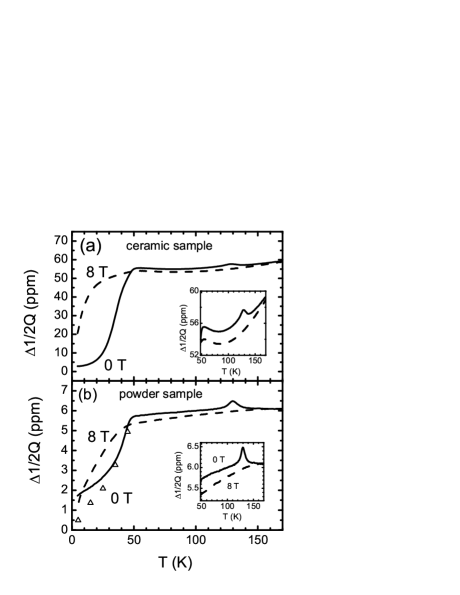

ordering temperature was obscured by the microwave resistance from intergranular transport. The peak disappears at high magnetic fields as can be seen in Fig. 7a where we plot at 8 T. We observe in Fig. 7b that the semiconductor like upturn in of the ceramic sample is not present in the powder sample, thus providing clear evidence that it arises from intergranular conduction. However, the peak in is still seen in the powder sample. This peak is therefore an intrinsic property of the intragranular regions. It is possible that the peak arises from a change in at the magnetic ordering temperature, although it can be seen in the insert to Fig. 7b that this would require a large change in over a small temperature range. It may also be that model of Fisher and Langer for dc resistivity does not apply to microwave frequencies. We note that a peak in the dc resistance was predicted earlier by De Gennes and Friedel who based their calculation on the long range spin fluctuations. DeGennes:58
The suppression of the peak in by an applied magnetic field is evident in Fig. 8a where we plot . It is apparent that the peak rapidly disappears with increasing magnetic field and it vanishes completely at magnetic fields greater than 1 T. Unlike the dc case, we find that the microwave magnetoresistance is negative for all temperatures in the normal state. The magnetic field dependence of can be seen in Fig. 8b. For magnetic fields greater than 2 T, there is a linear decrease in with increasing magnetic field. At 70 K and below, the Gd3+ ESR absorption is evident in the low field region and centered near 0.3 T. The intensity of this resonance increases with decreasing temperature owing to the increasing spin population difference in the lowest Gd3+ spin levels.

We show in Fig. 9 that there is an additional spin resonance below the magnetic ordering temperature. Here we plot and at 130 K and for magnetic fields of up to 1 T. For magnetic fields greater than 0.3 T, and have equal but opposite slopes as expected for a thick sample where microwave resistance is the only source of the microwave response. However, at low fields one observes a peak in centered at 25 mT, and displays a magnetic field dependence indicative of resonance phenomena.

This feature could be due to the Ru ferromagnetic resonance observed by Fainstein et al.Fainstein:99 in RuSr2GdCu2O8. We estimate by the dashed curve in Fig. 9a that this resonance contributes 0.7 ppm to at zero applied field. However, it is apparent in Fig. 8 that this resonance contribution to is insufficient to explain the full height of the peak at . We note that and in the powder sample are similar to those in Figs. 8 and 9 but the signal to noise ratio is much worse.
We now consider the microwave response in the superconducting state. Returning to Fig. 7, it can be seen that the zero field microwave resistance decreases near 50 K, similar to the dc case. The effect of an applied magnetic field on of the ceramic sample is similar to that observed in the HTSC.Pozek:92 ; Narlikar:96 However, the data for the powder sample is anomalous because at low temperatures the zero field values become larger than those taken at 8 T. We show later that this behavior is due to an enhancement of at low fields and low temperatures which is induced by the Gd3+ resonance.

The magnetic field dependence of the microwave absorption in the superconducting state can be seen in Fig. 10a where we plot for temperatures of 5 K, 15 K, 25 K, 35 K and 45 K. The initial rapid increase in is due to the Josephson coupled weak links that are being driven normal by the relatively small applied magnetic field. The slower increase in at higher magnetic fields arises from the absorption due to the increasing density of vortices in the grains.Coffey:91 ; Portis:93 ; Dulcic:93 The effect of these processes on the frequency shift is seen in Fig. 10b where is plotted at 5 K. Above 35 K the Josephson coupling between grains becomes weaker. Thus, at 45 K no characteristic Josephson signal is seen in Fig. 10a. At temperatures just below , only the individual grains become superconducting. The intergranular coupling is established at a lower temperature.
Superimposed on the changes in and is the effect of the Gd3+ resonance for low applied magnetic fields. It is partly obscured in Fig. 10 by the initial rapid changes in and induced by the weak link structure of the ceramic sample. The effect of the Gd3+ resonance is much clearer in Fig. 11 where we plot and of the powder sample. For applied magnetic fields above 2.5 T, and are dominated by the dissipative motion of the vortices in the mixed state Coffey:91 ; Portis:93 ; Dulcic:93 , while for magnetic fields less than 2.5 T the microwave response from Gd3+ contributes significantly to and . It is possible to account for the resonant contribution of Gd3+ to by extrapolating the high field to the low field region as indicated by the dashed line in Fig. 11. By applying this correction, we show in Fig. 7b (open triangles) that the microwave resistance at zero applied magnetic field is consistently smaller than that at 8 T. The absorption due to an effective microwave resistivity always increases with the applied magnetic field. There is, however, another unusual feature of the zero field microwave resistance in Fig. 7b. Unlike the cuprate HTSC, where drops rapidly below by more than two orders of magnitude, the zero field signal in Fig. 7b is significant even for temperatures much less than .
The anomalously large microwave resistance can not be accounted for by the occurrence of the spontaneous vortex phase. In this model, the ferromagnetic component of the spontaneous magnetization of the magnetically ordered RuO2 layers generates vortices.Sonin:98 The microwave currents would then induce oscillations of these vortices, leading to a microwave loss.Coffey:91 ; Portis:93 ; Dulcic:93 The density of vortices, and hence the local field that is required for the increased to be accounted for by the spontaneous vortex phase model, can be estimated from the observed rise of the signal level when the applied magnetic field is changed from zero to 8 T. We find that a spontaneous magnetic field of 7 T to 9 T is required. This is significantly larger than the local field estimated from a muon spin rotation study (0.1 T) or a Gd3+ ESR study.Fainstein:99 The large microwave resistance at zero applied magnetic field is certainly due to a large fraction of the normal carriers still being present at temperatures well below . Since the spontaneous vortex model is seen to be insufficient to provide the necessary amount of normal carriers, we propose that the normal carriers are to be found in the RuO2 layers.
At this point it is worthwhile to discuss whether the proposed interpretations of the ac susceptibility and microwave data are consistent. The operating frequencies for the two cases differ by seven orders of magnitude. The normal state skin depth is inversely proportional to the square root of the frequency. At our microwave frequency of 9.3 GHz, the skin depth in the normal state of RuSr2GdCu2O8 is 5m, which is close to the grain size. As soon as a fraction of charge carriers is condensed into the superconducting state, the penetration depth at the microwave frequency is reduced below the grain size. This effect causes a significant drop of the signal level as shown in Fig. 7b. This does not occur with the ac susceptibility signal in the same powder sample shown in Fig. 2b. Due to the remaining fraction of the normal carriers, the penetration depth does not become frequency independent. The extremely weak superconducting signal inferred from Fig. 2b implies that the penetration depth at 1 kHz is reduced from 1 cm to a value still larger than the grain size. The comparison of the data at those two largely different frequencies provides the final proof that a large fraction of the charge carriers in RuSr2GdCu2O8 is not condensed in the superconducting state even at very low temperatures.
The proposed scenario would imply that there is no induced superconductivity in the RuO2 layers. This can be contrasted with fully loaded YBa2Cu3O7, where the distance between the CuO2 layer and the CuO chain is similar to the distance between the CuO2 layer and RuO2 layer in RuSr2GdCu2O8, but there is induced superconductivity on the CuO chains in YBa2Cu3O7. The idea of decoupled CuO2 and RuO2 planes has been mentioned in the early work of Felner et al. on a related ruthenate-cuprate compound RuSr2Gd1.4Ce0.6Cu2O10-δ.Felner:97 The conditions of decoupling have been treated theoretically.Pickett:99 ; Nakamura:01 The Ru orbitals, where magnetism arises, are coupled to Cu orbitals, but the latter are almost fully occupied. On the other hand, Ru orbitals do not couple directly to the Cu orbitals, but only a more indirect coupling path via the apical oxygen may be possible. As a result, quite a small exchange splitting is induced in the antibonding () orbitals in the CuO2 planes. It was concluded that magnetism and superconductivity could coexist if the orbitals formed the basis for superconductivity. The present paper provides experimental support for theoretical models based on decoupled subsystems in RuO2 and CuO2 planes.
IV Conclusion
In conclusion, we find experimental evidence that, contrary to the conclusion from a number of previous studies, the RuO2 layers in RuSr2GdCu2O8 are conducting and contribute to the electronic transport above the superconducting transition. This is proven by the appearance of the peak in the temperature derivative of the dc resistivity at the magnetic ordering temperature , negative magnetoresistance, and extraordinary Hall resistivity. Hence, the insulating local moment model can not be applied to the RuO2 layers in this compound. Rather, by combining the results of this study with NMR and XANES data which provide strong evidence of a mixed Ru valence,Kumagai:01 ; Tokunaga:01 the RuO2 planes can be described as conducting with a spatially varying charge density.
The behavior below the superconducting transition is revealed from a detailed analysis of the dc magnetization, ac susceptibility, and microwave impedance data in the ceramic and powder samples. We prove that a large fraction of the charge carriers in RuSr2GdCu2O8 is not condensed in the superconducting state even at temperatures far below . The spontaneous vortex phase is found to be insufficient to account for the scale of the observed effect so that the normal conductivity is proposed to reside in the RuO2 planes at all temperatures. The present paper provides experimental support for theoretical models which explain the coexistence of superconductivity and magnetism through effectively decoupled subsystems in CuO2 and RuO2 planes.
Acknowledgements.
We acknowledge funding support from the Croatian Ministry of Science and Technology, the New Zealand Marsden Fund and the Alexander von Humboldt Foundation.References
- (1) A. Felner, U. Asaf, Y. Levi, and O. Millo, Phys. Rev. B55, R3374 (1997).
- (2) C. Bernhard, J. L. Tallon, Ch. Neidermayer, Th. Blasius, A. Golnik, E. Brücher, R. K. Kremer, D. R. Noakes, C. E. Stronach, and E. J. Ansaldo, Phys. Rev. B59, 14099 (1999).
- (3) A. C. McLaughlin, W. Zhou, J. P. Attfield, A. N. Fitch, and J. L. Tallon, Phys. Rev. B60, 7512 (1999).
- (4) J. L. Tallon, J. W. Loram, G. W. M. Williams, and C. Bernhard, Phys. Rev. B61, 6471 (2000).
- (5) W. E. Pickett, R. Weht, and A. B. Shick, Phys. Rev. Lett. 83, 3713 (1999).
- (6) O. Chmaissem, J. D. Jorgensen, H. Shaked, P. Dollar, and J. L. Tallon, Phys. Rev. B61, 6401 (2000).
- (7) J. W. Lynn, B. Keimer, C. Ulrich, C. Bernhard, and J. L. Tallon, Phys. Rev. B61, 14964 (2000).
- (8) A. Fainstein, E. Winkler, A. Butera, and J. L. Tallon, Phys. Rev. B60, 12597 (1999).
- (9) G. V. M. Williams, and S. Krämer, Phys. Rev. B62, 4132 (2000).
- (10) M. Požek, A. Dulčić, D. Paar, G. V. M. Williams, and S. Krämer, Phys. Rev. B64, 064508 (2001).
- (11) K. Kumagai, S. Takada, and Y. Furukawa, Phys. Rev. B63, 180509 (2001).
- (12) Y. Tokunaga, H. Kotegawa, K. Ishida, Y. Kitaoka, H. Takagiwa, and J. Akimitsu, Phys. Rev. Lett. 86, 5767 (2001).
- (13) L. Bauernfeind, W. Widder, and H. F. Braun, Physica C254, 151 (1995).
- (14) L. Bauernfeind, W. Widder, and H. F. Braun, J. Low Temp. Phys. 105, 1605 (1996).
- (15) R. S. Liu, L. -Y. Jang, H. -H. Hung, and J. L. Tallon, Phys. Rev. B63, 212507 (2001).
- (16) X. H. Chen, Z. Sun, K. Q. Wang, S. Y. Li, Y. M. Xiong, M. Yu, and L. Z. Cao, Phys. Rev. B63, 064506 (2001).
- (17) S. N. Ruddlesden, and P. Popper, Acta Crystallogr. I1, 54 (1958).
- (18) J. J. Randall, and R. Ward, J. Am. Chem. Soc. 81, 2629 (1959).
- (19) A. Kanbayashi, J. Phys. Soc. Jpn. 41, 1876 (1976); 44, 108 (1978).
- (20) G. Cao, S. K. McCall, and J. E. Crow, Phys. Rev. B56, R5740 (1997).
- (21) S.-I. Ikeda, Y. Maeno, S. Nakatsuji, M. Kosaka, and Y. Uwatoko, Phys. Rev. B62, R6089 (2000).
- (22) Y. Liu, R. Jin, Z. Q. Mao, K. D. Nelson, M. K. Haas, and R. J. Cava, Phys. Rev. B63, 174435 (2001).
- (23) Y. Maeno, H. Hashimoto, K. Yoshida, S. Nishizaki, T. Fujita, J. G. Bednorz, and F. Lichtenberg, Nature (London) 372, 532 (1994).
- (24) Q. Huang, J. W. Lynn, R. W. Erwin, J. Jarupatrakorn, and R. J. Cava, Phys. Rev. B58, 8515 (1998).
- (25) R. S. Perry, L. M. Galvin, S. A. Grigera, L. Capogua, A. J. Schofield, A. P. Mackenzie, M. Chiao, S. R. Julian, S. I. Ikeda, S. Nakatsuji, Y. Maeno, and C. Pfleiderer, Phys. Rev. Lett. 86, 2661 (2001).
- (26) S. Nakatsuji, and Y. Maeno, Phys. Rev. Lett. 84, 2666 (2000); Phys. Rev. B62, 6458 (2000).
- (27) O. Friedt, M. Braden, G. Andr , P. Adelmann, S. Nakatsuji, and Y. Maeno, Phys. Rev. B63, 174432 (2001).
- (28) J. D. Jorgensen, O. Chmaissem, H. Shaked, S. Short, P. W. Klamut, B. Dabrowski, and J. L. Tallon, Phys. Rev. B63, 054440 (2001).
- (29) H. Takagiwa, J. Akimitsu, H. Kawano-Furukawa, and H. Yoshizawa, J. Phys. Soc. Jpn 70, 333 (2001)
- (30) G. V. M. Williams, A. C. McLaughlin, J. P. Attfield, S. Krämer, and H. K. Lee (submitted to Phys. Rev. B).
- (31) J. E. McCrone, J. R. Cooper, and J. L. Tallon, J. Low Temp. Phys. 117, 1199 (1999).
- (32) B. Nebendahl, D.-N. Peligrad, M. Požek, A. Dulčić, and M. Mehring, Rev. Sci. Instrum. 72, 1876 (2001).
- (33) N. Athanassopoulou, and J. R. Cooper, Physica C259, 326 (1996).
- (34) I. Kirschner, R. Laiho, A. C. Bodi, A. D. Caplin, E. Lähderanta, G. Zsolt, and I. Halasz, Eur. Phys. J. B9, 389 (1999).
- (35) I. A. Campbell, and A. Fert, in Ferromagnetic Materials, Vol. 3, Edited by E. P. Wohlfarth (North Holland, Amsterdam, 1982).
- (36) M. E. Fisher, and J. S. Langer, Phys. Rev. Lett. 20, 665 (1968).
- (37) L. Klein, J. S. Dodge, C. H. Ahn, G. J. Snyder, T. H. Geballe, M. R. Beasley, and A. Kapitulnik, Phys. Rev. Lett. 77, 2774 (1996).
- (38) J. H. Harris, Y. F. Yan, P. Matl, N. P. Ong, P. W. Anderson, and K. Kitazawa, Phys. Rev. Lett. 75, 1391 (1995)
- (39) S. C. Gausepohl, M. Lee, K. Char, R. A. Rao, and C. B. Eom, Phys. Rev. B52, 3459 (1995).
- (40) K. Segawa, and Y. Ando, Phys. Rev. Lett. 86, 4907 (2001)
- (41) L. Klein, J. R. Reiner, T. H. Geballe, M. R. Beasley, and A. Kapitulnik, Phys. Rev. B61, 7842 (2000).
- (42) P. G. de Gennes, and J. Friedel, J. Phys. Chem. Solids 4, 71 (1958).
- (43) M. Požek, A. Dulčić, and B. Rakvin, Physica C197, 175 (1992).
- (44) Microwave Studies of High Temperature Superconductors, Vols. 17 and 18 of Studies of High Temperature Superconductors, edited by A. Narlikar (Nova Science, New York, 1996)
- (45) M. W. Coffey, and J. R. Clem, Phys. Rev. Lett. 67, 386 (1991).
- (46) A. M. Portis, Electrodynamics of High-Temperature Superconductor (Vol. 48 - Lecture Notes in Physics), World Scientific, Singapore, 1993.
- (47) A. Dulčić, and M. Požek, Physica C218, 449 (1993).
- (48) E. B. Sonin, and I. Felner, Phys. Rev. B57, 14000 (1998).
- (49) K. Nakamura, K. T. Park, A. J. Freeman, and J. D. Jorgensen, Phys. Rev. B63, 024507 (2001)