Geophysical Laboratory and Center for High Pressure Research,Carnegie Institution of Washington, 5251 Broad Branch Rd, N. W., Washington D.C. 20015, USA Institute of Earth Sciences, 128 Academia Rd., Sec. 2, Nankang, Taipei, Taiwan 115 \PACSes\PACSit63.20Kr., 62.50.+p,78.30.-j \PACSit—.—…
Raman Scattering of Metals to Very High Pressures
Abstract
1 Introduction
The study of the effect of pressure on materials is fundamental to a range of problems in physics (e.g., Ref. [1]). With increasing pressure, the distances between atoms normally decrease, which leads to the increase of interparticle interactions. Thus, by changing the pressure, one can tune the physical properties of materials and observe corresponding changes in the vibrational, electronic and magnetic excitations. The gradual changes of interatomic distances and interaction in some cases yield to radical transformations that are unique to high pressure. The behavior of compressed materials can be studied under static conditions to pressures above 300 GPa (or 3 megabars). The associated large decrease in volume provides a wealth of opportunities to observe basic changes in bonding character, magnetic or electronic structure or chemical state. Such experiments have become possible with the development of ultrahigh-pressure diamond-anvil cell techniques (e.g., Ref. [2]). In particular, high-pressure spectroscopy provides crucial and often unique information on bonding properties and excitations of metals, semiconductors and superconductors [3, 4]. Ultrahigh-pressure research, by its very nature, imposes substantial requirements on experimental technique. The extremely small amount of the material (e.g., down to picoliter volumes) brought to megabar pressures demands extremely sensitive and versatile equipment. Thus, the quality of information obtained critically depends on the development of new techniques and improvement of the existing methods.
Raman studies of metals is a challenging task because only a very thin surface layer of the sample (skin-depth of 1000) is typically probed by the exciting laser radiation. This makes the requirements for the experimental technique even more severe. Raman studies in metals were began in 1966, with the pioneering work of Feldman et al. [5]. They were able to detect very weak signals from phonon modes in Be and AuAl2. The first work on metals under pressure were published in 1992 by Olijnyk [6]. The high-pressure phases of Si and Ge were studied to 50 GPa by Raman measurements of the phonon modes, and the results were in reasonable agreement with theoretical calculations [7, 8, 9]. Such studies have now become more feasible, reliable, and definitive with the development of new CCD array detectors and optical systems [10, 11], because they give tremendous advantage in comparison to single-channel and diode-array techniques.
Raman spectroscopy of metals has been of growing interest, in part because it is a very informative way of characterizing high-temperature superconductors (including determination of the superconducting gap; e.g., Refs. [12, 13]). The possibility of using Raman spectroscopy under pressure for studies of these materials has been demonstrated [14]. Several applications of the technique to metals have been reported [15, 16, 18], but its more extensive use has been limited in pressure range and by the need to detect very weak signals. We applied new holographic transmission optics Raman techniques [19] for high-pressure studies to obtain substantially improved performance, which allowed us to extend Raman measurements in metals to the megabar pressure range [20].
2 Experimental
2.1 Raman technique
The recent improvements in Raman spectroscopy techniques stemmed from the development of extremely sensitive array detectors (CCD) and fast imaging spectrometers [4, 11] coupled with and incorporating holographic transmission optics. The latter has already found a wide application as notch filters, which efficiently block undesirable Rayleigh-scattered light in Raman systems used for routine measurements [21]. This obviates the need for cumbersome low-transmission double subtractive monochromator filter systems for measurements above 50 cm-1 and increases substantially the throughput of the system. The obvious drawback of such systems in its commercial realization is the need of a separate set of optics for each excitation wavelength (e.g., lines of an Ar-ion laser).
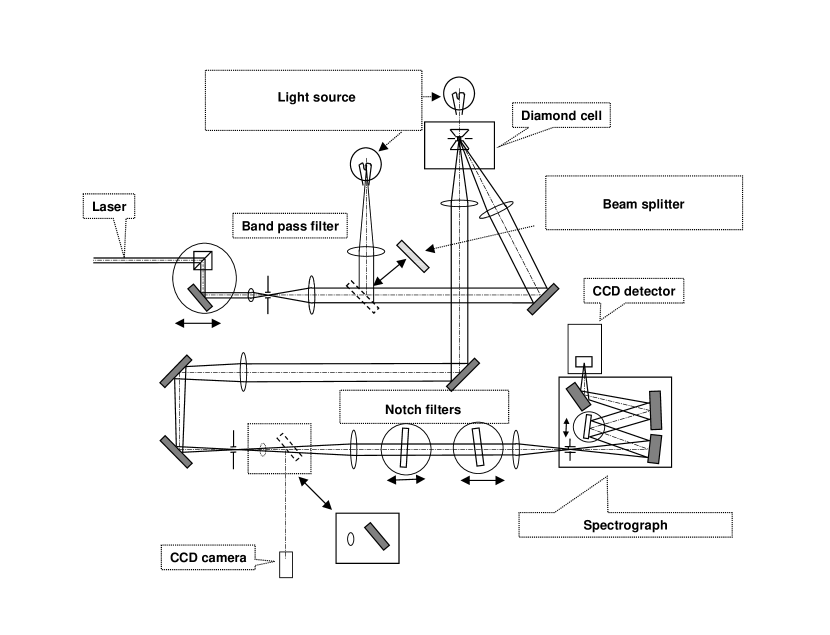
In the case of high-pressure spectroscopy, flexible changes in both the excitation wavelength and the spectral range are essential because of the need to choose the optimum excitation for both ruby fluorescence and Raman measurements. This requires convenient tuning of the central wavelength of the laser bandpass filter and the position of the notch of the laser rejection filter. We have developed a simple universal design for Raman/fluorescence measurements with capabilities of collecting low- and high-resolution spectra and exciting spectra in different geometries using a variety of laser wavelengths, which can be easily selected by tuning holographic optics (fig. 1). The spectral and spatial purity of the laser beam is greatly improved by use of a bandpass filter (Kaiser Optical Systems) and a spatial filter, which is also used as a beam expander. The collimated laser beam is focused to the sample in either backscattering geometry with a neutral or dispersive beamsplitter [22] and the same long working-distance objective lens, which is used for collecting the scattering radiation, or at an oblique angle using an auxiliary long focal-length lens. The scattered radiation collimated by the objective lens passes one or two notch filters (Kaiser Optical Systems) and is focused into a confocal pinhole, which is conjugated to the entrance slit of the spectrograph, to reduce the unwanted fluorescence from the diamond anvils. The best performances have been realized with the 460-mm focal length f/5.3 imaging spectrograph (Jobin Yvon HR460) equipped with two 1800 and 300 grooves/mm gratings on the same turret. This feature allows one first to take a quick spectrum over a wide spectral range (about 5000 cm-1) and then study regions of interest with higher accuracy and resolution. The system can be tuned to other excitation frequencies by changing the laser wavelength and rotating the holographic filters. One set of holographic filters covers the spectral range about 70 nm (notch filters) and 150 nm (bandpass filter), which is suitable for most applications. Use of notch filters for laser radiation rejection limits the spectral range available for Raman measurements to 50-100cm-1 because the bandpass of the notch filter cannot be made narrower with present technology. If the low-frequency range is needed, then the spurious laser radiation can be supressed by a double tunable filter made with dispersive holographic transmission gratings [22].
Use of the double spatial filtering (one for the laser and one for the signal) effectively suppresses laser plasma lines and unwanted Raman/fluorescence signals (e.g., from diamond anvils). In this configuration the laser spot can be made very tight (e.g., 2 m and the depth of focus is substantially reduced. Thus, the Raman signal from the diamond anvil is suppressed to a minimum; the effects of pressure unhomogeneity can also be substantially reduced [23]. Diamond fluorescence can be further reduced by using synthetic ultrapure diamonds anvils. This is crucial for studies of very weak scatters (e.g., high-temperature superconductors) and/or materials at very high pressures (above 200 GPa), where strong stress-induced fluorescence of diamond anvils is a major obstacle for obtaining Raman/fluorescence spectra of samples [23].
In case the of metals, the use of an angular excitation geometry was found to be crucial, since it allows a substantial reduction in background compared to the pure back-scattering geometry. For this, the diamond cell must be modified to allow the angular light access. Specially designed tungsten carbide seats with angular conical holes have been used for this purpose.
2.2 Materials
Samples of iron-nickel alloys Fe(1-x)Nix with x0.2 from various sources have been studied recently. Some of them (with x=0.05, 0.10, 0.15, 0.20) were synthesized and characterized at Cornell University [24]. Another group with x=0.05 and x=0.1 were the same materials studied in Ref. [25]. New samples with x=0.01, 0.03 and 0.07 were synthesized at the Geophysical Laboratory. The sample with x=0.07 was enriched by 57Fe isotope for nuclear resonance inelastic x-ray scattering (NRIX) measurements. Rhenium samples were either commercially available polycrystalline foils or powders in the case of our in hydrostatic experiments. Samples of Mg10B2 were similar to those used in Refs. [27, 28]. They are essentially in a powdered form and consist of aggregates of 30-50 m linear dimensions, which is ideal for high-pressure experiments.
3 Raman studies of metals
3.1 Iron and Fe(1-x)Nix alloy
Knowledge of the physical properties of iron and its alloys is very important for understanding the nature of the Earth’s core. Recently, there has been a flurry of experimental and theoretical activity devoted to determination of the elastic properties of iron at the conditions close to those of the core [29, 30, 31, 32, 33, 34, 35, 36]. Despite these efforts, direct and unambiguous measurements of the second-order elasticity tensor (e.g., ) under pressure are missing, and existing experimental and theoretical data are still controversial [31, 37]. Raman spectroscopy can provide independent constraints on the high-pressure elasticity from measurements of the frequency of the transverse optical phonon, which is related to the shear elastic constant by the relation
| (1) |
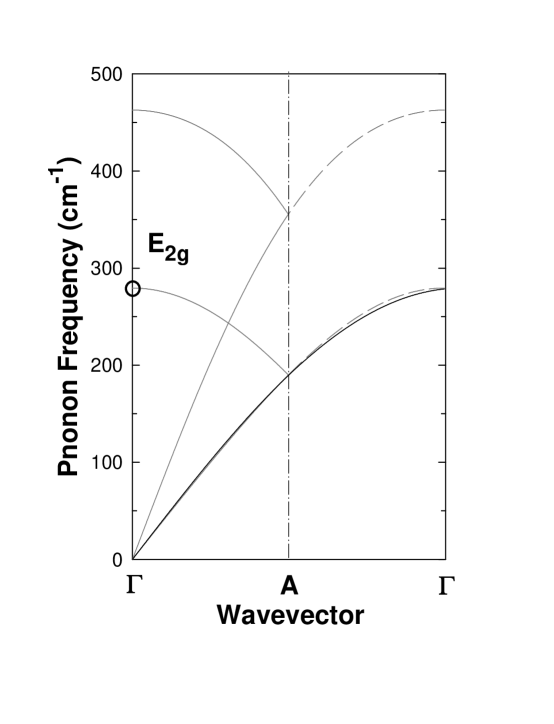
where is the atomic mass of iron, and are unit cell parameters, and is the frequency of the optical phonon [37, 38]. This simple relation reflects the fact that the frequency of the phonon and the sound velocity (or corresponding are the properties of the same phonon branch (fig. 2), folded because of the doubling of the fcc unit cell to form hcp. Figure 2 shows the dispersion curves in the A direction (001) for the -Fe computed theoretically [35, 39] in comparison with a ”sine” curve obtained with the same phonon frequency. They are very close to each other (but a small discrepancy near the zone boundary), which show the validity of the model used. The theoretically computed is 232 GPa, while the model gives a comparable value of 258 GPa. In general, this method gives fairly good results in for metals that exhibit a ”normal” behavior under compression, while the proximity of phase transitions may cause a substantial anisotropy of elastic properties, which makes significantly reduced the validity of the approach (see discussion below).
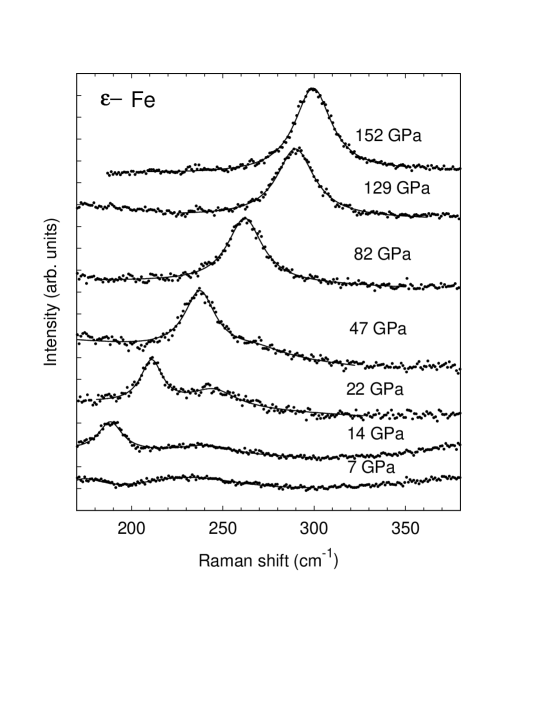
We performed the Raman measurements in -Fe to 152 GPa, which correspond to pressure at the core-mantle boundary [20] (see also Ref. [37] with similar measurements to lower pressures). Raman spectra of iron at selected pressures are shown in (fig. 3). The strong band, which appears in the spectra above 15 GPa on pressure increase and remains to approximately 10 GPa on pressure decrease, is identified as the E2g mode of -Fe. The difference for compression and decompression is consistent with the known hysteresis through the - transition [40]. A second band, which is weaker and broader than the main one, is observed at higher frequencies at moderate pressures. It will be discussed below in comparison with analogous behavior found for the alloys.
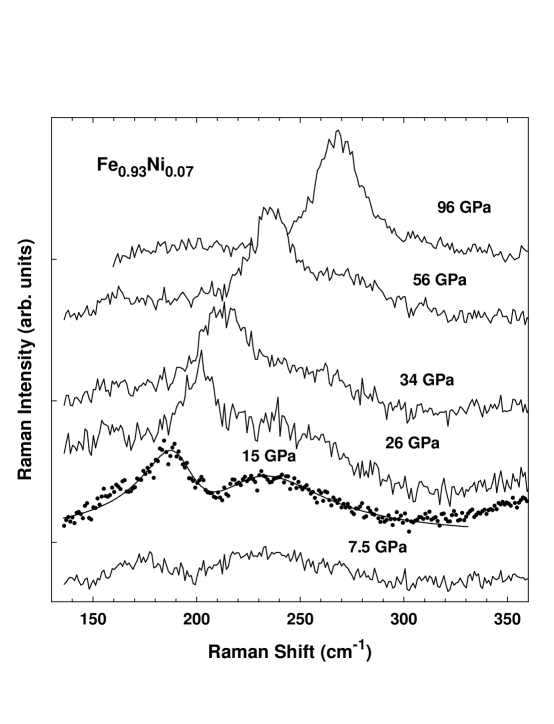
We also present preliminary results of a similar study of Fe(1-x)Nix alloys and compare the results with pure Fe. Ni can be considered a secondary element in the Earth’s core, so we addressed possible change of elastic properties of the chemical substitution. The phase diagram of the low-nickel Fe(1-x)Nix alloys are similar to pure Fe [24], and the transition pressures at room temperature are very close. Moreover, the equations of state are very similar in both the or phases [25, 26]. The Raman spectra of Fe0.93Ni0.07 at different pressures are shown in fig. 4. As for pure Fe, the dominant feature of the spectra is the E2g mode, which appears when pressure exceeds the – transition boundary (15 GPa upstroke in agreement with numerous x-ray data). The second broader and weaker peak is more pronounced in the alloy compared to pure Fe (fig. 4). It could be observed to almost 60 GPa (c.f., 45 GPa in pure Fe) and also after the back transformation to -Fe (8 GPa downstroke), where the E2g mode, which is only active in -Fe, becomes unobservable. The E2g mode line profile appears to be asymmetric at low pressures, which may be related to coupling to other excitations.
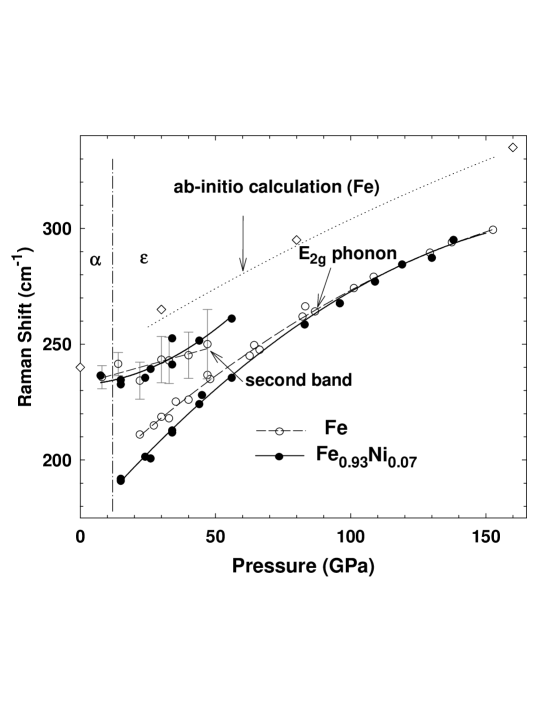
The frequency of the E2g mode is lower by some 10 cm-1 for the alloys compared to pure Fe, and this difference decreases with pressure, so the curves merge above 100 GPa (fig. 5). Surprisingly, this Raman frequency offset is independent of composition for x0.03. For x0.03 the pressure versus frequency data are undistinguishable within the experimental accuracy. The pressure dependence of the frequency of the second broad Raman peak for the pure Fe and the alloys are close to each other (fig. 5). In the case of the alloy, it seems to show an upturn with pressure. This second Raman peak was tentatively assigned in [20] to disorder-induced phonon scattering. According to calculations [41], the LA phonon branch is very flat between K and M points of the Brillouin zone, thus giving a large density of phonon states close in frequency to the experimentally observed second Raman peak. It can also be due to TA zone boundary phonons at the L point of the Brillouin zone [47]. The large density of phonon states in this frequency range is also confirmed by direct measurements [35]. The reason for the disorder may be a proximity to the transition boundary which can give rise to stacking faults (mixed hcp-fcc stacking). The alloys are also naturally disordered because of the presence of different atoms. In principle, disorder relaxes symmetry and wave-vector conservation requirements for Raman activity and causes coupling between excitations with different parent symmetries. The results of a coupled oscillator model fit [42, 43] are shown in fig. 4 [44]. An alternative explanation would be possible weak magnetism in -Fe at lower pressures [31, 46], which would lift the degeneracy of the E2g mode. Both interpretations are consistent with disappearance of the effect at higher pressures.
The lower frequency of the E2g mode in the alloys compared to pure Fe is intriguing. One would expect very small reduction of the frequency (0.5% or 1 cm-1 at 25 GPa for the Fe0.8Ni0.2 alloy with the maximum substitution studied) if only the effect of changing the mass is taken into account. Since no effect of changing of lattice parameter with Ni substitution is reported, a substantial change in force constant is not expected. One possible explanation for the observed softening would be different coupling constant between the E2g mode and the second Raman mode for the pure Fe and alloys. A larger coupling constant (in case of alloys with more relaxed selection rules, see above) would shift the E2g mode to lower frequency.
The threshold nature of the effect observed (see above) suggests a change in behavior at about x=0.03. This may be due to a change in magnetic (or chemical) ordering or a change of free carrier density (which in turn can influence the coupling of the E2g mode with free carriers). If 1, where and q are the phonon frequency and wave vector, vF is the Fermi velocity, then the phonon experiences so-called Landau damping, so that its frequency and damping re-normalize [48]. The magnitude of the effect can be tuned by variation of pressure (through variation of ) and by doping level, which change the Fermi velocity vF. Additional studies need to be performed to clarify the observed effect.
3.2 Rhenium
| Element | Raman Shift(cm-1) | (GPa) calculated | (GPa) experimental |
|---|---|---|---|
| Zr | 87 [15] | 28.9 | 33.4 [50] |
| Mg | 122 [17] | 15.9 | 18.6 [50] |
| Zn | 71.5 [18] | 19.8 | 39.6 [50] |
| Re | 119 (this work) | 133 | 161 [51] |
Our initial motivation for measuring the Raman spectra of Re under pressure was possible use it as a convenient secondary pressure calibration gauge. As an hcp metal, Re has a Raman-active E2g mode, which has been measured under pressure by Jephcoat and co-workers [16, 17, 18]; no anomalies have been reported consistent with the wide stability field of the phase. On the other hand, there are several peculiar observations at ambient and low pressure, which have motivated further study. Raman measurements at low temperatures and ambient pressure show extra peaks, which have been ascribed to a possible structural instability [49]. The pressure dependence of superconducting transition temperature show anomalous behavior up to 1.6 GPa [53], which has been tentatively ascribed to a pressure-induced change of the topology of the Fermi surface (electronic topological transition; ETT) [54].
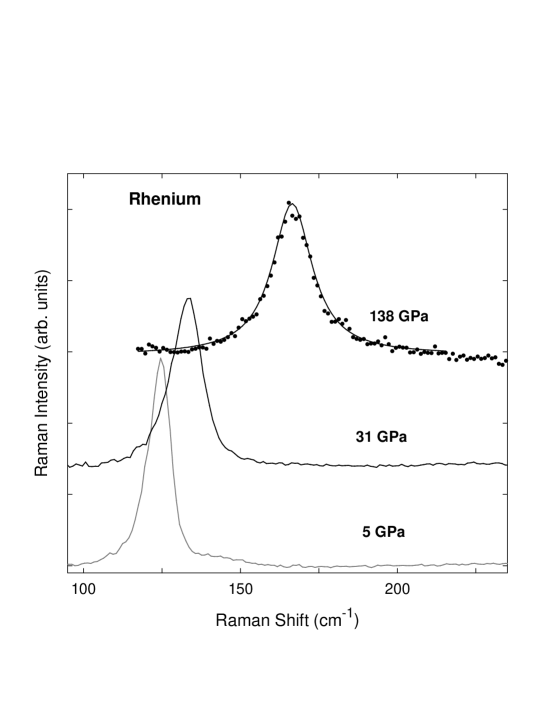
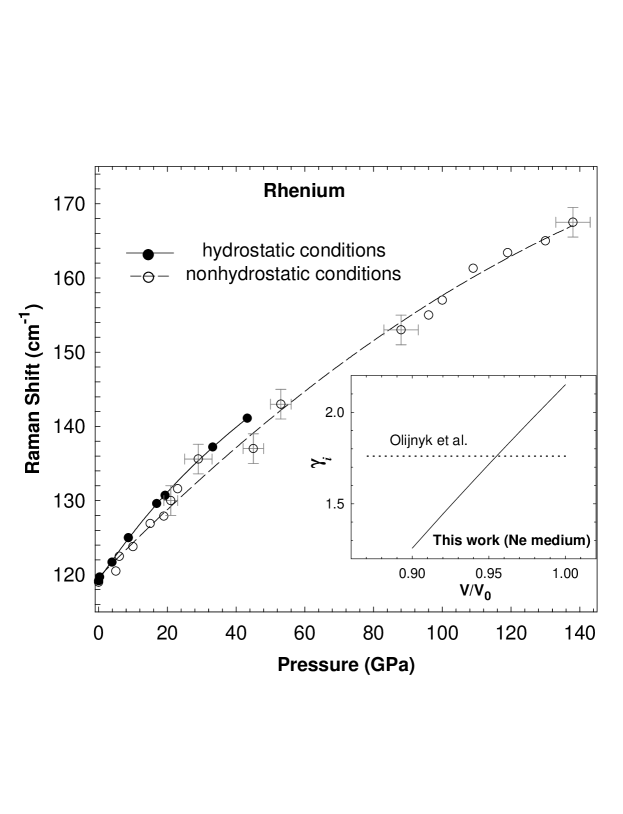
We measured the Raman spectrum of Re to 138 GPa (fig. 6). We found a positive monotonic shift in frequency of the E2g mode with pressure in agreement with the results of Ref. [17] (which stopped at 65 GPa). A broadening of the band with pressure (fig. 6) arises from nonhydrostatic stresses because no pressure transmission medium was used (as in case of experiments reported in Ref. [17]). The frequency shift (fig. 7) is weakly sublinear with pressure (c.f., Ref. [17]).
We also performed measurements under quasihydrostatic conditions to 44 GPa (using Ne as a medium [55]) and found that there is a systematic deviation in the frequency to the higher energy side compared to nonhydrostatic data [56, 57]. As the result, the pressure dependence of the E2g mode frequency under quasihydrostatic conditions is essentially sublinear at low pressures (fig. 7). The volume dependence of the mode-Grüneisen parameter (inset to fig. 7) obtained from these data and x-ray diffraction measurements of the equation of state [58] shows a strong volume dependence in contrast with the measurements of Olijnyk et al. [18]. Also, the initial mode-Grüneisen parameter =2.16 is substantially larger than in Ref. [18] (=1.76). We relate the large and its volume derivative to possible proximity of Re to ETT at 1 GPa [53] (see discussion below).
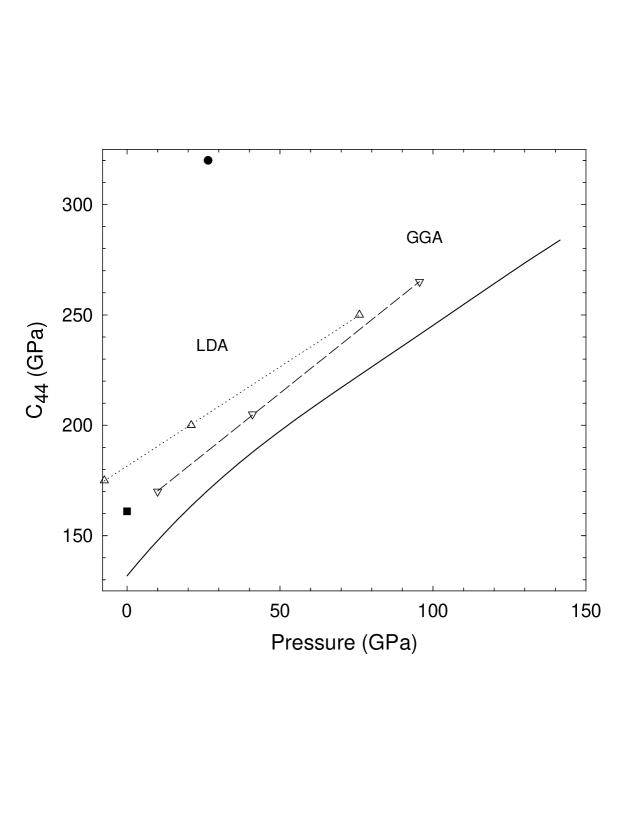
Using formalism developed in Refs. [16, 20, 38], we calculated the pressure dependence of shear modulus C44 for Re from our Raman measurements of the E2g mode frequency (fig. 8). The result at ambient pressure is 17% lower than the direct measurements, which appears to be a systematic offset of the model based on comparisons among different metals (Table 1). This systematic deviation can be easily explained by departure from the ideal ”sine” shape of the dispersion curve inferred in Refs. [16, 20, 38] because of long-range interactions. This deviation can be substantially larger (as in the case of Zn) if there is a substantial departure from ”normal” behavior (e.g., ETT). Nevertheless, if the validity of approximation [16, 20, 38] is established by an independent method at low pressures (by direct measurements), it can be successfully used at high pressures, which is very significant if other measurements and/or theoretical calculations give contradictory results.
The pressure dependence of for Re (fig. 8) determined in this work shows a systematic offset compared to first-principles theoretical calculations [31]. This deviation is smaller at higher pressures, and it can at least partly be accounted for by the systematic underestimation of from the Raman frequency (see discussion below). This result differs from the lattice strain measurements (see discussion in Ref. [52]).
3.3 MgB2 and ETT
The recently discovered superconductor MgB2 [59] appears to be a clear case of a conventional superconductor with strong electron-phonon coupling [27, 60, 61, 62, 63, 64, 65, 66]. Theoretical calculations demonstrate that only one phonon branch corresponding to vibrations of the B atoms perpendicular to the axis is responsible for most of the coupling [63, 64]. This branch becomes Raman-active at zone center (E2g mode), which allows study of the electron-phonon coupling by vibrational spectroscopy. Application of pressure tunes the parameters of the system, so it can be used as an important test for theoretical models.
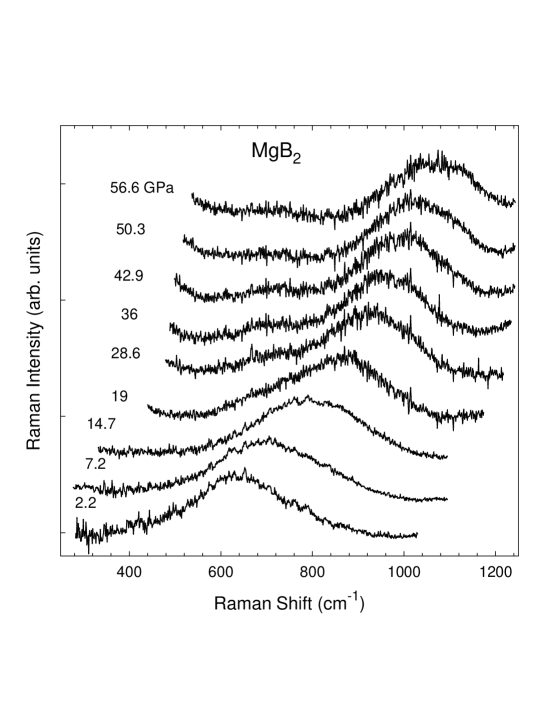
A combined Raman, x-ray diffraction and studies under hydrostatic pressure [68, 69, 70] to 57 GPa confirm the first-order phonon nature of the broad Raman band and provided the volume dependence of the electron-phonon coupling parameter. Figure 9 shows monotonic shift of the E2g mode to higher frequencies with pressure. This band is very broad because of the electron-phonon coupling [65], becoming even broader at 15-25 GPa, which may be due to the appearance of an additional band close to the original one. At higher pressure the band becomes narrower, and no additional Raman band structure is observed.
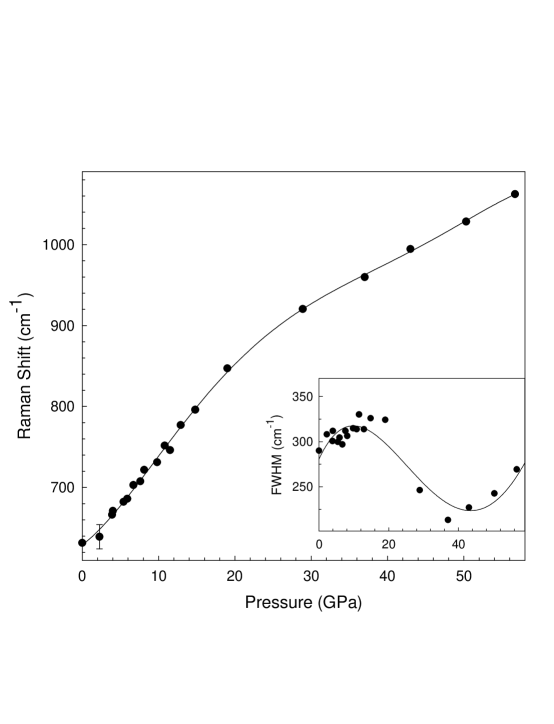
The pressure dependences of the Raman frequency and linewidth of MgB2 are presented in fig. 10. The pressure shift of the frequency has a kink at about 20 GPa, so the pressure derivative of the frequency discontinuously diminishes at this point, which corresponds to the step-like change in the mode-Grüneisen parameter (Table 2) because no anomaly is found in the curve up to 50 GPa [67]. The mode-Grüneisen parameter from ambient to 20 GPa is anomalously large, which we also ascribe to the electron-phonon coupling [68] and the peculiar topology of the Fermi surface [64]. It has the crossing of the lower B bands with the Fermi level modulated by the zero-point motion associated with the E2g mode. Pressure pushes these bands up and the amplitude of the zero-point motion decreases with pressure, reducing this dynamical crossing related to the E2g mode. It is interesting that the versus pressure curve also changes slope close to 20 GPa [70].
The mode-Grüneisen parameters (Table 2) appear to be sensitive not only to the phase transformations, but also to changes in electronic structure (like ETT) through the electron-phonon coupling. This is due to the fact that as well as Tc are related to high-order derivative of thermodynamic potential, and thus are more sensitive to delicate changes in comparison to the phonon frequency or lattice parameters. Changes in () are in turn even more sensitive and may indicate the proximity to an ETT or an approaching instability of the lattice.
Table 2 contains information about the mode-Grüneisen parameters and their derivatives for several materials. Diamond is known to be stable to at least 350 GPa and can be considered as an example of ”normal” behavior under pressure. Accordingly, is almost independent of pressure 1, which is typical for covalent compounds [72]. Metals are expected to behave similarly; this is illustrated by the example of -Fe, which is stable to at least 300 GPa and exhibits no substantial change of structural parameters (e.g., ratio) observed [26]. Zinc shows anisotropic compression [73], and various calculations suggest the occurrence of an ETT [74, 18], which has not been confirmed experimentally [18, 75] in agreement with recent calculations [76]. We speculate that the enormously large and for Zn (and Re; fig. 7) indicate the proximity to an ETT, which could be at negative pressures. With its very large electron-phonon coupling, MgB2 appears to be a very clear case of an ETT driven by the phonon [70].
| Compound | qi0 | Comment | Reference | |
|---|---|---|---|---|
| diamond | 1.00(0.03) | -1(1) | normal behavior | [71] |
| iron ( phase) | 1.68(20) | 0.7(5) | normal behavior | [20] |
| Zn | 3 | 4.7 | close to EET | [18] |
| Re | 2.16(5) | 9(3) | close to ETT? | this work |
| MgB2 | 2.9(3) | 0(1) | large anharmonicity | [68] |
| MgB2 | 1.5 (P 29 GPa) | change of is due to ETT | [70] |
4 Conclusions
The development of optical spectroscopy instrumentation make it now possible to obtain the Raman spectra of metals to megabar (100 GPa) if not multimegabar pressures. The information obtained includes the behavior of first-order phonon modes and their coupling to the electronic and (possibly) magnetic excitations. It can be used to estimate the elastic moduli, and to obtain diagnostics of phase transformations and electronic topological transitions.
Acknowledgements.
The authors are grateful to G. Lapertot, S. L. Bud’ko, and P. C. Canfield for samples of MgB2. This work was supported by NSF, DOE, and the W. M. Keck Foundation.References
- [1] \BYHemley R. J. \atqueAshcroft N. W. \INPhysics Today51199826.
- [2] \BYHemley R. J. \atqueMao H. K. \IN Encycl. of Appl. Phys., ed. G. L. Trigg, VCH Publishers, New York181997555.
- [3] \BYHemley R. J. \atquePorter R. F. \IN Scripta Metall.221988139.
- [4] \BYGillet P., Hemley R. J., \atqueMcMillan P. \INUltrahigh-Pressure Mineralogy: Physics and Chemistry of the Earth’s Deep Interior, Rev. Min., edited by R. J. Hemley (Mineralogical Society of America, Washington, D.C.)371998.
- [5] \BYFeldman D. W., Parker J. H., Ashkin M. \INPhys. Rev. Lett.211968607.
- [6] \BYOlijnyk H. \INPhys. Rev. Lett.6819922232.
- [7] \BYNeeds R. J. \atqueMartin R. M. \INPhys. Rev. B3019845390.
- [8] \BYChang K. J. \atqueCohen M. L. \INPhys. Rev. B3119857819.
- [9] \BYChang K. J. \atqueCohen M. L. \INPhys. Rev. B3419864552.
- [10] \BYWilliams K. P. J. et al. \INJ. Raman Spectrosc.251996131.
- [11] \BYDelhaye M. et al. \INRaman Microscopy, edited by G. Turrell and J.Corset, Academic Press, London1996.
- [12] \BYBlumberg G., Kang M., Klein K., Kadovaki K., \atqueKendziora C. \INScience27819971427.
- [13] \BYHackl R. \INThe gap Symmetry and Fluctuations in High-Tc Superconductors, edited by R. J. Bok et al. Plenum Press, New York2491998.
- [14] \BYGoncharov A. F., Struzhkin V. V., \atqueSyassen, K. \INHigh-Pressure Science and Technology, edited by S. C. Schmidt, J. W. Shaner, G. A. Samara, M. Ross, Colorado Springs, Colorado, USA7071993.
- [15] \BYOlijnyk H. \atqueJephcoat A. P. \INPhys. Rev. B56199710751.
- [16] \BYJephcoat A. P., Olijnyk H., Refson K. \INEos801999F929.
- [17] \BYOlijnyk H. \atqueJephcoat A. P. \INScience and Technology of High Pressure, edited by M. H. Manghnani, W. Nellis and M. Nicol, Universities Press, Hyderabad, India11999436.
- [18] \BYOlijnyk H., Jephcoat A. P., Novikov D. L., Christensen N. E. \INPhys. Rev. B6220005508.
- [19] \BYTedesco J. M., Owen H., Pallister D. M. \atqueMorris M. D. \INAnalyt. Chem. A651993441.
- [20] \BYMerkel S. Goncharov A. F., Mao H. K., Gillet P., \atqueHemley R. J. \INScience28820001626.
- [21] \BYYang B. Morris M. D., \atqueOwen H. \INAppl. Spectroscopy4519911533.
- [22] \BYGoncharov A. F. \atqueStruzhkin V. V. Patent pending.
- [23] \BYGoncharov A. F. et al. \INScience and Technology of High Pressure, edited by M. H. Manghnani, W. Nellis and M. Nicol, Universities Press, Hyderabad, India1199990.
- [24] \BYHuang E., Bassett W. A., \atqueWeathers M. S. \INJ. Geophys. Res.9319887741.
- [25] \BYTakahashi T. \atqueMao H. K. \INJ. Geophys. Res.7319684717.
- [26] \BYMao H. K., Wu Y., Chen L. C., \atqueShu J. F. \INJ. Geophys. Res.95199021737.
- [27] \BYBud’ko S. L. et al., \INPhys. Rev. Lett.8620011877.
- [28] \BYFinnemore D. K. et al., \INPhys. Rev. Lett.8620012420.
- [29] \BYStixtrude L. \atqueCohen R. E. \INScience26719951972.
- [30] \BYMao H. K. et al. \INNature3961998741.
- [31] \BYSteinle-Neumann G., Stixtrude L. \atqueCohen R. E. \INPhys. Rev. B601999791.
- [32] \BYLaio A., Bernard S., Chiarotti G. L., Scandolo S., \atqueTosatti E. \INScience28720001027.
- [33] \BYLübbers R., Grünsteudel H. F., Chumakov A. I., Wortmann G. \INScience28720001250.
- [34] \BYFiquet G., Badro J., Guyot F., Requardt H., Krisch M. \INScience2912001468.
- [35] \BYMao H. K, et al. \INScience2922001914.
- [36] \BY Steinle-Neumann G., Stixrude L., Cohen R. E., Gulseren O. \INNature413200157.
- [37] \BYOlijnyk H., Jephcoat A. P., \atqueRefson K. \INEurophys. Lett.532001504.
- [38] \BYSharma D. K., Prakash D., \atqueUpadhyaya S. C. \INCan. J. Phys.72199461.
- [39] \BYVoc̆adlo L. Personal communication.
- [40] \BYHuang E., Bassett W. A.,\atqueTao P. INHigh-Pressure Research in Mineral Physics, edited by M. H. Manghnani and Y. Siono, Terra Scientific, Tokyo, Japan1987165
- [41] \BYVoc̆adlo L. et al. \INPhys. Earth Planet. Inter.1172000123.
- [42] \BYKatiyar R. S., Ryan J. F., \atqueScott J. F. \INPhys. Rev. B419712635.
- [43] \BYGoncharov A. F., Struzhkin V. V., Mao H. K., \atqueHemley R. J. \INPhys. Rev. Lett.8319991998.
- [44] \BYGoncharov A. F. et al. to be published.
- [45] \BYSteinle-Neumann G. Personal communication.
- [46] \BYCohen R. E. Personal communication.
- [47] \BYWallace D. C. \INPhys. Rev.1391965A877.
- [48] \BYIpatova I. P. \atqueSubashiev A. V. \INSov. Phys. JETP391974349.
- [49] \BYPonosov Y. S. \atqueBolotin G. A. \INPhys. stat. sol. (b)2151999137.
- [50] \BYBrandes E. D. Ed. \INSmithells Metals Reference Book, Butterworth, London1983.
- [51] \BYManghnani M. H., Katahara K., \atqueFisher E. S. \INPhys. Rev. B919741421.
- [52] \BYDuffy T. S. et al. \INPhys. Rev. B60199915063.
- [53] \BYChu C. W., et al. \INPhys. Rev. B11970214.
- [54] \BYLifshitz I. M. \INSov. Phys. JETP1119601130.
- [55] \BYHemley R. J. et al. \INPhys. Rev. B39198911820.
- [56] \BYHanfland M. \atqueSyassen K. \INJ. Appl. Phys.5719852752.
- [57] \BYXu J. \atqueMao H. K. \INScience2902000783.
- [58] \BYVohra Y. K., Duclos S. J., \atqueRuoff A. L. \INPhys. Rev. B3619879790.
- [59] \BYNagamatsu J., Nakagawa N., Muranaka T., Zenitani Y., \atqueAkimitsu J. \INNature410200163.
- [60] \BYHinks D. G., Claus H., Jorgensen J. D. \INNature4112001457.
- [61] \BYKortus J., Mazin I. I., Belashchenko K. D., Antropov V. P., \atqueBoyer L. L. \INPhys. Rew. Lett.8620014656.
- [62] \BYAn J. M., Pickett W. E. \INPhys. Rew. Lett.8620014366.
- [63] \BYKong Y., Dolgov O. V., Jepsen O., \atqueAndersen O. K. \INPhys. Rev. B642001020501.
- [64] \BYYildirim T. et al. \INPhys. Rev. Lett.872001037001.
- [65] \BYBohnen K. -P., Heid R., \atqueRenker B. \INPhys. Rev. Lett.8620015771.
- [66] \BYLoa I. \atqueSyassen K. \INSolid State Commun.1182001279.
- [67] \BYBordet P. et al. \INPhys. Rev. B642001172502.
- [68] \BYGoncharov A. F. et al. \INPhys. Rev. B642001100509.
- [69] \BYGoncharov A. F. et al. Preprint cond-mat/0106058 at http://xxx.lanl.gov.
- [70] \BYStruzhkin V. V. et al. Preprint cond-mat/0106576 at http://xxx.lanl.gov.
- [71] \BYAleksandrov I. V., Goncharov A. F., Stishov S. M. \INSov. Phys. JETP Lett.441986611.
- [72] \BYSherman W. \INJ. Phys. C: Solid St. Phys.13 19804601; \INJ. Phys. C: Solid St. Phys.1510829.
- [73] \BYTakemura K. \INPhys. Rev. B5619975170.
- [74] \BYFast L. et al. \INPhys. Rev. Lett.7919972301.
- [75] \BYTakemura K. \INPhys. Rev. B6019996171.
- [76] \BYSteinle-Neumann G., Stixtrude L. \atqueCohen R. E. \INPhys. Rev. B632001054103.