Compact phases of polymers with hydrogen bonding
Abstract
We propose an off-lattice model for a self-avoiding homopolymer chain with two different competing attractive interactions, mimicking the hydrophobic effect and the hydrogen bond formation respectively. By means of Monte Carlo simulations, we are able to trace out the complete phase diagram for different values of the relative strength of the two competing interactions. For strong enough hydrogen bonding, the ground state is a helical conformation, whereas with decreasing hydrogen bonding strength, helices get eventually destabilized at low temperature in favor of more compact conformations resembling -sheets appearing in native structures of proteins. For weaker hydrogen bonding helices are not thermodynamically relevant anymore.
pacs:
61.41.+e, 05.70.Fh, 64.60.Cn, 87.15.AaThe collapse of a self-avoiding flexible polymer chain in a “bad” solvent has been studied for many years Gro . Following de Gennes seminal work on showing the intimate connection of polymer collapse with tricritical systems DesG , most of the theoretical effort has been concerned with the universal features of the -point, the thermodynamic second order transition between the swollen and the compact phase vander , this last phase being usually regarded as a structureless liquid globule phase Gro . The possibility of more complex behavior in the compact phase has been investigated only recently, revealing the existence, at lower temperatures than the collapse gas-to-liquid transition, of a liquid-to-solid and a solid-to-solid transition Zhou .
On the other hand, protein molecules undergo similar transitions between denatured, molten globule, and native states, which are solid-like structures with a well defined three-dimensional conformation Fersht . The main driving force of protein collapse is believed to be the hydrophobic effect, which shields most of the non-polar side chains in the core of the native protein structure from water Dill . This could indeed be grossly described as a “bad” solvent effect. Yet, native structures of proteins are very peculiar, when compared to typical compact conformations of self-avoiding polymer chains. The benchmark of protein nativeness is perhaps the ubiquitous presence of highly ordered local motifs, called secondary structures, known to be stabilized by hydrogen bonding Pauling .
In this Letter, we propose a minimal off-lattice homopolymer model, where a usual two-body isotropic attractive interaction -mimicking the hydrophobic effect- is competing with a directed attractive interaction mimicking the angular dependence of hydrogen bonding Cre . We consider a chain of beads at positions in the three-dimensional continuum space , with . The chain constraint is enforced strictly, by keeping the distance between consecutive beads along the chain constant and unitary, , for , while no other constraint is considered. We model the hydrophobic effect water by considering a pair-wise attractive square well potential with a hard wall, , with:
| (1) |
where is the hard-core radius of each bead, and is the range of the attractive interaction. In the following we will always consider the case , , as in Zhou .
In order to model hydrogen bonding, we need to break isotropy and favor a preferred direction between the two ‘hydrogen-bonded’ beads. We use the same type of directed interaction proposed by Chen and Kemp Jeff , so that the two planes, each containing one of the two hydrogen-bonded beads and its nearest neighbors along the chain, will both be preferibly orthogonal to the contact vector between them Multibody : , where , and:
| (2) |
where denotes normalized vectors. The directionality degree of hydrogen bonding is controlled by the exponent ; a large value corresponds to a strong ‘directionality’. We have mainly studied the case, since lower values of do not favor protein-like secondary structures in this parametrization.
The interplay between hydrophobic collapse and hydrogen bonding is controlled by the relative strength between the two interactions when the following total Hamiltonian is considered:
| (3) |
Whenever two beads come into contact, i.e. their mutual distance falls within the well, they always gain a negative unitary energy contribution from . A further negative contribution could come from , depending on how well the hydrogen bond is formed between them, ranging from , in the worst case, to , in the best one. Thus, from the microscopic point of view the two energy terms are cooperative. If hydrogen bonding is switched off, , we are back to the usual case of isotropic pairwise attraction considered in Zhou , which yields a compact groundstate with no secondary structures. In the other limit of no hydrophobic interaction, , the ground-state has already been shown to be a long straight helix, when Jeff . Since the ground state differs significantly in the two limiting cases, one should actually expect a non-trivial competition between the two energy terms for intermediate values of , despite the microscopic cooperativity. This competition is induced at a global macroscopic level as a consequence of chain connectivity and excluded volume constraints Glgl . In this Letter, we will focus on its thermodynamic implications.
Our results qualitatively agree with previous work on an analogous lattice model, where hydrogen bonding was mimicked via the introduction of rotating spins BMST . We remark, nonetheless, that the extension of such results to our off-lattice model is higly non trivial, since the geometrical order implicit in the lattice structure could mask or enhance artificially secondary structure formation. As an example, while isotropic compaction of a homopolymer chain on a cubic lattice is sufficient to produce some amount of secondary structure Chan , this is not true for an off-lattice homopolymer Onu ; Greg .
Our aim is to determine, by means of Monte Carlo simulations, the density of states of a polymer chain with the Hamiltonian (3), so that the partition function of a -bead chain at reduced temperature can be easily reconstructed: . We have employed a set of standard moves currently used in simulations of polymer chain; pivot, crankshaft, and reptation moves Sokal . In order to avoid trapping in local energy minima, we have employed a novel simulation method, based on generalized ensemble techniques Jesper . The key notion, using generalized ensembles, is that a proper reweighting of temperature as a function of energy should allow the chain to escape from such energy minima Mult . The method lends itself in a natural way to be formulated within an iterative convergence scheme, and the possibility of properly employing the statistical information from more different steps of such scheme greatly increases its effectiveness Jesper .
Nevertheless, the presence of frustration provides an inherent limitation to such method, since it is based on the knowledge of local properties of the phase space, and the competition between different energy terms results in different regions of the phase space sharing the same total energy but having different local densities of states. This turns out to be the case within our model, causing a very slow convergence to equilibrium. Therefore, we have introduced a finer, two-dimensional representation of the full multi-dimensional phase-space, by identifying a conformation through both its hydrophobic energy and hydrogen bond energy . Our simulation method can be easily adapted in order to compute the density of states as a function of both energy terms. Details on the employed reweighting scheme will be published elsewhere long . In this way, not only convergence to equilibrium is more easily obtained, but the partition function , and hence any other relevant thermodynamic quantity, can now be reconstructed for any given value of the relative strength between the two competing energy terms. The effectiveness of this sampling strategy shows that ther two energy terms serve as relevant order parameters.
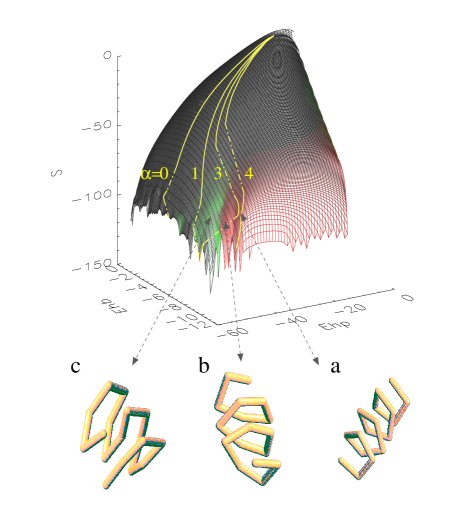
The main result of this work, obtained for a chain with beads, is shown in Fig. . The logarithmic density of states , the microcanonical entropy, is represented as a surface plot in the employed two-dimensional representation of the conformational space. Effective free energy landscapes can easily be reconstructed within the same representation:
| (4) |
where the free energy is given in dimensionless units. The surface plot in Fig. can thus be interpreted as the opposite of the free energy landscape at infinite temperature, so that free energy valleys are seen as entropic ridges. In the phase space region with the lowest values of both energy terms, the entropy surface exhibits a rich yet regular structure, which is going to play a crucial role in determining the thermodynamic properties at low temperature. Three different ridges, separated by non-convex regions of the entropy surface corresponding to free energy barriers, can be identified.
The properties of the conformation ensembles populating such entropic ridges, or free energy valleys, can be readily identified by computing several order parameters, which measure the compactness degree and the amount of secondary structure content. Compactness is usually measured by means of the square gyration radius:
| (5) |
where is the center of mass vector. As for secondary structures, we define the helical content of a conformation as:
| (6) |
and the parallel and antiparallel sheet content similarly:
| (7) | |||||
| (8) |
where , () measures to what extent a hydrogen bond is formed between beads and . Each term in the above sums (6),(7),(8), again between and , measures to what extent the pair can be considered the center of a local portion of a given secondary structure. Within our definitions a simple hydrophobic contact, which is not a good hydrogen bond, does not contribute to secondary structure counting.
As is shown in Fig. , the ridges in the entropy surface are associated, with increasing number of hydrophobic contacts and decreasing number of hydrogen bonds, to helices with beads per turn, to helices with beads per turn, and to sheet-like conformations, respectively. The gyration radius decreases accordingly long , since long straight helices are extended objects. Whereas helices (a) and (b) are indeed representative of the two helical ridges, the sheet-like conformation (c) is just one among many possible different representatives. In this region we expect the occurrance of many different free energy minima, possibly giving rise to glassy behavior. Such frustration is of course not resolved within our bivariate parametrization.
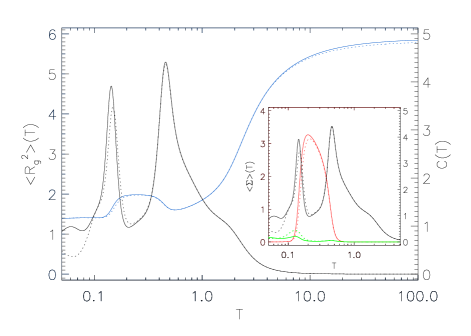
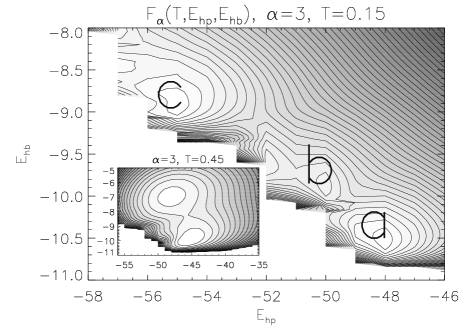
We now discuss in detail the case . The mean square gyration radius , and the specific heat per monomer are shown in Fig. . The behavior of the secondary structure order parameters, and , is shown in the inset. The curves resulting from two different independent simulations are shown; the accuracy is quite good down to temperatures as low as 0.1. The specific heat curve exhibits, with decreasing temperature, one shoulder and two higher and sharper peaks. Specific heat peaks are usually related to a phase transition, but care should of course be taken in generalizing results from such a small system (see e.g. Grass for a detailed discussion of problems arising in finite-size scaling of -collapse). For a finite-size analysis of such transitions, we show the free energy contour plots at the corresponding temperatures in Fig. .
As signalled by the decrease of the gyration radius, the specific heat shoulder is related to the collapse of the chain from the swollen high temperature phase. The first peak close to the shoulder corresponds to a sharp increase of the gyration radius, and is related to the formation of many hydrogen bonds and to the appearance of helical structure, whereas the hydrophobic energy is almost not changed. The free energy contour plot clearly shows the existence of two competing minima, so this globule-to-helix transition is first order. The second peak is marked by a sharp decrease in the gyration radius, and is related to the breaking of helices and to the formation of sheet-like structures, as (c) in Fig. . Sheet-like conformation are compact objects, having less hydrogen bonds but more hydrophobic contacts than helices. This last transition is again first order, as shown in the free energy contour plot. Three different minima are present, originating from the entropic ridges identified in Fig. , but helices with beads per turn (b) never get efficiently populated, since they suffer competition from either side.
The very structure of the specific heat, one shoulder and then two peaks with decreasing temperature, is similar to what is found in the usual case, even if the thermodynamically stable phases are completely different. It is tempting to interpret our results within the same overall framework proposed in Zhou , that is to say with decreasing temperature the chain first undergoes a gas-to-liquid collapse, then a first order liquid-to-solid transition, and finally a solid-to-solid transition which is again first order (in the absence of hydrogen bonding, the last transition is a continuous polymorphic transition Zhou ). In our model, the possibility of hydrogen bonding simply acts in selecting helices and sheets among all possible solid crystalline conformations.
In Fig. we have also summarized the different thermodynamic static properties of the polymer chain when is varied. The yellow lines can be thought of as dynamical trajectories only in the infinitely slow cooling case. Actual dynamics does not take place within the effective free energy landscape (4), since kinetic barriers in the full phase space are smoothed over by the coarse-graining of our representation. This is most likely the case for the helix-to-sheet transition, where we expect the underlying energy landscape to be much more roughed.
All trajectories in Fig. start from a common point at infinite temperature, but then explore different regions of the phase space, according to different strengths of hydrogen bonding. Nevertheless a collapse transition, related to the shoulder in the specific heat, is common to all values, and moreover takes place in all cases for similar values of the competing energies. At lower temperatures, hydrogen bond strength greatly affects the thermodynamic behavior. When , the conformational ensemble populated at low temperature does not include, as expected, the regions of the phase space with a high content of secondary structure. As in Zhou , two further transitions are present, liquid-to-solid and solid-to-solid. If , after the last solid-to-solid transition the sheet-like region of the phase space becomes efficiently sampled at low temperatures. If , as we have already seen, the chain first undergoes a transition from the liquid globule phase to the helical region and then to the sheet-like region. Both transitions are first order. Finally, if , hydrogen bonds are strong enough to produce a helical ground state, as in the case Jeff .
Note that only the marginal border of the ‘green’ sheet-like region is thermodynamically relevant at low temperatures (see also the small increase of the order parameter in Fig. ). It is believed that -helices are more likely to be formed by residues with small side chain groups, whereas the loss in conformational entropy suffered by bigger side chain groups, when arrenged in helical conformation, favors the formation of -sheets Rose . This general picture is consistent with our results. In fact, no side groups are present and helices are indeed entropically favored, since they sit on the top of a ridge in the entropy surface, whereas sheet-like conformations do not.
To summarize, we have introduced a simple model for an off-lattice self-avoiding polymer chain with two competing attractive inteactions, isotropic and directionalized. By means of Monte Carlo simulations we have determined the density of states of the chain within a two-dimensional representation of the phase space, and hence the phase diagram for different values of the relative strength of the two competing energies. If the directionalized interaction is strong enough, different conformational ensembles compete closely with each other at low temperature, which have peculiar proteinlike features, such as helices and sheets.
It is a pleasure to acknowledge enlightening discussions with A. Maritan, C. Rischel, K. Sneppen and G. Tiana.
References
- (1) I. M. Lifshitz, A. Yu. Grosberg, and A. R. Khokhlov, Rev. Mod. Phys. 50, 683 (1978).
- (2) P. G. de Gennes, Scaling Concepts in Polymer Physics (Cornell University Press, Ithaca, New York, 1979).
- (3) C. Vanderzande, Lattice Models of Polymers (Cambridge University Press, Cambridge, 1998).
- (4) Y. Zhou, C. K. Hall, and M. Karplus, Phys. Rev. Lett. 77, 2822 (1996).
- (5) A. R. Fersht, Structure and mechanism in protein science: A guide to enzyme catalysis and protein folding (W.H. Freeman and Company, New York, 1998).
- (6) K. A. Dill, Biochem. 29, 7133 (1990).
- (7) L. Pauling, R. B. Corey, and H. R. Branson, Proc. Nat. Acad. Sci. USA 37, 205 (1951).
- (8) T. E. Creighton, Proteins: Structures and Molecular Properties, (W. H. Freeman, New York, 1993).
- (9) A proper tracing out of the solvent molecules degrees of freedom would indeed yield a temperature dependent pair-wise potential. We neglect such temperature dependence for the sake of simplicity, as is usually done in similar studies Zhou .
- (10) J. P. Kemp, and Z. Y. Chen, Phys. Rev. Lett. 81, 3880 (1998).
- (11) Note, that isotropy breaking involved in hydrogen bond formation introduces effective multibody correlations.
- (12) See V. G. Rostiashvili, G. Migliorini, and T. A. Vilgis, Phys. Rev. E 64, 051112 (2001), for a discussion of how disorder and frustration are effectively self-generated in a polymer compact globule, being related to virial coefficients of different signs.
- (13) J. Borg, M. H. Jensen, K. Sneppen, and G. Tiana, Phys. Rev. Lett. 86, 1031 (2001).
- (14) H. S. Chan, and K. A. Dill, Proc. Natl. Acad. Sci. USA 87, 6388 (1990).
- (15) L. M. Gregoret, and F. E. Cohen, J. Mol. Biol. 219, 109 (1991).
- (16) N. D. Socci, W. S. Bialek, and J. N. Onuchic, Phis. Rev. E 49, 3440 (1994).
- (17) A. D. Sokal, Nucl. Phys. B, Suppl. 47, 172 (1996).
- (18) J. Ferkinghoff-Borg, Eur. Phys. J. B, 29, 481 (2002).
- (19) U. H. E. Hansmann, and Y. Okamoto, J. Comput. Chem. 18, 920 (1997).
- (20) A. Trovato, and J. Borg (in preparation).
- (21) P. Grassberger, and R. Hegger, J. Chem. Phys. 102, 6881 (1995).
- (22) T. P. Creamer, and G. D. Rose, Proc. Nat. Acad. Sci. USA 84, 5937 (1992).