NMR study of the superconductor
Abstract
NMR spectra and nuclear spin-lattice relaxation time, , have been measured in polycrystalline with a superconducting transition temperature = 39 K in zero magnetic field. From the first order and second order quadrupole perturbed NMR spectrum a quadrupole coupling frequency = 222.0(1.5) kHz is obtained. sK and Knight shift ppm are temperature independent in the normal conducting phase. The Korringa ratio equals to 0.95 which is very close to the ideal value of unity for s-electrons. The comparison of the experimental , , and with the corresponding values obtained by LDA calculations shows an excellent agreement for all three quantities.
pacs:
74.70.Ad, 74.25.Jb, 74.25.Nf, 76.60.Cq, 76.60.-kThe recent discovery of superconductivity in with remarkably high = 39 K Nagamatsu has attracted much attention. In particular the observation of a sizeable boron Budko isotope effect strongly suggests that this simple layered intermetallic compound belongs to the conventional family of phonon mediated BCS superconductors. The relevant electron-phonon coupling constant is proportional to the density of states (DOS) at the Fermi level. So it is important to have experimental data of this quantity in .
Nuclear magnetic resonance (NMR) in metals probes the DOS at the Fermi level. The measured quantities, the spin lattice relaxation rate, 1/, and the Knight shift, , are related to the electron spin susceptibility () of electrons close to the Fermi level, specifically , and . In case the atomic site symmetry in the crystal structure is less than cubic and the atom has a nuclear quadrupole moment as it applies for Mg and B in , quadrupolar disturbed NMR delivers in addition valuable information on the electric field gradient (EFG) at the specific nuclear site. Unlike 1/ and the EFG is determined by the distribution of all charges. Up to date only measurements of 1/, , and of the quadrupole coupling to the EFG, expressed by quadrupole coupling frequency , of were performed Kotegawa ; Gerashenko ; Jung ; Tou . While there is reasonable agreement among ’s and relaxation rates, there is a considerable controversy concerning the Knight shifts. While some authors Gerashenko report in the normal conducting state a small temperature independent isotropic shift of 175 ppm, others Jung report a smaller and even temperature dependent shift of approximately 60 ppm, which they attribute to the Fermi-contact interaction. Finally there is also a report Tou of a negative shift of mere 5 ppm attributed to the core polarization. These large discrepancies most likely come from the choice of different materials as references for the Knight shift, as well as from difficulties to measure the small Knight shift of a broad and in addition quadrupolarly shifted central line powder spectrum.
As far as we know, there are no experimental data concerning the NMR quantities at the Mg site in , although theoretical predictions based on ab initio local density approximation (LDA) calculations exist for Mg Knight shift, 1/ and EFG Pavarini ; Tsvyashchenko . To some degree the lack of experimental Mg NMR data is understandable considering the fact that the only NMR active isotope has a small magnetic moment and low natural abundance. Consequently the NMR signals are weak even in high magnetic fields. Their detection often demands prohibitively long signal accumulation times. Despite this handicap we were able to measure NMR of the naturally abundant in . Here we report the temperature dependence of Knight shift, spin-lattice relaxation time, and quadrupole coupling frequency of in . We compare the experimental results with the theoretical predictions and we find for all three Mg NMR quantities an excellent agreement. Since all calculations were done by state of the art LDA methods the good agreement between calculated and measured NMR quantities confirms the LDA as a good approximation for .
The sample was prepared using stoichiometric amounts of magnesium and boron (99 and 99.99, respectively) in a form of powder. Both components were thoroughly mixed and pressed into pellets. These were placed in a tantalum crucible equipped with a non-vacuum tight cover. The crucible was then sealed under vacuum in a quartz ampoule. The sample was synthesized during heating at 600, 800 and 900 ∘C for one hour at each temperature. X-ray diffraction (XRD) has revealed only small amount of as an impurity phase. DC magnetization measurements (Fig. 1) in a magnetic field of 1 mT (ZFC) yield a transition temperature of 39 K.

Before we proceed let us first present a few NMR relevant characteristics of the isotope. The isotope’s natural abundance is 10.0 and its nucleus has spin 5/2, a gyromagnetic ratio , and a quadrupole moment web elements . NMR measurements were performed on a polycrystalline powder sample with a pulsed Fourier-transform spectrometer at an external magnetic field T. Fig. 2 presents the central line powder spectrum gained by Fourier transform of the free induction decay signal induced by a -pulse.
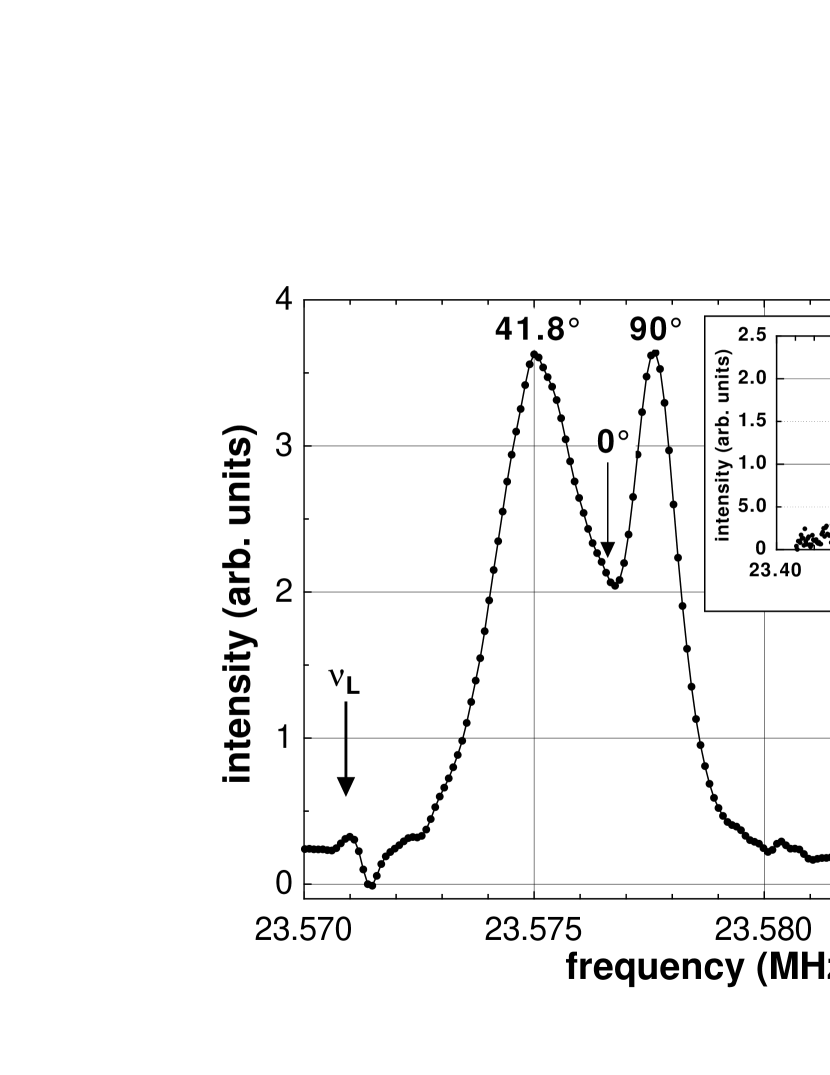
The spectrum shows the typical powder pattern of the central transition line of a spin 5/2 system whose levels are disturbed in second order by quadrupole coupling to an axially symmetric EFG. There are two peaks in the spectrum with an indication of a washed out step left and close to the minimum between the peaks. The three features from left to right (see Fig. 2) are the extrema singularities that occur at three powder grain orientations having either , or . Here represents the angle between the largest principal component, , of the EFG tensor and the magnetic field direction. Due to the site symmetry the EFG tensor at Mg and B sites is axially symmetric along the c-axis. Therefore its points into the c-axis direction. From the distance between the two peaks in the spectrum and by help of the second order quadrupole effect expression Abragam
we can calculate , defined as
Having kHz and Larmor frequency MHz, as determined by NMR from in water solution, one gets kHz. In addition we were able to see the singularities of the first satellites in the satellite powder spectrum presented in the insert of Fig. 2. From the separation of the two first satellite singularities, that are positioned symmetrically with respect to the central line , one gets immediately . For an axially symmetric EFG is simply equal to this separation. The gained kHz agrees very well with the above result. The second result, however, is always more reliable especially in case when the additional Knight shift of the spectrum is anisotropic. Since for there is no quadrupole shift of the central line the step in the spectrum can be used to determine the Knight shift, , of the crystallites whose c-axis is parallel to the magnetic field. From the shift of the step with respect to we get then ppm. Further we noticed that the ratio of the distances of the and singularities with respect to the step is somewhat less than the value 16/9 theoretically expected for an isotropic magnetic shift of the central line powder spectrum. This allows the conclusion that the Knight shift has to be slightly anisotropic. The Knight shift, , for crystallites whose c-axis is perpendicular to must be a bit larger than . We estimate the difference between and to be about +10 ppm. In the normal conducting phase from 294 K down to 19 K we observe that the Knight shift (see Fig. 3) and = 222.0(1.5) kHz remain in error bar limits constant.
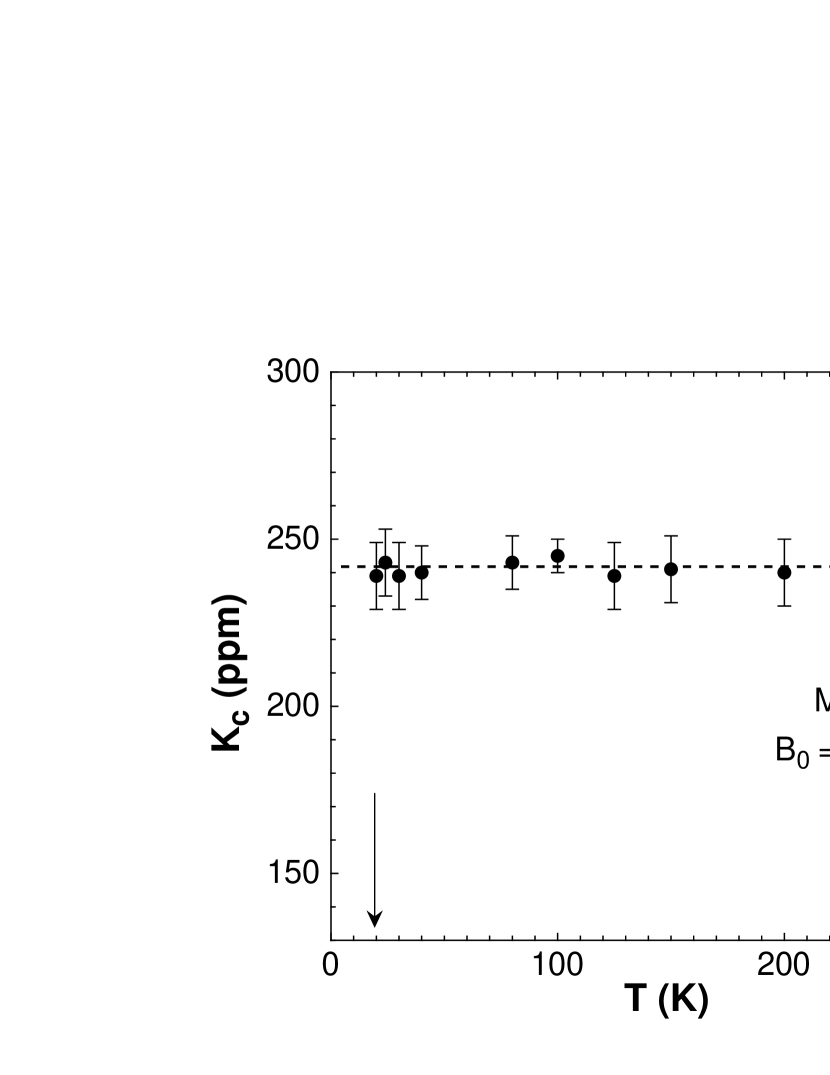
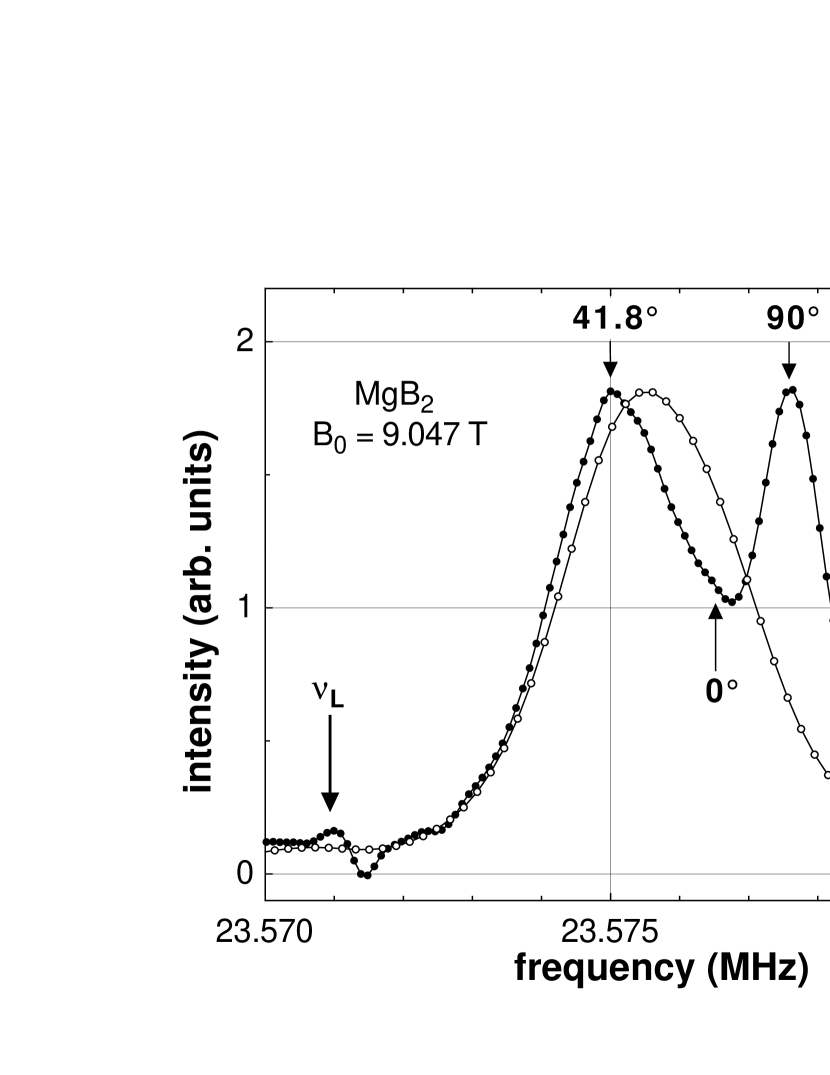
Such a behavior was also observed for Knight shift Gerashenko and Gerashenko ; Jung . At 19 K the shape of the Mg central line spectrum changes drastically . The peak of the singularity starts to diminish and disappears quickly by cooling below 19 K. In Fig. 4 we exhibit two central line spectra one measured at 6 K and the other one at 294 K that have their intensities scaled to equal height for easier comparison. The peak of the singularity seen in the high temperature spectrum obviously is missing in the 6 K spectrum. We explain this by the appearance of superconductivity in the grains with their c-axis close to the direction perpendicular to the external magnetic field. Nevertheless, a substantial part of the spectrum coming from crystallites with a smaller remains unchanged down to 6 K. This indicates that in a magnetic field of 9 T at 6 K a substantial part of the powder sample still remains normal conducting. In view of the large anisotropy quoted in the literature (2 – 9) LimaPatnaikSimon this comes not as a surprise.
However, this has consequences for the determination of NMR quantities and their temperature dependence in the superconducting phase. Necessarily one has to take into account the anisotropy and avoid to average over the NMR signals coming from crystallites with different orientations in the magnetic field. For reliable NMR measurements in the superconducting state large enough single crystals or aligned crystallites of are most desirable.
The measurements of the NMR quantity were done by the method of selective inversion of the central line and a subsequent monitoring of the nuclear magnetization recovery at variable delay times t. The relaxation rate defined as , where W represents the spectral density of the fluctuating internal magnetic fields, was extracted by fitting the data to the recovery law
obtained from the solution of the master equation for a spin 5/2 system in case of magnetic relaxation and selective excitation of the central line AndrewSuter . The constant , also a fit parameter, depends on the inversion ratio of the central line. We measured only in the normal conducting phase at three temperatures 30, 80 and 294 K. The results are presented in Table 1. As expected for a metal the product remains constant. The weighted average of the three values is sK.
| T(K) | T1(s) | T1T(sK) |
|---|---|---|
| 30 | 35(1.6) | 1050(50) |
| 80 | 13.5(6) | 1080(50) |
| 294 | 4.35(34) | 1280(100) |
What is the dominant mechanism of magnetic relaxation and Knight shift of Mg and B in ? In most metals it is the Fermi-contact interaction of the nucleus with the s-electrons at the Fermi level. However, in case of the states near the Fermi level are mainly boron p-electron states with a very small contribution of the s-electrons. Pavarini et al. Pavarini making ab initio LDA calculations of 1/ and at and sites in show that the dominant relaxation mechanism at the nucleus is the interaction with the electronic orbital moment. For the nucleus, however, they predict that the dominant relaxation mechanism is the Fermi-contact interaction, which also dominates the Mg Knight shift. They get for sK, ppm, and ppm which is in excellent agreement with our experimental values sK, ppm, and ppm. Forming the Korringa ratio Carter we get experimentally , where sK for , with and the gyromagnetic ratios for electron and nucleus, respectively. The observed experimental Korringa ratio of 0.95 is very close to the ideal value of unity for s-electrons. This result is another confirmation that the Fermi-contact interaction is indeed the dominant mechanism responsible for relaxation and Knight shift at the Mg site.
As next we compare the experimentally determined major principal component, , of the EFG tensor at the Mg site with calculated ab initio within the density functional theory by Tsvyashchenko et al. Tsvyashchenko using the full-potential linearized augmented plane wave method. From the experimentally determined and by use of the quadrupole moment we extract the absolute value V/m2 . The quadrupole coupling to the EFG and therefore do not depend on the sign of . The gained experimental has then to be compared to the absolute value of the calculated V/m2 Tsvyashchenko . We note that the agreement of both absolute values is excellent. Tsvashchenko et al. Tsvyashchenko also calculated at the boron site where they get V/m2 which again is in good agreement with the experimental value V/m2 Gerashenko ; Jung . The ability to reproduce the experimental NMR quantities at both Mg and B sites by LDA calculations certainly strengthens the confidence into the LDA approach to calculate other material parameters.
The authors acknowledge useful discussions with M. Angst. The work was supported in part by the Swiss National Science Foundation.
References
- (1) J. Nagamatsu, N. Nagakawa, T. Muranaka, Y. Zenitani, and J. Akimitsu, Nature (London) 410, 63 (2001).
- (2) S.L. Bud’ko, G. Lapertot, C. Petrovic, C.E. Cunningham, N. Anderson, and P.C. Canfield, Phys. Rev. Lett. 86, 1877 (2001).
- (3) H. Kotegawa, K. Ishida, Y. Kitaoka, T. Muranaka, and J. Akimitsu, cond-mat/0102334.
- (4) A. Gerashenko, K. Mikhalev, S. Verkhovskii, T. D’yachkova, A. Tyutyunnik, and V. Zubkov, cond-mat/0102421.
- (5) J.K. Jung, S.H. Baek, F. Borsa, S.L. Bud’ko, G. Lapertot, and P.C. Canfield, Phys. Rev. B 64, 12514 (2001).
- (6) H. Tou, H. Ikejiri, Y. Maniwa, T. Ito, T. Takenobu, K. Prassides, and Y. Iwasa, cond- mat/0103484.
- (7) Eva Pavarini and I.I. Mazin, Phys. Rev. B 64, 140504 (2001).
- (8) A.V. Tsvyashchenko, L.N. Fomicheva, M.V. Magnitskaya, E.N. Shirani, V.B. Brudanin, D.V. Filossofov, O.I. Kochetov, N.A. Lebedev, A.F. Novgorodov, A.V. Salamatin, N.A. Korolev, A.I. Velichov, V.V. Timkin, A.P. Menushenkov, A.V. Kuznetsov, V.M. Shabanov, and Z.Z. Akselrod, Solid State Comm. 119, 153 (2001).
- (9) http://www.webelements.com/
- (10) A. Abragam, The principles of nuclear magnetism (Clarendon, Oxford, 1961).
- (11) O.F. de Lima, R.A. Ribeiro, M.A. Avila, C.A. Cardoso, and A.A. Coelho, Phys. Rev. Lett. 86, 5974 (2001); S. Patnaik, L.D. Cooley, A. Gurevich, A.A. Polyanskii, J. Jiang, X.Y. Cai, A.A. Squitieri, M.T. Naus, M.K. Lee, J.H. Choi, L. Belenky, S.D. Bu, J. Letteri, X. Song, D.G. Schlom, S.E. Babcock, C.B. Eom, E.E. Hellstrom, and D.C. Larbalestier, Supercond. Sci. Technol. 14, 315 (2001); F. Simon, A. Jánossy, T. Fehér, and F. Murányi, Phys. Rev. Lett. 87, 47002 (2001); G. Papavassiliou, M. Pissas, M. Fardis, M. Karayanni, and C. Christides, cond-mat/0107511.
- (12) E.R. Andrew and D.P. Tunstall, Proc. Phys. Soc. London 78, 1 (1961); A. Suter, M. Mali, J. Roos, and D. Brinkmann, J. Phys.: Condens. Matter 10, 5977 (1998).
- (13) G.C. Carter, L.H. Bennet, and D.J. Kahan, Metallic Shifts in NMR, Progress in Material Science Vol. 20 ( Pergamon Press, Oxford, 1977).