Adaptive Random Walks on the Class of Web Graphs
Abstract
We study random walk with adaptive move strategies on a class of directed graphs with variable wiring diagram. The graphs are grown from the evolution rules compatible with the dynamics of the world-wide Web [Tadić, Physica A 293, 273 (2001)], and are characterized by a pair of power-law distributions of out- and in-degree for each value of the parameter , which measures the degree of rewiring in the graph. The walker adapts its move strategy according to locally available information both on out-degree of the visited node and in-degree of target node. A standard random walk, on the other hand, uses the out-degree only. We compute the distribution of connected subgraphs visited by an ensemble of walkers, the average access time and survival probability of the walks. We discuss these properties of the walk dynamics relative to the changes in the global graph structure when the control parameter is varied. For , corresponding to the world-wide Web, the access time of the walk to a given level of hierarchy on the graph is much shorter compared to the standard random walk on the same graph. By reducing the amount of rewiring towards rigidity limit , corresponding to the range of naturally occurring biochemical networks, the survival probability of adaptive and standard random walk become increasingly similar. The adaptive random walk can be used as an efficient message-passing algorithm on this class of graphs for large degree of rewiring.
pacs:
PACS numbers: 05.40.Fb, 89.20.Hh, 89.75.DaI Introduction
It has been recognized recently that the key role in the dynamics of complex systems is played by the evolving networks of various structures [2, 3]. Evolution of complex networks representing catalytic reactions, cell metabolic processes, relaxation in disordered systems, protein folding, and realistic ecological, social, and information networks [2, 3, 4, 5, 6, 7, 8, 9] are guided by variety of principles inherent to each particular network. Technically, the study of the evolving networks includes theory of graphs, as opposed to regular lattices, which are appropriate mathematical objects in the study of driven cellular automata with diffusive dynamics [10]. Both, the dynamics of nodes and arcs (links) contribute to the evolution of the network. Thus, network growth implies that a complex architecture of links emerges, which is peculiar to the network, as an effect of the individual microscopic rules at work.
Many complex networks self-organize into a scale-free structures of links (for a recent review see [3]). The appearance of a scale-free structure is not accidental, having that networks grow from stochastic rules, that assumes certain degree of disorder on the microscopic scale. This rules result in the occurrence of dynamic fractal structures on the growth time-scale [11], which is then manifested in the emergent hierarchical organization of node degrees at large evolution times. In growing networks the preference attachment such as in socially motivated linking, e.g., in science citation network [8], was shown to be one of dominant mechanisms [12] leading to the scale-free structure of links [3, 13]. However, in many other growing networks the preference attachment alone has no capacity to take into account the intimate relationship between structural complexity of the networks and their evolution. This implies dynamically changing wiring diagram, in sharp contrast to the rigid link structure in the science citation network, for example. Here we concentrate on this type of networks with the world-wide Web as a prominent example, in which constantly updated links yield rapidly changing wiring diagram [2, 11].
On the other hand, the occurrence of various universality classes—characterized by the same scaling exponents—suggests that only certain details of the microscopic dynamics are relevant for the universal scaling behavior of complex networks, in analogy to critical behavior in physical systems in equilibrium [14]. Although the theoretical background of the universality in complex dynamic systems and networks is still missing, numerical simulations on specific models [11] and master equation calculations [15, 16, 17, 18] suggest that the following local properties (alone or in the appropriate combinations) of the dynamics are relevant for the emergent universal behavior: (a) Directed vs symmetric links (looked from a node in the network); (b) Fixed vs variable wiring diagram and time scale of its variations compared to the growth time scale; (c) Type of preference linking; and (d) Presence of constraints in the microscopic growth rules [19].
Recently we have introduced a model of growing directed graph with bias updates and biased attachment of links, motivated by the conduct of agents in the real world-wide Web [11]. It was shown that the model captures minimum relevant properties for the dynamics of the Web, leading to a satisfactory quantitative comparison of the universal scaling quantities with the ones measured in the real Web [9]. The relevant control parameter of the model , defined as the average ratio of updated and added links per time step (thus measuring the degree of rewiring in the graph) can vary in the range .
The dynamic processes such as random walk specifically designed to the Web graphs reveal important information on network’s relaxation upon triggering and suggest how these networks can be efficiently explored. In Ref. [20] we introduced a random walk with adaptive walk strategy, that utilizes the locally available information on the underlying graph structure. In previous works [11, 20] we have discussed the structure and dynamics of the world-wide Web, representing a directed graph in this class with rapidly changing wiring diagram: Estimated [11] value of from the scaling agreement with the observed behavior [9].
In this work we extend the study to the entire class of graphs generated by varying the control parameter in the physical range . In the limit of extreme rewiring () some of the scaling features of the class disappear. On the other end, for the graph undergoes a rigidity transition, where majority of links in the graph remains fixed in time. Among the networks between these two limits are the world-wide Web and networks representing a potential range of naturally occurring metabolic networks and catalytic reactions in open environment [21]. Specifically, we study (1) how the global graph structure varies with the control parameter in the entire range before the rigidity transition, and (2) how these structural properties influence the relaxation of the network and the dynamics of the random walk with variable walk strategies. In addition, study of the random-walk dynamics reveal how the local clusters participate in the global behavior of the graph. We briefly discuss the potential application of the random-walk path in communication processes on these class of graphs.
The organization of the paper is as follows: In Sec. II we present the growth rules of the class of Web graphs. We grow large networks of nodes to determine the distributions of out- and in-degree for the range of values of the control parameter . In Sec. III we define the adaptive random walk on this class of graphs and study the structure of connected subgraphs scanned by an ensemble of such walkers, which we then compare with the statistics of a standard random walk on the same graphs. In Sec. IV we determine the survival probability distribution of these two types of random walk and their access time to a given hierarchy level. Sec. V is devoted to a short summary and conclusions.
II Growth and Structure of the Web Graph
A directed Web graph is grown from the dynamic rules proposed in Ref. [11], which are based on the criteria (a)–(c) listed above. (Potential effects of aging and other constraints on the microscopic dynamic rules are left out of this work). A growth step is defined by adding a node and subsequently creating and/or removing links in the entire network, that results in total increment links at time step . Naturally, we take , suggesting that, in the average, the number of links increase at each time step. The links are updated in the following way. An outgoing link originates from a node with the probability
| (1) |
which is determined by the number of outgoing links previously created at that node. The link points towards the node with the probability
| (2) |
where is the current number of incoming links collected at target node up to the step . It is assumed that at the time of addition of a node to the network . In addition a fraction of new links are outgoing links from the new added node . Whereas the remaining links are the updated links at preexisting nodes in the network. Hence, the relevant parameter in the model is the ratio of updated and added links at each time step, i.e., , (independent of the actual increment ), which measures the degree of rewiring (or flexibility) of the graph. The Eqs. (1)-(2) are motivated by the conduct of the agents who create links in the real Web: A new link is is likely to be created by the most active agents in the network, and, similarly, the most probable target node will be the one that already attracted many links. For consistency, we use throughout this work [22].
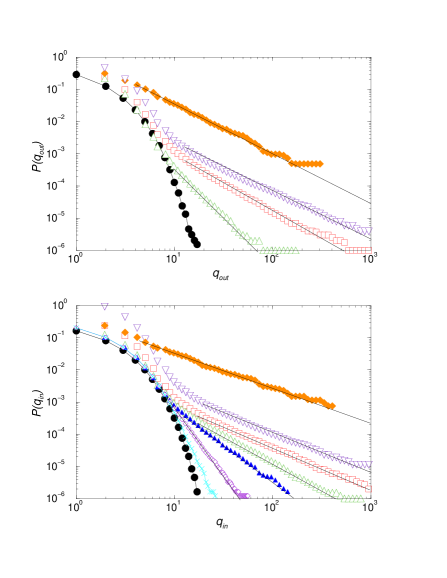
The numerical simulations in Ref. [11] demonstrated that the rules in Eqs. (1)-(2) are compatible with the observed scaling behavior of the real Web, when the single control parameter is set to a given value , corresponding to within estimated error bars. The dynamically emerging out- and in-degree cumulative distributions are given by the power-law functions
| (3) |
in the asymptotic region for large number of links (i.e., large networks). The distributions are given in Fig. 1 for various values of the control parameter, showing the -dependent scaling exponents and .
The asymptotic scaling behavior of the in-degree distribution that is generated by the shifted-linear preference rule in Eq. (2) with was proved exactly in Ref. [15], that agrees completely with our results in Fig. 1. Recently, a similar analysis using rate equation approach was done in Ref. [17] for a directed graph in which in addition the probability of creating a link from the preexisting node to node depends on the out-degree of the node and in-degree of the target node . It was demonstrated that when is given by a product of two shifted-linear functions of the corresponding degrees, the emergent distributions of in- and out-degree are power-law type and statistically correlated [17]. According to the above rules in Eqs. (1)-(2), the probability for link creation in our model is , which is exactly the type of function compatible with a double-power law distributions for out- and in-degrees, in agreement with numerical results in Fig. 1. Emergence of statistical correlations between in- and out-degree distributions is discussed in Ref. [11]. The model of Ref. [17] is slightly different from ours, involving three parameters that can not be reduced to a single control parameter, making it difficult to extract an exact value of the exponent in terms of our control parameter (or ). The observed behavior shown in Fig. 1 suggests that increases approximately linearly with for (i.e., ). However, increases rapidly in the region below , suggesting that the distribution of out-degree becomes exponential when the rigidity of the graph increases towards a finite critical value. Note that in the ideally rigid graph the out-degree distribution is trivial: each node has exactly links that remain fixed in time.
Study of the distribution of connected components done in Ref. [11] suggests that for larger than some critical value a giant connected component occurs, similar to the real Web [9]. By decreasing the control parameter the network structure changes gradually, eventually undergoing the phase transition into a structure without a giant component [11]. The critical value of depends on the network size and in the cases studied here it is close to . Loss of scaling in the out-degree distribution at , while the in-degree still exhibits scaling behavior, demonstrates the power of cooperation in the network: Although the rules (1) and (2) formally look alike, the dynamical variations in are due to local force, whereas the increase of with time is made by a collective effect. Consequently, certain dynamical processes which are related to the out-degree structure might change their character before the network becomes rigid. Next we study random walk processes on this class of graphs.
III Random Walks with Variable Strategy
We define two types of the random walks: a standard random walk, and a walk that learns its strategies from the information stored at a visited node on the graph, as defined below. First we grow the graph of nodes using the rules in Eqs. (1)-(2), and then start a walk from a randomly selected node, say node . In the simple case, here called a naive random walk (NRW) for the reason to be clear soon, the walker moves along one of the outgoing links of that node, selecting the link with equal probability
| (4) |
where we write , assuming for simplicity that the network does not grow during the walk time. In this way the walker selects a target node, say , and moves there making one time step of the walk. Note that this standard random walk on the graph of the structure given in Eq. (3) is more complex compared to the case of hierarchical graphs with a constant branching ratio, in that it moves in an environment with variable structure of the relevant out-degree. An adaptive random walk (ARW), on the other hand, makes move selections with the statistical weight, which is correlated with the linking strategies of the visited node. In this case we assume that a link from node to node has a weight defined by
| (5) |
where is given in Eq. (2) with the normalization indicated in Eq. (5). Hence, the adaptive random walker uses the same type of strategy that was used earlier by the visited node, thus moving preferably along “hot” links of the visited node. Note that the probability is not identical to both because it is evaluated at a later time and it is normalized. In this way, the adaptive walker exploits full information about local graph structure, which is done by the out-degree of the visited node and in-degrees of all with that node connected target nodes [23]. The naive random walker, on the contrary, uses only the first part of information. As a quantitative measure of different move strategies it is useful to consider the first-step statistics [24]. We show in Fig. 2 the comparative statistics of the first jump of an ensemble of walkers with the naive and adaptive strategies, respectively, simulated on the same graph and using the same set of random numbers. It is shown in Fig. 2 that an adaptive search of the direction by the first jump is guided by the graph structure: the slope of the distribution of the first-jump distances (measured in node ranks) resembles the in-degree distribution. For the ensemble of this size the out-degree distances made in the first jump are correlated with the in-degree distances in view of Eq. (5). In the random search the distribution is still a power-law, however, the graphs structure is much less recognized (slope of the distribution of the first jumps is by one lower than the in-degree distribution of the graphs). Also much weaker, if any, correlations between in- and out-degree distances are observed. The walker continues as long as it is visiting nodes with nonzero number of out-links .
A Structure of connected subgraphs
A non-interrupted walk scans a set of connected nodes on the graph. The set of visited nodes is thus a connected subgraph smaller than a connected component that is usually searched by the Web crawl [9, 11]. An ensemble of random walkers thus can be used to scan the local structure of connected subgraphs, which in principle differs from the global graph structure.
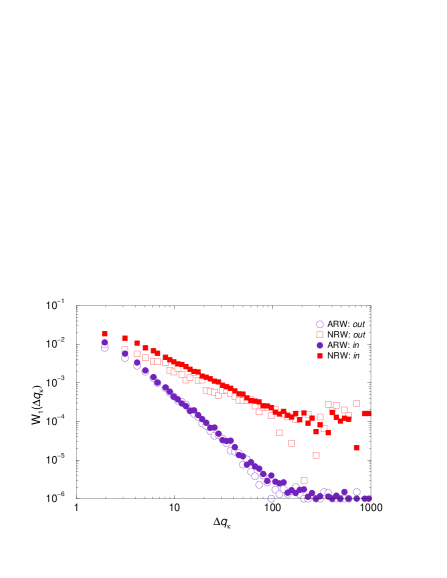
The “distance” traversed by the walker on the graph is best measured in the node-rank differences, i.e., distance in the levels of hierarchy, in which the graph structure is nontrivial. Spatial distribution of nodes is, in principle, random, whereas the temporal fractal structure [11] occurs on the growing time scale. In Fig. 3 we show the time-integrated probability distributions of the node-rank distances for adaptive random walk on the graph with nodes and varying the control parameter . An ensemble of walkers was employed. In Fig. 4 the corresponding distributions obtained by the ensemble of naive random walkers are shown that are simulated in the same conditions as the adaptive random walkers in Fig. 3.
The distributions of connected subgraphs found both by the ensemble of adaptive, , and the ensemble of naive, , random walkers are power-law type ():
| (6) |
Distinction between the respective distributions for in- and out-degree distances are resembling the underlying graphs structure. On the other hand, the difference in the scaling exponents, for instance in and and similarly with and suggest that ARW and NRW are two qualitatively distinct types of processes. Namely, both and , whereas and indicating that the average distance in the case of the naive random walk diverges [25] with at , whereas the adaptive random walk remains in the confined areas-distances, when . These properties have important consequences, for instance for the disease spreading [26] along the random walk path on the graph.
In the case of ARW the similarity between the and and the corresponding distributions in Fig. 1 in the scaling region is striking. By increasing the probability of a link outcoming from the new-added node, fast decrease of the distribution in Fig. 3 makes the exponent difficult to measure for . At a crossover value close to the distribution approaches the exponential form. At all nodes have exactly one out-link, rendering this distribution trivial.
IV Survival and Access Time of the Walk
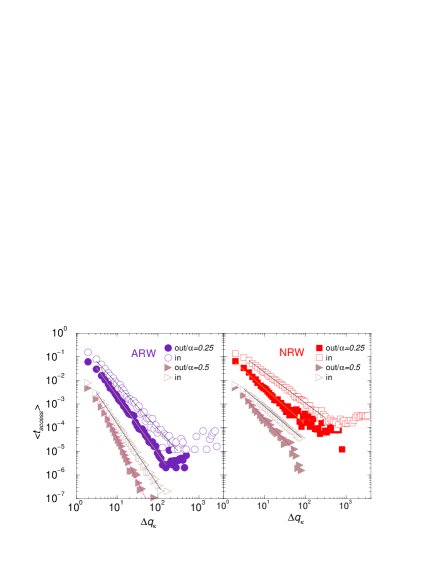
Next we study the survival probability of a walk and the average access time of a walker to a given level of hierarchy. These properties are relevant for the relaxation of the graph and message passing to a given distance in hierarchy on the graph, respectively.
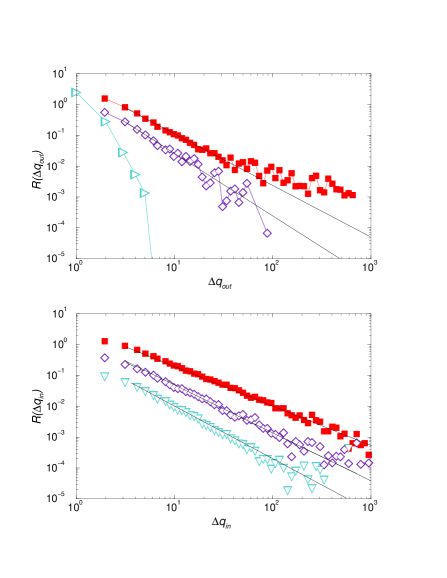
The access time is defined as a number of steps necessary for a walker to make a given distance here measured in the difference of the hierarchy levels of the departing and accessed node. In Fig. 5 the average access time normalized to the size of the ensemble is plotted against the difference in the hierarchy levels between departing and visited nodes for two values of the parameter and distances measured both by in- and out-degree. A remarkable feature is the power-law behavior of the access time [20]. In general, the scaling form
| (7) |
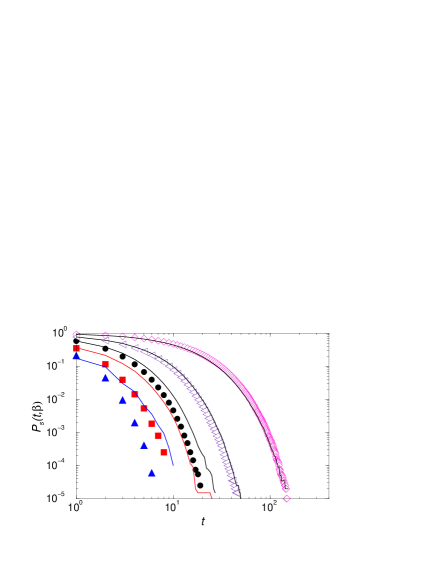
applies both for adaptive and naive random walks when is large. However, the exponents ( stands for “in,A” and “out,A” for the adaptive and similarly “in,R” and “out,R” for random walk) are both larger than 2 in the case of the adaptive search of the destination, whereas for the naive random walk. Hence, apart from the small distances, the average access time of the adaptive random walk is much shorter compared to the standard random walk. This makes the adaptive random walk a good basis for its potential application as an efficient algorithm [27] for message-passing to a given level of hierarchy. In the case of catalytic reactions, this property of the adaptive random walk suggests that in the average fewer number of reactions occur along the path before a targeted reaction at a given hierarchy level is reached. Accordingly, the survival probability, shown in Fig. 6, represents two different types of relaxation processes for large graph flexibility (large ): a nearly exponential relaxation in the case of ARW, and stretch-exponential for the NRW, respectively.
The difference between adaptive and random search for the target gradually diminishes with increasing rigidity of the graph (i.e., decreasing the degree of rewiring ), making the wandering on the graphs similar in both cases when the critical point is approached . In Fig. 6 we show the probability that a walk survives for steps on the graph, when the control parameter is varied. At the critical value ( for the graph sizes used in this simulations), the survival probabilities of the two types of walks almost coincide statistically. In the limit , i.e., when in Eqs. (1)-(2), each node has exactly one out-link, rendering the both walk strategies redundant. As we already pointed out, this limit corresponds to the graph with fixed links, belonging to another universality class compared to the Web graph that we discuss here.
V Discussion and Conclusions
We have studied a class of directed graphs with variable wiring diagram caused, for instance, by frequent updates of the out-links in the world-wide Web while the graph evolves. The relevant control parameter that defines the class is the average ratio of updated vs. fixed links, . In the case of the Web is estimated [11] in the range 3–4, i.e., to each added link in the Web comes in the average 3 to 4 links that connect preexisting nodes at each time step of the evolution. Other members of this class of graphs can be sought in the catalytic biochemical reactions, in which nodes are substrates (such as ATP, , etc.) and links are reactions among these substrates [2, 3, 20]. Since the backward reactions, although present, are usually driven by much smaller rates than forward reactions [28], the biochemical reactions are represented by directed hierarchical graphs, with ATP as a top connected node. The presence of catalysts or enzymes selects appropriate reaction with a high accuracy. Investigations and potential applications of catalytic reactions among complex molecules is a great challenge of sciences in the future [21]. The control parameter in this case can be roughly identified as the concentration of the catalyst, that can vary depending on the type of the reactants and/or catalyst.
Here we investigated within the growth model of Ref. [11] how the structure of the out- and in-connections of the graph vary with the control parameter and how that structure influences the relaxation processes on the graph. We summarize the properties that appear as direct consequences of the flexibility of the graph:
(1) In addition to in-degree, the out-degree distribution appears to be a power-law distribution with a new scaling exponent; Correlations between out- and in-degree spontaneously develop;
(2) These structural properties of the graphs determine the properties of the random walks on these graphs. Richness of the doubly-hierarchical connections allows us to define various types of the random walk strategies. Specifically, the adaptive random walker fully utilizes local information on both in- and out-connectivity of a visited node and adapts its moves to follow the node linking preferences. On the other hand, a standard random walker makes use of the out-degree of a visited node searching only the possible ways out. For large graph flexibility the adaptive strategy proves effective in the search of connected subgraphs and in reducing the access time to a given hierarchy level. Quick relaxation of the graph represented by the ARW path in this range of parameter indicates a short list of reactions before a targeted reaction occur.
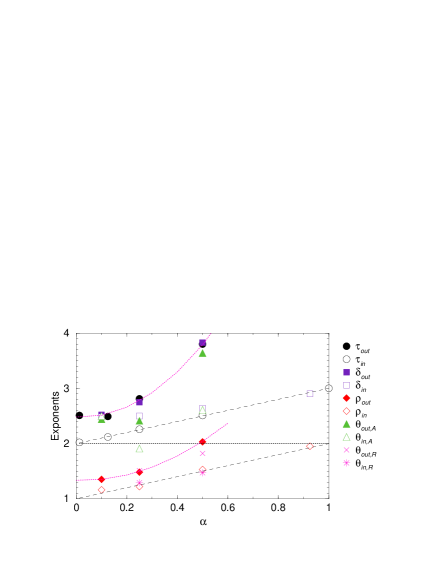
The dynamic processes on this class of graphs reflect the underlying graph structure, leading to a variety of scale-free properties with distinct functional dependences on the in- and out- node degrees. Summary of all scaling exponents for varying flexibility (or rigidity) of the graph is shown in Fig. 7. To understand the theoretical basis of these dependences an analytical study in terms of rate equations of the random-walk dynamics is necessary.
(3) By increasing the graphs rigidity (reducing degree of rewiring ) the advantage of the strategy “reading full information on the way” is lost: Survival of the adaptive random walk becomes statistically closer to the one of the naive walk strategy; Access time gradually approaches the Poisson character; At a critical flexibility the graph structure undergoes the rigidity percolation transition to another universality class characterized with predominantly fixed wiring diagram, in which the random walk dynamics becomes trivial.
(4)The other limit , representing the extreme flexibility, is formally interesting as a possible course of the world-wide Web evolution. In this limit the evolving network at each growth stage shares some similarity with the static random graphs! We detect certain numerical instability in the distributions that can be related to the changes in the linking probabilities Eqs. (1)-(2) when . After a large number nodes are added, these probabilities are -dependent as , where we assumed that maximum degree varies with the network size approximately as , (as before, stands for “in” or “out”). In the random-graph theory the leading inverse linear term of linking probability is compatible with the occurrence of cycles (i.e., triangles, squares, pentagons, etc.) of all sizes, whereas the additional inverse sublinear term introduces admixture of full graphs [29]. By letting the leading linear term disappears, inducing sudden change in the structure of subgraphs—now being only full graphs. Now, having for small leads to , that is compatible with the occurrence of fully connected pentagons. Whereas 3–2.5, leading to – allowing appearance of at most fully connected squares. This suggests why the exponent of the out-degree should stay larger than the one of in-degree distribution when . Numerical simulations suggest (see Fig. 7) that , whereas in this limit.
Random walk path may serve as a communication channel in modeling of packet transport on this class of graphs. In addition to channels, the communication processes depend on the properties of packets to be transported and of driving rate resulting in load at individual nodes. By varying these parameters on a hierarchical tree it was shown in Ref. [30] that a continuous transition to a congested regime occurs, that exhibits several universal features. Looked in this context, our study concentrates on the properties of the communication channels only, and we do not specify any details on the character of packets. The simulation conditions thus correspond to idealized low driving rate below the transition point. Apart from the occurrence of cycles (closed loops), the Web graph differs from the hierarchical tree in that linked nodes are preferably at large distances of hierarchy, in contrast to the tree structure where only next hierarchy levels are coupled. We have demonstrated that due to the complex double-hierarchical structure of the Web graph the channel selection can be done using various strategies, each of them resulting in a nontrivial statistical properties of the channels. How these channel properties would influence the communication processes when more realistic packets and driving conditions are considered remains for the future study.
In conclusion, we have demonstrated that flexible wiring diagrams in the class of directed graphs induces a number of structural and relaxation properties that are crucial both for evolution of these graphs and for design of dynamic processes for exploring their structure.
Acknowledgements.
This work was supported by the Ministry of Education, Science and Sports of the Republic of Slovenia. I thank to Vyatcheslav Priezzhev for helpful suggestions.REFERENCES
- [1] ∗Electronic address: Bosiljka.Tadic@ijs.si
- [2] S. H. Strogatz, Nature 410, 268 (2001).
- [3] R. Albert and A.-L. Barabasi, “Statistical Mechanics of Complex Networks”, Rev. Mod. Phys. (in press).
- [4] P. M. Gleiss, P. F. Stadler, A. Wagner, and D. A. Fell, cond-mat/0009124; H. Jeong, B. Tombor, R. Albert, Z. N. Oltvai, and A. Barabasi, Nature 407, 651 (2000).
- [5] A. Scala, L.A.N. Amaral, and M. Barthélémy, cond-mat/0004380
- [6] J.M. Montoya and R.V. Solé, cond-mat/0011195.
- [7] M. E. J. Newman, Proc. Natl. Acad. Sci. 98, 404 (2001).
- [8] S. Redner, Eur. Phys. J. B 4, 131 (1998).
- [9] A. Broder, R. Kumar, F. Maghoul, P. Raghavan, R. Sridhar, R. Stata, A. Tomkins, and J. Wiener, Computer Networks 33, 209 (2000).
- [10] D. Dhar, Physica A 263, 4 (1999).
- [11] B. Tadić, Physica A 293, 273 (2001); cond-mat/0011442.
- [12] Other mechanisms, for instance in the Internet growth, may also involve local optimization of supply, see A. Capocci et al., cond-mat/0106084.
- [13] A.-L. Barabasi, R. Albert, and H. Jeong, Physica A 272, 173 (1999).
- [14] H. E. Stanley, Introduction to Phase Transitions and Critical Phenomena, Oxford Univ. Press, (New York) 1971.
- [15] S.N. Dorogovtsev, J.F.F. Mendes, and A.N. Samukhin, Phys. Rev. Lett. 85, 4633 (2000).
- [16] S.N. Dorogovtsev and J.F.F. Mendes, Phys. Rev. E 62, 1824 (2000).
- [17] L.P. Krapivsky, G. J. Rodgers, and S. Redner, cond-mat/0012181.
- [18] G. Ergün and G. J. Rodgers, cond-mat/0103423.
- [19] A special type of aiging, fitness and other constraints on the microscopic dynamic level are shown to affect the emergent behavior in the preference attachment model, see discussion in Ref. [3].
- [20] B. Tadić, cond-mat/0104029
- [21] Such a reaction in which the reactants are added with a given rate and the products constantly removed was proposed recently to study work produced by molecular DNA motors, B. Yurke et al., Nature, 406, 605 (2000).
- [22] The actual number of links in the Web exceeds number of nodes suggesting that a larger would be more realistic. In the model the universal properties of the network in the scaling region are not affected when is varied.
- [23] Technically, in order to simulate large graphs we preserve out- and in-degrees at each node from the growth phase and search links by once again using the rule in Eq. (2). The potential differences are minimized with increasing size of the ensemble.
- [24] V. B. Priezzhev, privat communication.
- [25] The maximum degree scales with the network size .
- [26] A different mechanism of desease spreading on hierarchical graphs was considered in Ref. R. Pastor-Satorras and A. Vespignani, cond-mat/0102028
- [27] It was shown recntly that search time scales sublinearly with the network size in several other search algorithms that utilize local information in a power-law graph with symmetric links, see L. A. Adamic, R. M. Lukose, A. R. Puniyani, and B. A. Huberman, cs.NI/0103016, .
- [28] J. Keener and J. Sneiyd, Mathematical Physiology, Springer, Berlin (1998).
- [29] B. Bollobás, Modern Graph Theory, Springer-Verlag, New York (1998).
- [30] A. Arenas, A. Díaz-Guilera, and R. Guimerà, cond-mat/0009395 .