Continuum spin excitations in S=1 one-dimensional antiferromagnet.
Abstract
We present detailed measurement of the non-hydrodynamic part of the spin excitation spectrum in the model quasi-1D S=1 antiferromagnet CsNiCl3 by inelastic magnetic neutron scattering. In the better part of the Brillouin zone the effect of the inter-chain coupling is negligible, and spin dynamics reflects that of a single Haldane chain. We find that at this quantum spin system ceases to support coherent propagating excitation, which gradually turns into a continuum band of states, whose width grows with decreasing . This finding is consistently verified under different resolution conditions, obtained with two different high-luminosity experimental setups.
PACS numbers: 75.10.Jm, 75.40.Gb, 75.50.Ee
I Introduction
In striking neglect of the naïve “common wisdom”, Haldane ground state (GS) of the one-dimensional (1D) S=1 Heisenberg antiferromagnet (HAFM) [1, 2, 3, 4, 5, 6, 7, 8, 9, 10] does not connect the Neel-ordered “spin solid” GS of the semiclassical S HAFM with the almost ordered “marginal liquid” state of the S=1/2 chain [11]. Instead, it is a “quantum liquid” with finite correlation length and a gap in the spin excitation spectrum. Spectral weight of the spin fluctuations is concentrated in a long-lived massive triplet mode in the neighborhood of the Brillouin zone (BZ) boundary . Any remainder of the spectacular continuum observed at in the S=1/2 1D HAFM [12] is predicted to be extremely faint [2, 3, 13]. On the other hand, both nonlinear -model, which is believed to be a valid description of the S=1 HAFM chain in the long-wavelength limit, and the variational treatment based on the Jordan-Wigner fermionization, predict that two-magnon continuum states are the lowest-energy excitations at and dominate the spectrum in the vicinity of the Brilloun zone center [14, 15]. In the absence of magnon interaction the two-magnon continuum starts above a threshold energy , smallest at , where it is , twice the Haldane gap.
Experimental observation of the continuum part of spin excitation spectrum in Haldane chain is a very challenging problem. Primarily this is due to the rapid decrease of the static structure factor , which gives the energy-integrated intensity of the scattering cross-section by spin fluctuations, at small [2, 3, 4, 7]. In single-mode approximation (SMA) vanishes as . In fact, in the state of the art neutron scattering experiment [7] authors found no sign of a continuum in the model Haldane chain compound NENP down to . This result has lead to a widespread belief that there is indeed no continuum at , despite indications to the contrary by MC studies [3, 4, 5]. However, upon careful examination the findings of the Ref. [7] are not at all that prohibitive. To merely observe magnetic scattering at authors employed very coarse resolution, with full width at half maximum (FWHM) of the instrument wavevector acceptance covering about a quarter of the 1D BZ. Their statement that measured magnetic intensity is consistent with the SMA cross-section, treated within the context of this broad resolution, only imposes an upper limit, and not a very stringent one, on the width of the continuum. Another obstacle to observing the continuum magnetic scattering is a single-ion anisotropy in the spin Hamiltonian. As in the majority of Ni-organic chain compounds, it is quite large in NENP, and results in a significant splitting of spin fluctuations with different polarizations. Smeared by the resolution such splitting is hard to distinguish from continuum.
Quasi-1D antiferromagnet CsNiCl3 is one of the most isotropic and best studied Haldane model compounds. It provided some of the earliest, although initially controversial, experimental evidence in favor of the Haldane conjecture [8]. In CsNiCl3 super-critical inter-chain exchange coupling results in a long-range order below K, but as temperature rises above , a gap opens in the spin excitation spectrum, and it quickly recovers properties of an isolated S=1 HAFM chain [9, 10]. Unfortunately, characterization of continuum is impossible at such elevated temperatures because of the substantial magnon thermal broadening. However, it was recently pointed out on the basis of the MF-RPA (mean field random phase approximation) analysis that inter-chain coupling modifies only the low-energy part of the excitation spectrum, and therefore even at dynamic spin response of CsNiCl3 in the better part of the BZ around the top of the 1D dispersion is identical to that of an individual chain [16]. Here we present neutron scattering measurements which illustrate this point and reveal the existence and the extent of the excitation continuum.
II Experiment
We studied large g sample of CsNiCl3, composed of two single crystals, co-aligned to yield effective mosaic . Sample was mounted on an Al plate in the standard “ILL orange” 70 mm cryostat with zone in the scattering plane. CsNiCl3 has hexagonal structure with two equivalent ions per spacing, so that in reciprocal lattice units (rlu) corresponds to in the 1D BZ of a chain. Sample had longer dimension parallel to the hexagonal -axis, and was in the transmission “Laue” geometry shown in Fig. 1. Magnetic scattering was measured at the “base” temperature K, the non-magnetic background (BG) was collected in identical scans at K.
Experiments were performed on SPINS 3-axis cold neutron spectrometer at NIST Center for Neutron Research, using two complementary setups illustrated in Figure 1 (a), (b). Monochromatic incident neutron beam was obtained by (002) reflection from vertically focused pyrolytic graphite (PG) monochromator, viewing the 58Ni neutron guide. While in setup (a) the “natural” beam collimation around the sample was , it was restricted to by Soller collimators in setup (b). Scattered neutron wavevector was analyzed by (002) reflection from an array of 11 (a) or 9 (b) independently rotating cm wide PG crystals through a radial collimator (RC) onto cm wide position sensitive detector (PSD) with 256 pixels. Calibration of the scattered neutron energy accepted by PSD pixel and its sensitivity was done by measuring elastic incoherent scattering from standard sample at different incident energies.
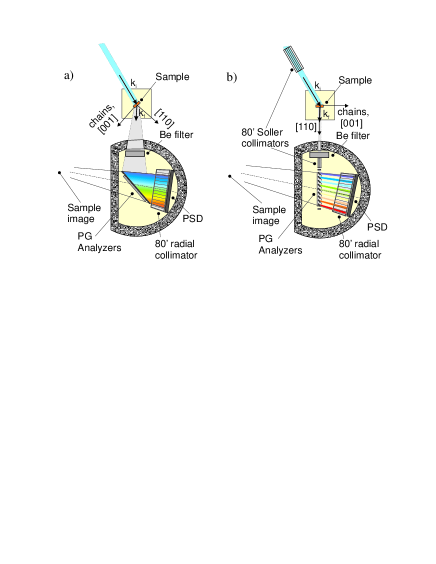
Use of the high count rate setups which employ SPINS large area segmented PG analyzer and matching large PSD was key to the success of our measurements. Essential element in such setup is a radial collimator in front of the PSD. It dramatically restricts acceptance of the PSD pixels to incoherent scattering from the analyzer and its support structures, which otherwise render phohibitively large background. RC requires that reflection from the analyzer produce a geometrical image of the sample at its curvature center. For each incident wavevector the direction and/or length of the scattered wavevector are functions of the pixel position across PSD, as defined by geometry of the Bragg reflection at the analyzer, Fig. 1. This results in a coupled scan with both energy transfer and wavevector in the sample reciprocal space varying across the PSD. However, component along dispersive direction of interest (chain in our case) can be kept in such scan, if this direction is aligned perpendicular to the direction of the scan by appropriately choosing , as shown in Fig. 1.
Setup (a). PSD central energy was fixed at meV, and range meV was covered in this measurement. Evidently, large flat analyzer simply creates a (polychromatic) mirror image of the sample. Radius of the SPINS RC is equal to the sample-detector flight path, optimizing this setup. For all PSD pixels (all sample scattering angles ) component along the analyzer Bragg wavevector A is constant, /2. Therefore, in the paraxial approximation constant is , while varies across PSD as a function of .
Setup (b). PSD central energy was fixed at meV. Angle between the consecutive PG segments , and the corresponding difference in the reflected neutron energy, were chosen to create a polychromatic image of the sample at the RC center. 9 analyzer segments provided full PSD coverage, reflecting energies in the range meV. Chain direction was aligned perpendicular to , and therefore, for given and , only varied across PSD, while . Important feature of this setup is a possibility to restrict analyzer angular acceptance by inserting a collimator after the sample. This allows measurement at smaller scattering angles, and also shapes/tightens the instrument resolution function, as shown by the resolution FWHM ellipses in Fig. 2.
III Results and discussion
In Figure 2 we show contour plots of the measured spectral density of the magnetic scattering intensity, , with the linear -dependent background subtracted. It is evident in both panels that spectrum acquires finite width in energy at .
Fig 2 is constructed from the raw data (integration is done via point by point summation), and is slightly distorted by the instrument resolution. In the single-mode part of the spectrum, at , measured line-shape is completely defined by the interplay of dispersion and resolution. Although resolution volume is smaller in setup (b), the “focusing” effect (longer axis of the FWHM ellipse is parallel to the dispersion in Fig. 2(a)) results in sharper peaks in setup (a). In principle, an opposite “de-focusing” effect is of concern for measurements in this setup, as it would result in quite significant broadening even of a single-mode spectrum. However, careful accounting for the resolution shows that non-zero intrinsic width at accounts for of the spectral width measured in setup (a). “De-focusing” is absent in setup (b), where the FWHM ellipse is approximately round, Fig 2(b). Spectacular agreement of the spectrum measured in two setups shows explicitly, that observed cross-over from a single mode to continuum with significant intrinsic width is not a resolution effect.
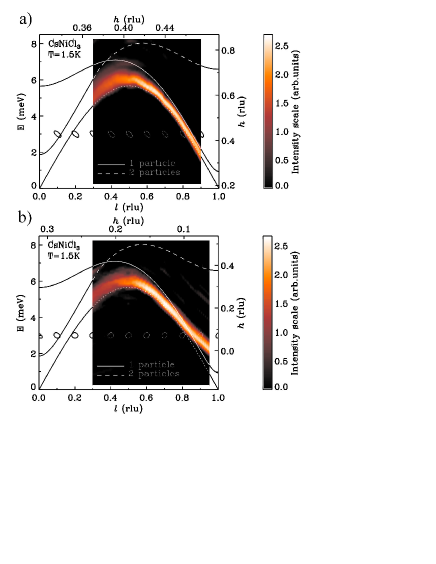
Another important distinction between the data in Fig 2(a) and (b), is that geometry imposes different conditions on in setups (a) and (b) correspondingly. Therefore, measurements are done along different trajectories in the sample 3D reciprocal space, as illustrated by the right and top axes in Fig 2. The effect of the inter-chain coupling is manifested at low energies by difference in dispersion at . While in (a) is close to the 3D magnetic Bragg position at , for setup (b) it is close to the top of inter-chain dispersion, . In agreement with MF-RPA analysis, effect of the inter-chain coupling becomes insignificant at . For comparison, curves in Fig 2 show magnon spectrum in a Haldane chain obtained in [15], for meV, , [16].
Our results show explicitly and unambiguously, that single-mode excitation becomes unstable around the top of the dispersion band in a Haldane chain. Instead, a continuum excitation spectrum, whose width increases with decreasing , is observed at . In fact, very similar behavior was found in another quantum liquid – superfluid 4He, where the “maxon” excitation turns into a broad continuum-like feature under pressure [17], which suppresses the “roton” gap and drives the system towards crystallization, a quantum phase transition.
It is my pleasure to thank C. Broholm, who introduced me to the concept of PSD techniques and shared many invaluable ideas, and S.-H. Lee, who has contributed greatly to the success of this measurement. This work was carried out under Contract DE-AC02-98CH10886, Division of Materials Sciences, US Department of Energy. The work on SPINS was supported by NSF through DMR-9986442.
REFERENCES
- [1] F. D. M. Haldane, Phys. Lett. 93A, 464 (1993); Phys. Rev. Lett. 50, 1153 (1983).
- [2] M. Takahashi, Phys. Rev. Lett. 62, 2313 (1989); Phys. Rev. B 50, 3045 (1994).
- [3] S. V. Meshkov, Phys. Rev. B 48, 6167 (1993); J. Deisz, M. Jarrell, D. L. Cox, Phys. Rev. B 48, 10227 (1993).
- [4] S. R. White, Phys. Rev. Lett. 69, 2863 (1992); S. R. White and D. A. Huse, Phys. Rev. B 48, 3844 (1993).
- [5] E. S. Sorensen, I. Affleck, Phys. Rev. B 49, 13235, (1994); Phys. Rev. B 49, 15771 (1994).
- [6] J.-P. Renard et al , Europhys. Lett. 3, 949 (1987); L.-P. Regnault et al , Phys. Rev. B 50, 9174 (1994).
- [7] S. Ma et al , Phys. Rev. Lett. 69, 3571 (1992).
- [8] W. J. L. Buyers et al , Phys. Rev. Lett. 56, 371 (1986); R. M. Morra et al , Phys. Rev. B 38, 543 (1988); Z. Tun et al , Phys. Rev. B 42, 4677 (1990).
- [9] M. Steiner et al , J. Appl. Phys. 61, 3953 (1987);
- [10] I. A. Zaliznyak et al , Phys. Rev. B 50, 15824 (1994).
- [11] H. Bethe, Z. Phys. 31, 205 (1931).
- [12] D. C. Dender et al , Phys. Rev. B 53, 2583 (1996).
- [13] P. Horton and I. Affleck, cond-mat/9907431.
- [14] I. Affleck, R. A. Weston, Phys. Rev. B 45, 4667 (1992).
- [15] G. Gómez-Santos, Phys. Rev. Lett. 63, 790 (1989).
- [16] I. A. Zaliznyak et al , Phys. Rev. Lett. 87, 017202 (2001).
- [17] E. H. Graf et al , Phys. Rev. A 10, 1748 (1974).