[ Phys. Rev. B (submitted, 2001)
Fully relativistic calculation of magnetic properties of Fe, Co and Ni adclusters on Ag(100)
Abstract
We present first principles calculations of the magnetic moments and magnetic anisotropy energies of small Fe, Co and Ni clusters on top of a Ag(100) surface as well as the exchange-coupling energy between two single adatoms of Fe or Co on Ag(100). The calculations are performed fully relativistically using the embedding technique within the Korringa–Kohn–Rostoker method. The magnetic anisotropy and the exchange–coupling energies are calculated by means of the force theorem. In the case of adatoms and dimers of iron and cobalt we obtain enhanced spin moments and, especially, unusually large orbital moments, while for nickel our calculations predict a complete absence of magnetism. For larger clusters, the magnitudes of the local moments of the atoms in the center of the cluster are very close to those calculated for the corresponding monolayers. Similar to the orbital moments, the contributions of the individual atoms to the magnetic anisotropy energy strongly depend on the position, hence, on the local environment of a particular atom within a given cluster. We find strong ferromagnetic coupling between two neighboring Fe or Co atoms and a rapid, oscillatory decay of the exchange-coupling energy with increasing distance between these two adatoms.
pacs:
PACS numbers: 71.24.+q, 71.70.Gm, 75.30.Gw, 75.30.Hx]
I Introduction
Magnetic nanostructures such as impurities, clusters and wires on top or in the uppermost layers of surfaces are of special interest for nano-scale technologies, in particular, regarding their possible application as magnetic nano-devices and high-density magnetic recording media. A quantitatively correct description of the magnetic properties of such structures, namely, the magnitude and the orientation of spin and orbital moments, magnetic anisotropy energies and the magnetic interactions, is, therefore, an important issue to be addressed. Concomitantly, the understanding of the changes of physical properties from nanostructures to thin films or even bulk systems has always been a fascinating theoretical challenge.
Because of the lack of translational symmetry tight-binding (TB) methods have been an efficient tool to study larger clusters. By using a tight–binding Hubbard Hamiltonian in the unrestricted Hartree–Fock approximation, Pastor and co–workers revealed the size and structural dependence of magnetic properties of free Crn, Fen and Nin () clusters [1], and also the exchange interaction and local environments effects in Fen clusters [2]. By including a spin–orbit coupling term into the Hamiltonian, they also investigated various effects on the magnetic anisotropy energy (MAE) of small unsupported Fe clusters [3] and, recently, of Con clusters on Pd(111) [4]. Finite temperature magnetism of small clusters, remarkably different from that of bulk systems, has also been studied in terms of a similar approach by taking into account both electronic and structural excitations [5]. A great advantage of the TB methods seems to be that they easily can be combined with molecular dynamics calculations enabling thus investigations of relaxation effects which proved to be important in determining the magnetic moments [6, 7, 8] and the MAE [9] of transition metal clusters.
The embedding technique based on the Korringa–Kohn–Rostoker (KKR) Green’s function method in the local spin-density approximation (LSDA) has been applied to the magnetism of transition metal adatoms and clusters deposited on surfaces [10, 11]. The main feature of this approach is that the interaction between adatoms and host surface atoms can be analyzed within first principles electronic structure calculations [12, 13], in several cases exhibiting novel phenomena in nanomagnetism such as the existence of metamagnetic states [14, 15] or intermixing effects between adatoms and the host surface [16]. An accurate calculation of the total energy in terms of full potential or full charge density schemes made possible the investigations of the energetics of adatoms [17, 18, 19]. As compared to TB methods an obvious drawback of the embedded KKR technique is that, with respect to computational limitations, the number of the atoms in the cluster is restricted to about less than 100. Furthermore, the inclusion of structural relaxations is exceedingly difficult. In order to circumvent these problems, a quasi-ab initio molecular–dynamics method has been employed by parameterizing interatomic potentials to the first principles KKR Green’s function electronic structures [20]. On the level of a fully relativistic spin-polarized electron theory, recently, strongly enhanced orbital magnetism and MAE of adatoms and small clusters on Ag and Au(100) surfaces have been reported [21, 22].
From the mid-nineties on we carried out systematic investigations of the magnetism, in particular of the MAE, of transition metal multilayer systems by using the fully relativistic spin-polarized screened Korringa–Kohn–Rostoker (SKKR) method [23, 24, 25]. Specifically, within the single-site approximation, we explored the oscillatory behavior of the MAE of an Fe impurity buried in a Au(100) host [26]. The purpose of the present work is to extend these studies by including self–consistent effects (electronic relaxations) of the host atoms in order to perform realistic investigations for magnetic clusters on metallic surfaces. For this very reason we make use of a real–space embedding technique in order to calculate the electronic structure of the cluster, and also to be able to treat the Poisson equation with appropriate boundary condition. Theoretical and computational details are given in Sections II and III, respectively. In Section IV our results of the magnetic moments and the MAE of small planar Fe, Co and Ni clusters on Ag(100), as well as of the magnetic correlation between Fe or Co adatoms are presented. Finally, in Section V we summarize and draw conclusions.
II Theoretical approach
Within multiple scattering theory the scattering path operator (SPO) matrix, , with and being angular momentum indices and being the energy, defined as
| (1) |
describes the full hierarchy of scattering effects between any two particular sites, and . In Eq. (1), and denote the single–site t-matrices and the real-space structure constants, respectively. For more details, especially, how to calculate within a fully relativistic spin–polarized scheme, see, e.g., Ref. [27].
Assuming that a finite set of impurities interacts within a given finite range, we can select an environment of impurities, , containing also perturbed host atoms, such that outside the potentials can be considered to be identical with those of the unperturbed host. A particular cluster can then be treated as perturbation of the host. In practice, we first calculate the SPO of the 2D translational invariant layered host, , within the framework of the SKKR method[23], where and denote layers and the are vectors in the surface Brillouin zone (SBZ). The real–space SPO is then given by
| (2) |
where the atomic position vectors are decomposed as and with and being 2D lattice vectors, and the so–called layer–generating vectors, and is the unit area of the surface Brillouin zone.
By replacing the t–matrices of the unperturbed host, , with those of the cluster-atoms, , leads to the following Dyson like equation,
| (3) |
where is the SPO-matrix corresponding to all sites in cluster , from which in turn all corresponding local quantities, i.e., charge and magnetization densities, spin– and orbital moments, as well as the total energy can be calculated. Note, that Eq. (3) takes into account all scattering events both inside and outside the cluster.
As usual, in order to perform self-consistent calculations, the Poisson equation has to be solved repeatedly. Partitioning the configurational space into non-overlapping cells centered at the atomic sites only the intracell part needs special care. By using a multipole expansion of the Coulomb potential, one arrives at the so–called Madelung potentials, which for a given site of will be denoted by . Due to the additivity of the Poisson equation, can be decomposed into contributions from atoms inside and outside of the cluster, and , respectively,
| (4) |
where denotes the ensemble of scatterers outside . Clearly enough, assuming that the ensemble of sites in is independent of , implies that has to be independent of the type of the atoms in . Replacing the atoms in by those of the unperturbed host, one can write
| (5) |
where denotes the Madelung potential of site for the unperturbed, 2D translational invariant host [23] and stands for the Madelung potential of site generated by cluster occupied by unperturbed host atoms. Substituting Eq. (5) into (4), yields
| (6) |
which can be regarded as an embedding equation for the intercell potential resulting from the boundary condition set by the size of . Obviously, by using Eq. (6) the problem of summing up the contributions to the intercell potential from region is properly solved.
III Computational details
Self–consistent, fully relativistic calculations for selected, planar Fe, Co and Ni clusters on Ag(100) have been performed in the framework of the local spin–density approximation as parameterized by Vosko et al. [28]. In each case three different orientations for the magnetization were considered: along the axis (normal to planes), as well as along the and axes (nearest neighbor directions in an fcc(100) plane). The potentials were treated within the atomic sphere approximation (ASA). For the calculation of the –matrices and for the multipole expansion of the charge densities, necessary to evaluate the Madelung potentials, a cut–off of was used. In order to perform the energy integrations, 16 points on a semicircular contour in the complex energy plane were sampled according to an asymmetric Gaussian quadrature. Both, for the self–consistent calculation of the Ag(100) surface and for the evaluation of Eq. (2) we used 45 –points in the irreducible wedge of the SBZ. For some restricted cases we checked the convergence of the results by increasing the number of –points to 210.
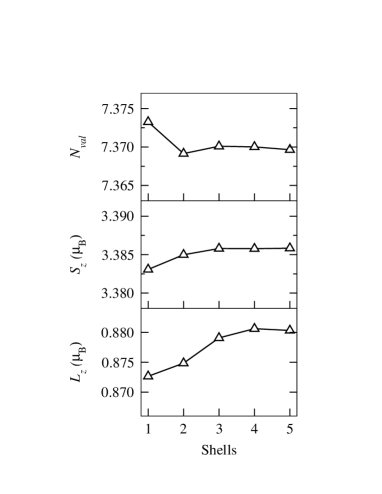
In the present study we made no attempts to include lattice relaxation effects, therefore, the host and the cluster sites refer to positions of an ideal fcc parent lattice [29] with the experimental Ag lattice constant (4.12 Å). Three layers of self–consistently treated empty sites were used to represent the vacuum region [23]; the magnetic adatoms occupy sites in the first vacuum layer. As shown in Fig. 1, we considered dimers and linear trimers oriented along the axis, square–like tetramers, centered pentamers (as in Ref. [22]), as well as a cluster arranged on positions of a 33 square denoted in the following simply as 33 cluster. In Fig. 1, for each particular cluster the equivalent atoms with respect to an orientation of the magnetization along the or axis are labelled by the same number. Note that for a magnetization aligned in the direction, the atoms labelled by 2 and 3 in the pentamer and the 33 cluster become equivalent. Up to a total of 67 sites, the clusters consisted of adatoms, several substrate Ag atoms and empty sites from neighboring shells. A stability test of the local electronic and magnetic properties for a single Fe adatom with respect to the number of self–consistently treated neighboring shells is shown in Fig. 2. Although the calculated orbital moment of the Fe adatom shows a somewhat slower convergence than the valence charge and the spin moment, it is remarkable that considering only a first shell of neighbors this already yields values which differ by less than 1 % from the fully converged ones.
IV Results and discussion
A Spin and orbital moments
Calculations for different orientations of the magnetization revealed that the spin moments are fairly insensitive to the direction of the magnetization, while for the orbital moments remarkably large anisotropy effects apply, a phenomenon that will be discussed in the next Section. For a magnetization along the axis, the calculated values of the spin and orbital moments for an adatom and selected clusters of Fe, Co and Ni on Ag(100) are listed in Table I. In there the position indices in a particular cluster refer to the corresponding numbers in Fig. 1 and the number of nearest neighbors of magnetic atoms (coordination number, ) is also given.
As compared to the corresponding monolayer values (3.15 for Fe and 2.03 for Co), the spin moment of a single adatom of Fe (3.39 ) and Co (2.10 ) is slightly increased. In the case of Fe clusters, the spin moments decrease monotonously with increasing . A slight deviation from that behavior can be seen for the 33 cluster, where the atoms with =2 and 3 exhibit the same spin moment. For the central atom of the pentamer and, in particular, of the 33 cluster, the monolayer value is practically achieved. The above results compare fairly well to those of Cabria et al. [22] and reflect a very short ranged magnetic correlation between the Fe atoms.
The general tendency of decreasing spin moments with increasing is obvious also for the Co clusters up to the pentamer case. For the 33 cluster, however, just the opposite trend applies. Establishing a correlation between and for Co seems to be more ambiguous than for Fe, because the changes of the spin moment are much smaller in this case. Nevertheless, it is tempting to say that in the formation of the magnetic moment of Co, further off neighbors play a more significant role than in the case of Fe.
In the case of an adatom and dimer of Ni we found no stable magnetic state. Quite contradictory, Cabria et al. [22] reported a spin moment of about 0.5 for a Ni adatom on Ag(100). As the computational method of these authors is very similar to ours, it is at present puzzling what causes this discrepancy between the two calculations. Our result is, however, in line with the experiments of Beckmann and Bergmann who found no magnetic moment for Ni adatoms on Au surface[30], which as a substrate is rather similar to Ag. It should be noted, however, that in Ref. [30] the actual surface orientation is not specified.
For clusters of Ni one can observe an opposite tendency as for Fe and Co: the spin moment enhances with increasing number of neighbors. This clearly can be seen from Table I. Having in mind the calculated monolayer value (), our small cluster calculations indicate a fairly slow evolution of the spin moment of Ni with increasing cluster size, implying that the magnetism of Ni is subject to correlation effects on a much longer scale than in Fe or Co.
Apparently, the orbital moments show a different, in fact, more complex behavior as the spin moments. For single adatoms of Fe and Co we found orbital moments enhanced by a factor of and , respectively, as compared to the monolayer values ( for Fe and for Co). This is a direct consequence of the reduced crystal field splitting, being relatively large in monolayers, and, in particular, in corresponding bulk systems [31]. In spite of a qualitative agreement, our values for the adatoms are considerably larger than those calculated by Cabria et al. [22] ( for Fe and for Co). It should be noted, however, that by including orbital polarization effects (Hund’s second rule) in terms of Brooks’ parameterization [32, 33], Nonas et al. [21] found orbital moments for Fe and Co adatoms on Ag(100) close to the atomic limit ( for Fe and for Co).
For dimers of Fe and Co, the value of drops to about 40 % in magnitude as compared to a single adatom. The evolution of the orbital moment seems, however, to decrease explicitly only for the central atom of larger clusters. In a previous paper [34] we showed that the (local) symmetry can be correlated with the magnetic anisotropy, i.e., with the quenching effect of the crystal field experienced by an atom. A single adatom and the central atom of the linear trimers, pentamers and the 33 clusters exhibit well–defined rotational symmetry, namely, , , and , respectively. The corresponding values of , namely, 0.88 , 0.25 , 0.15 , and 0.12 for Fe, and 1.19 , 0.49 , 0.25 and 0.23 for Co, nicely reflect the increasing rotational symmetry of the respective atoms. Although the outer magnetic atoms exhibit systematically larger orbital moments than the central ones, even a qualitative correlation with the local environment () can hardly be stated. The orbital moment for the trimer of Ni is already close to the monolayer value () but shows rather big fluctuations with respect to the size of the cluster and also to the positions of the individual atoms.
B Anisotropies of orbital moments and magnetic anisotropy energies
By using the self–consistent potentials for a given orientation of the magnetization (along ), we calculated magnetic anisotropy energies by means of the magnetic force theorem [35, 36] as differences of band–energies,
| (7) |
For a particular orientation , the band–energy is obtained as a sum of contributions from all atoms in the cluster,
| (8) |
| (9) |
where is the Fermi energy of the substrate, is the bottom of the valence band and is the density of states for atom . Clearly, the above formalism allows us to define the MAE as a sum of atom–like contributions, which facilitates to trace its spatial distribution in the cluster.
The anisotropies of the orbital moments and the contributions of the individual magnetic atoms to the MAE are displayed in Tables II, III and IV for Fe, Co and Ni clusters, respectively. In addition, the total MAE per magnetic atoms of the clusters including the neighborhood is also given. Although the dominating contributions to the MAE arise from the magnetic species, the environment, in particular, the Ag atoms and the empty sites within the first shell add a remarkable amount to the MAE. However, due to the weak polarization of the Ag atoms, we obtained a fast convergence of the total MAE with respect to the size of the cluster (environment).
As can be inferred from the corresponding positive values of the MAE in Tables II and III, single adatoms of Fe and Co exhibit a magnetization oriented perpendicular to the surface. This again is in perfect agreement with the experiments of Beckmann and Bergmann [30]. As compared with the monolayer case (0.47 meV), the MAE of an Fe adatom (5.61 meV) is enhanced by a factor of twelve. Contrary to our results, Cabria et al. [22] predicted in–plane magnetism ( = -0.98 meV) for an Fe adatom on Ag(100), and perpendicular magnetism for Co, albeit with a much larger anisotropy energy ( 7 meV) than ours (4.36 meV). It should be stressed at this point, that our calculations are consistent with a qualitative rule, valid for transition metals with a more than half–filled –band and based on simple, perturbative phenomenological or tight–binding reasoning [31]: the direction, along which the orbital moment is the largest, is energetically favored.
As can be seen from Table II, perpendicular magnetism is characteristic for all Fe clusters considered. For the dimer and the trimer we observe a small in–plane anisotropy with preference of the axis, i.e., in the direction of the Fe-Fe bonds. In agreement with the reduction of the orbital moment, as discussed in the previous section, the contribution of the central atom to the MAE for the trimer, the pentamer and the 33 cluster rapidly decreases, being even less than the monolayer value in the case of the 33 cluster. The outer atoms in the pentamer and in the 33 cluster can add considerably more to the MAE than the central atom. As a consequence, the average MAE strongly fluctuates with increasing size of the magnetic cluster and shows a very slow tendency to converge to the MAE of an Fe monolayer on Ag(100). Such a complicated behavior of the MAE with respect to the cluster size has also been found by Guirado–López [9] for free–standing fcc transition metal clusters.
In comparison to an adatom, for a Co dimer drops to a large negative value (-3.49 meV/per Co), while remains slightly positive (0.76 meV/per Co), implying that a Co dimer favors the (in–plane) direction of the magnetization and also experiences a strong in–plane anisotropy. The strong tendency of Co clusters to in–plane magnetization pertains to larger clusters and is characteristic also for a Co monolayer ( = -1.31 meV). The atom–like resolution of the MAE indicates, that this tendency is driven by nearest–neighbor Co-Co interactions. An explanation of this effect in terms of perturbation theory and symmetry resolved densities of states can be found in Refs. [37, 38, 39]. As an unexpected consequence, the contribution to the MAE of the central atom in the cluster can be larger than that of some outer atoms. Quite obviously, the MAE of the central atom of the trimer, the pentamer and the 33 cluster, -9.06 meV, -2.46 meV, and -1.86 meV, respectively, fall monotonously off to the monolayer value, whereas the average MAE possesses a much more complicated evolution also in this case.
With exception of the tetramer, for which we found a MAE close to zero, all Ni clusters prefer an in–plane magnetization. The in–plane anisotropy, seen from Table IV for the trimer, but also from the atom–like contributions for the larger clusters, is, however, smaller than in the case of Co. Again the complicated nature of the magnetism of Ni shows up, in particular, for the 33 cluster: while the contribution of the central atom to the MAE almost vanishes, those of the outer atoms oscillate in magnitude. Considering the MAE of a Ni monolayer on Ag(100) (-2.23 meV), no straightforward connection with the magnetic anisotropy properties of small clusters can be traced.
C Magnetic interaction between adatoms
Interactions between magnetic nanoclusters are of great importance for technological applications. Clearly enough the most important questions are what is the magnetic structure of the individual entities, of what nature (strength, range, etc.) is the coupling between them, and what influences the magnetic orientation of these entities relative to each other. In this section we present a preliminary study in this field by investigating the interaction of two Fe or Co adatoms on Ag(100).
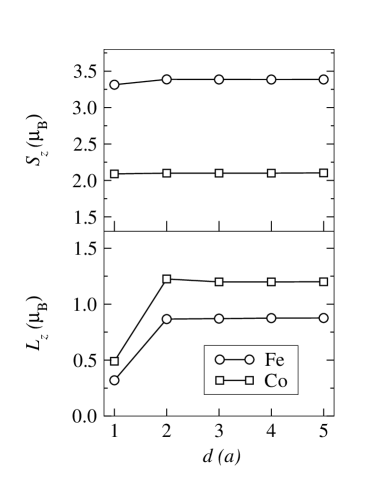
We first performed self–consistent calculations for two adatoms by varying the distance between them from to along the direction, where is the 2D lattice constant and keeping the orientation of the magnetizations parallel to each other (along the axis). The calculated spin and orbital moments of the (coupled) adatoms are shown in Fig. 3. Note that the distance refers to the bondlength in dimers. As can be seen from Fig. 3, both for Fe and Co the values of and rapidly converge to the respective single adatom value.
Next we calculated the exchange-coupling energy, , between the two adatoms by taking the energy difference between a parallel () and an antiparallel () orientation of the two adatoms,
| (10) |
using, however, the self–consistent potentials for the parallel configuration. We are aware of the fact that, due to the lack of self–consistency in the antiparallel case, for near adatoms this approach might be quite poor. We believe, however, that this approximation provides a good estimate of the sign and the magnitude of the interaction.
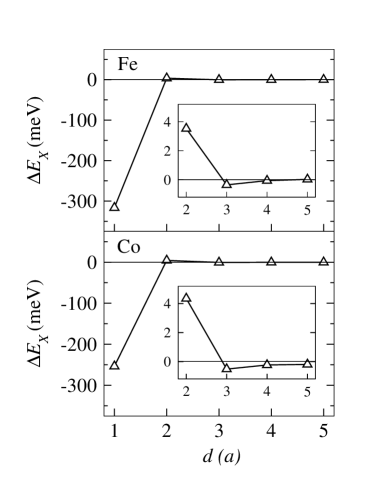
The calculated is shown in Fig. 4 for Fe and Co as a function of the distance between the two adatoms. Apparently, for in both cases a strong, ferromagnetic nearest–neighbor exchange-coupling between these two atoms applies, with an interaction energy somewhat larger for Fe than for Co. As the two adatoms are adjacent in this case, this strong coupling can be attributed to a direct exchange mechanism. Increasing the separation between the two adatoms, rapidly decreases. For it changes sign, i.e., the coupling becomes antiferromagnetic. Since for an antiparallel alignment of the spin moments of the two adatoms, lying close to each other, the electronic structure and the magnetic moments might be expected to differ to some extent as compared to a parallel configuration, the corresponding values of and in Table 3 can be questioned. Therefore, for this particular case we performed self–consistent calculations also for the antiparallel alignment. Assuringly, for both Fe and Co, we obtained the same value of and within 1% relative accuracy as in the case of a parallel alignment. For larger distances we observe ferromagnetic coupling, which virtually vanishes for , implying a very weak, short ranged exchange interaction between the adatoms of Fe and Co induced by the Ag host.
V Summary and conclusions
By using a real–space embedding technique based on the Korringa–Kohn–Rostoker Green’s function method, we have performed fully relativistic, self-consistent calculations for adatoms and small clusters of Fe, Co and Ni on Ag(100). Due to the decreased coordination of the magnetic atoms, we obtained slightly enhanced spin moments for adatoms and small clusters of Fe and Co and found that the spin moments are already close to the monolayer values for a cluster of 9 atoms. In agreement with experiments [30] the adatoms and dimers of Ni turned out to be nonmagnetic, while the spin moments in larger Ni clusters indicated a complex formation of magnetism. In connection with strongly enhanced orbital moments, for Fe and Co adatoms we revealed an unusually strong tendency to perpendicular magnetism. The perpendicular magnetism persisted also for Fe clusters of increasing size, whereby the atom–like contributions showed an oscillating behavior depending mainly on the local rotational symmetry. The preferred orientation for clusters of Co and Ni obtained was in–plane. In addition, we investigated the magnetic coupling between two adatoms of Fe or Co, for which we established a ’good local–moment’ behavior. In terms of calculated exchange-coupling energies, the dimers show a strong ferromagnetic coupling, which immediately drops two orders of magnitude with increasing distance between the two adatoms, indicating a weak, indirect coupling between them.
The main outcome of the present paper is that by performing first principles calculations, not only the qualitative trends of small cluster magnetism of transition metals, but even quantitative results can be obtained which in turn can directly be compared with experiments. By using a parallelized version of our computer code the number of atoms treated in the cluster can be easily increased to some hundreds. This is encouraging to extend the present calculations to larger nanostructures (magnetic wires, dots, corrals etc.) currently being in the very focus of technological applications.
Acknowledgements.
This paper resulted from a collaboration partially funded by the RTN network “Computational Magnetoelectronics” (Contract No. RTN1-1999-00145). Financial support was also provided by the Center for Computational Materials Science (Contract No. GZ 45.451), the Austrian Science Foundation (Contract No. W004), and the Hungarian National Scientific Research Foundation (OTKA T030240 and OTKA T029813). We thank Prof. P.H. Dederichs for valuable discussions.REFERENCES
- [1] G. M. Pastor, J. Dorantes-Dávila, and K. H. Bennemann, Phys. Rev. B 40, 7642 (1989).
- [2] J. Dorantes-Dávila, H. Dreyssé, and G. M. Pastor, Phys. Rev. B 46, 10432 (1992).
- [3] G. M. Pastor, J. Dorantes-Dávila, S. Pick, and H. Dreyssé, Phys. Rev. Lett. 75, 326 (1995).
- [4] R. Félix-Medina, R. Guirado-López, J. Dorantes-Dávila, and G. M. Pastor, J. Appl. Phys. 87, 4894 (2000).
- [5] F. López-Urias, G. M. Pastor, and K. H. Bennemann, J. Appl. Phys. 87, 4909 (2000).
- [6] B. Piveteau, M. C. Desjonquéres, A. M. Oles, and D. Spanjaard, Phys. Rev. B 53, 9251 (1996).
- [7] J. L. Rodriguez-López, F. Aguilera-Granja, A. Vega, and J. A. Alonso, European Physical Journal D 6, 235 (1999).
- [8] R. Guirado-López, M. C. Desjonquères, and D. Spanjaard, Phys. Rev. B 62, 13188 (2000).
- [9] R. Guirado-López, Phys. Rev. B 63, 174420 (2001).
- [10] P. Lang, V. S. Stepanyuk, K. Wildberger, R. Zeller, and P. H. Dederichs, Solid State Commun. 92, 755 (1994).
- [11] K. Wildberger, V. S. Stepanyuk, P. Lang, R. Zeller, and P. H. Dederichs, Phys. Rev. Lett. 75, 509 (1995).
- [12] V. S. Stepanyuk, W. Hergert, K. Wildberger, R. Zeller, and P. H. Dederichs, Phys. Rev. B 53, 2121 (1996).
- [13] V. S. Stepanyuk, W. Hergert, P. Rennert, K. Wildberger, R. Zeller, and P. H. Dederichs, Phys. Rev. B 54, 14121 (1996).
- [14] V. S. Stepanyuk, W. Hergert, P. Rennert, K. Wildberger, R. Zeller, and P. H. Dederichs, Solid State Commun. 101, 559 (1997).
- [15] V. S. Stepanyuk, W. Hergert, P. Rennert, K. Wildberger, R. Zeller, and P. H. Dederichs, J. Magn. Magn. Mater 165, 272 (1997).
- [16] V. S. Stepanyuk, W. Hergert, P. Rennert, K. Wildberger, R. Zeller, and P. H. Dederichs, Phys. Rev. B 59, 1681 (1999).
- [17] B. Nonas, K. Wildberger, R. Zeller, and P. H. Dederichs, Phys. Rev. Lett. 80, 4574 (1998).
- [18] N. A. Levanov, V. S. Stepanyuk, W. Hergert, D. I. Bazhanov, P. H. Dederichs, A. A. Katsnelson, and C. Massobrio, Phys. Rev. B 61, 2230 (2000).
- [19] V. S. Stepanyuk and W. Hergert, Phys. Rev. B 62, 7542 (2000).
- [20] J. Izquierdo, D. I. Bazhanov, A. Vega, V. S. Stepanyuk, and W. Hergert, Phys. Rev. B 63, 140413 (2001).
- [21] B. Nonas, I. Cabria, R. Zeller, P. H. Dederichs, T. Huhne, and H. Ebert, Phys. Rev. Lett. 86, 2146 (2001).
- [22] I. Cabria, B. Nonas, R. Zeller, and P. H. Dederichs, manuscript submitted to Phys. Rev. B (2001).
- [23] L. Szunyogh, B. Újfalussy, P. Weinberger, and J. Kollár, Phys. Rev. B 49, 2721 (1994).
- [24] R. Zeller, P. H. Dederichs, B. Újfalussy, L. Szunyogh, and P. Weinberger, Phys. Rev. B 52, 8807 (1995).
- [25] P. Weinberger and L. Szunyogh, Computational Materials Science 17, 414 (2000).
- [26] L. Szunyogh and B. L. Györffy, Phys. Rev. Lett. 78, 3765 (1997).
- [27] P. Weinberger, Electron Scattering Theory for Ordered and Disordered Matter (Clarendon, Oxford,1990).
- [28] S. H. Vosko, L. Wilk, and M. Nusair, Can. J. Phys. 58, 1200 (1980).
- [29] P. Weinberger, Philos. Mag. B 75, 509 (1997).
- [30] H. Beckmann and G. Bergmann, Phys. Rev. B 54, 368 (1996).
- [31] P. Bruno, in Magnetismus von Festkörpern und Grenzflächen (IFF–Ferienkurs, Forschungszentrum Jülich, 1993) p. 24.1.
- [32] M. Brooks, Physica (Amsterdam) 130B, 6 (1985).
- [33] H. Ebert and M. Battocletti, Solid State Commun. 98, 785 (1996).
- [34] L. Szunyogh, B. Újfalussy, and P. Weinberger, Phys. Rev. B 55, 14392 (1997).
- [35] L. Szunyogh, B. Újfalussy, and P. Weinberger, Phys. Rev. B 51, 9552 (1995).
- [36] H. J. Jansen, Phys. Rev. B 59, 4699 (1999).
- [37] D. S. Wang, R. Wu, and A. J. Freeman, J. Magn. Magn. Mater 129, 237 (1994).
- [38] L. Zhong, M. Kim, X. Wang, and A. J. Freeman, Phys. Rev. B 53, 9770 (1996).
- [39] B. Újfalussy, L. Szunyogh, P. Bruno, and P. Weinberger, Phys. Rev. Lett. 77, 1805 (1996).
| Fe | Co | Ni | ||||||
|---|---|---|---|---|---|---|---|---|
| Cluster | position | |||||||
| adatom | 0 | 3.39 | 0.88 | 2.10 | 1.19 | – | – | |
| dimer | 1 | 1 | 3.31 | 0.32 | 2.09 | 0.49 | – | – |
| trimer | 1 | 2 | 3.29 | 0.25 | 2.07 | 0.45 | 0.77 | 0.21 |
| 2 | 1 | 3.33 | 0.44 | 2.06 | 0.49 | 0.70 | 0.23 | |
| tetramer | 1 | 2 | 3.26 | 0.18 | 2.08 | 0.32 | 0.76 | 0.28 |
| pentamer | 1 | 4 | 3.13 | 0.15 | 2.01 | 0.25 | 0.76 | 0.12 |
| 2 | 1 | 3.35 | 0.37 | 2.10 | 0.59 | 0.71 | 0.33 | |
| 3 | 1 | 3.35 | 0.37 | 2.10 | 0.59 | 0.71 | 0.33 | |
| 33 cluster | 1 | 4 | 3.15 | 0.12 | 2.06 | 0.23 | 0.79 | 0.24 |
| 2 | 3 | 3.23 | 0.16 | 2.04 | 0.30 | 0.71 | 0.20 | |
| 3 | 3 | 3.23 | 0.16 | 2.04 | 0.30 | 0.71 | 0.20 | |
| 4 | 2 | 3.23 | 0.33 | 2.00 | 0.29 | 0.63 | 0.19 | |
| Cluster | position | |||||
|---|---|---|---|---|---|---|
| adatom | 0 | -0.37 | 5.07 | -0.37 | 5.07 | |
| (5.61) | (5.61) | |||||
| dimer | 1 | 1 | -0.12 | 2.14 | -0.11 | 1.66 |
| (2.30) | (1.83) | |||||
| trimer | 1 | 2 | -0.12 | 1.93 | -0.08 | 0.93 |
| 2 | 1 | -0.16 | 2.83 | -0.15 | 2.39 | |
| (2.72) | (2.13) | |||||
| tetramer | 1 | 2 | -0.02 | 0.50 | -0.02 | 0.50 |
| (0.54) | (0.54) | |||||
| pentamer | 1 | 4 | -0.03 | 0.49 | -0.03 | 0.49 |
| 2 | 1 | -0.03 | 0.92 | -0.08 | 0.85 | |
| 3 | 1 | -0.08 | 0.85 | -0.03 | 0.92 | |
| (0.90) | (0.90) | |||||
| 33 cluster | 1 | 4 | 0.00 | 0.23 | 0.00 | 0.23 |
| 2 | 3 | -0.02 | 0.43 | -0.01 | 0.84 | |
| 3 | 3 | -0.01 | 0.84 | -0.02 | 0.43 | |
| 4 | 2 | -0.13 | 1.86 | -0.13 | 1.86 | |
| (1.20) | (1.20) |
| Cluster | position | |||||
|---|---|---|---|---|---|---|
| adatom | 0 | -0.26 | 4.20 | -0.26 | 4.20 | |
| (4.36) | (4.36) | |||||
| dimer | 1 | 1 | 0.15 | -3.50 | -0.01 | 0.67 |
| (-3.49) | (0.76) | |||||
| trimer | 1 | 2 | 0.40 | -9.06 | -0.02 | -0.11 |
| 2 | 1 | 0.34 | -6.29 | 0.05 | -0.04 | |
| (-7.44) | (-0.01) | |||||
| tetramer | 1 | 2 | 0.15 | -2.29 | 0.15 | -2.29 |
| (-2.37) | (-2.37) | |||||
| pentamer | 1 | 4 | 0.12 | -2.46 | 0.12 | -2.46 |
| 2 | 1 | 0.21 | -4.16 | -0.01 | -0.03 | |
| 3 | 1 | -0.01 | -0.03 | 0.21 | -4.16 | |
| (-2.22) | (-2.22) | |||||
| 33 cluster | 1 | 4 | 0.13 | -1.86 | 0.13 | -1.86 |
| 2 | 3 | 0.10 | -1.56 | 0.18 | -2.96 | |
| 3 | 3 | 0.18 | -2.96 | 0.10 | -1.56 | |
| 4 | 2 | 0.16 | -2.60 | 0.16 | -2.60 | |
| (-2.45) | (-2.45) |
| Cluster | position | |||||
|---|---|---|---|---|---|---|
| trimer | 1 | 2 | 0.19 | -6.12 | 0.18 | -1.38 |
| 2 | 1 | 0.11 | -3.72 | 0.08 | -1.00 | |
| (-4.63) | (-1.13) | |||||
| tetramer | 1 | 2 | -0.05 | 0.07 | -0.05 | 0.07 |
| (0.10) | (0.10) | |||||
| pentamer | 1 | 4 | 0.15 | -2.26 | 0.15 | -2.26 |
| 2 | 1 | 0.01 | -1.64 | 0.05 | -0.69 | |
| 3 | 1 | 0.05 | -0.69 | 0.01 | -1.64 | |
| (-1.41) | (-1.41) | |||||
| 33 cluster | 1 | 4 | -0.06 | -0.02 | -0.06 | -0.02 |
| 2 | 3 | 0.02 | -0.75 | 0.06 | -2.00 | |
| 3 | 3 | 0.06 | -2.00 | 0.02 | -0.75 | |
| 4 | 2 | 0.05 | -1.21 | 0.05 | -1.21 | |
| (-1.17) | (-1.17) |