[
On the athermal character of structural phase transitions
Abstract
The significance of thermal fluctuations on nucleation in structural first-order phase transitions has been examined. The prototype case of martensitic transitions has been experimentally investigated by means of acoustic emission techniques. We propose a model based on the mean first-passage time to account for the experimental observations. Our study provides a unified framework to establish the conditions for isothermal and athermal transitions to be observed.
pacs:
PACS numbers: 64.60.My, 64.60.Qb, 81.30.Kf] Fluctuations are considered as essential for a phase transition to take place. However, at moderate temperatures many solids undergo first-order phase transitions which are regarded as being athermal. The kinetics of these transitions is not dominated by thermal fluctuations and, consequently, they can only take place under the change of an external parameter (stress, magnetic field,temperature …) which modifies the free energy difference between high and low symmetry phases. This behaviour is in contrast to thermally activated transitions for which the relaxation from a metastable state can occur at constant external conditions due to thermal fluctuations. Typical examples of athermal transitions are found within the families of magnetic and structural phase transitions which involve long-range interactions (dipolar, elastic, …). The Martensitic Transition (MT) undergone by many solids is an interesting case that will be the prototype system experimentally investigated in the present letter. It is a diffusionless first-order transition [1] mainly caused by a shear mechanism [2]. Often MT is preceded by interesting premonitory effects such as softening of long and short wavelength acoustic vibrational modes. The anharmonic coupling of these modes is at the origin of the instability of the high temperature phase [3].
In general, when a system is externally driven through a first-order phase transition, the response to the external control parameter is determined by the characteristics of the energy barriers separating the two phases. When thermal fluctuations are not relevant (athermal transition), the system remains in a given configuration as long as the state corresponds to a free energy local minimum. When driven, the system jumps towards a different configuration, once the local stability limit is reached. The path followed by the system is strongly influenced by the existence of disorder (dislocations, grain boundaries, vacancies, local composition, atomic configuration, etc…), which controls the actual distribution of energy barriers. As the system evolves, it passes through a sequence of metastable states. The kinetics is characterised by jumps (avalanches) from one metastable state to another which occur with a certain relaxation time . In a number of cases this time has been found to be power law distributed [5]. The jerky response for MT is related to sudden changes in the local strain field which are at the origin of the emission of acoustic waves in the range from to [6]. This effect is the so-called acoustic emission (A.E.). Similar crackling behaviour is observed in ferromagnetic systems (Barkhausen noise) [7], capillary condensation systems [8] and others [9]. In the athermal case the path followed by the system can be reproduced from cycle to cycle provided that disorder does not evolve [10].
Traditionally MT have been regarded as athermal [11], however very recent experimental observations of the occurrence of the transition at constant temperature question this athermal character in shape-memory alloys [12]. The present letter is aimed at providing a simple explanation for the observation of apparent athermal behaviour and describing the possibility of a cross-over between such a behaviour and cases where thermal activation is evident. The problem is intimately related to the nucleation mechanism. Classical nucleation theories have proven to be inadequate for MT and heterogeneous nucleation models have been proposed, most of them neglecting the effect of themal fluctuations [13]. This problem is central for the understanding of MT and remains an issue of active debate [13, 11]. We have investigated two prototype shape-memory materials undergoing a MT by detecting the A.E. generated during the transition. The interest in the A.E. technique lies in the fact that it is highly sensitive to very small microstructural changes taking place in the studied sample. It is the best suited technique to detect the nucleation and growth of any small domain of the low temperature phase.
We have selected two single crystals with compositions Cu68.4Al27.8Ni3.8 and Cu68.0Zn16.0Al16.0. They underwent, respectively, a MT from the (ordered-) towards a (hexagonal) and a (orthorhombic) martensites. The samples were annealed for 30 min at 1173 K and then rapidly cooled down to room temperature and further annealed for several days. A large number of cycles (more than 50) were done in order to have a reproducible transformation. A.E signals were detected by a resonant piezoelectric transducer acoustically coupled to the top flat surface of the sample. The bottom flat surface was mounted onto a Cu-block which was cooled/heated by a Peltier element. In order to detect possible isothermal effects it is of major importance to avoid uncontrolled temperature oscillations and/or drifts. A computer-controlled feed-back procedure provided temperature control with relative oscillations smaller than 0.01 %. The absolute value of the sample temperature [14] is known within K. A.E. signals were counted using a frequency counter with a 1 s gate [15]. Background noise is inherent to the detection of A.E; this noise was quantified by performing experiments at a temperature of more than 100 K above . The background count rate is in the range of 10 Hz. This renders a signal-to-noise ratio better than 103 during the M.T.
Two complementary experimental procedures were followed for each studied sample. In the first case, the sample was cooled down from room temperature in a stepwise manner. Each step consisted of an isothermal plateau lasting a time , followed by a cooling at K/min down to the next plateau. The temperature difference between consecutive plateaux was and several values for and were tested. This procedure provided very fine tuning for the detection of any possible isothermal nucleation and growth of martensite. A typical example of the results obtained is shown in Fig. 1. For Cu-Zn-Al (Fig. 1a), no trace of A.E. was detected under isothermal holding conditions, for any value of (values as low as K were investigated). Moreover, below a certain temperature, A.E. resumes each time the temperature is decreased. The behaviour found for Cu-Al-Ni (Fig. 1b) turns out to be different. For isothermal plateaux separated by more than 0.8 K, the behaviour is similar to that reported for Cu-Zn-Al. However, for smaller , A.E. under isothermal conditions is detected. A detailed view is presented in the inset. The overshoot in the temperature caused by heat release is clear evidence that the detected acoustic signals are indeed generated by the transformation of a martensitic domain. Furthermore, it is worth noting that in this case A.E. continues for many minutes during the isothermal plateau above the average background noise. From these stepwise experiments, it can be inferred that thermal fluctuations do trigger the M.T. for Cu-Al-Ni, when the system is close enough to the stability limit. In contrast, it seems that thermal fluctuations are not able to trigger the transition in Cu-Zn-Al even in the case when the system is in the two-phase co-existence region.

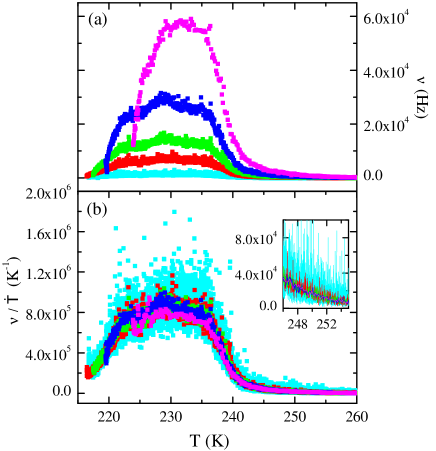
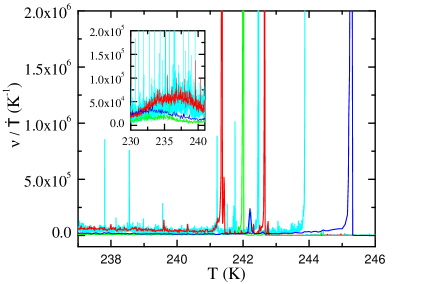
The second procedure consists of measuring A.E. under continuous cooling at different rates . Results for Cu-Zn-Al are shown in Figure 2a. We propose that, for athermal transitions, the absence of kinetic effects will result in a scaling of the ratio between the acoustic activity and the cooling rate (/). We have evaluated the actual cooling rate at each temperature and the results for / are plotted as a function of temperature in Fig. 2b. Excellent scaling is observed over all the temperature range and a magnified view of the high temperature region is shown in the inset. The larger scatter for smaller is due to the propagation of the error in the temperature measurement (the relative error in is proportional to ). The results obtained for Cu-Al-Ni are presented in Fig. 3. No scaling is observed over all the temperature domain thus indicating that the transition does not have an athermal character for this alloy system. Instead, the transition is not reproducible and the values for exhibit a stochastic character. The probability distribution of can be characterized by its average value and its standard deviation . The behaviour of these two quantities as a function of can be estimated by performing a statistical analysis of data for a large number of temperature loops. Results are shown in Fig. 4 (solid symbols). The total number of cycles analysed for each value of ranges from 15 for K/min to 150 for K/min.
A proper statistical analysis requires the detection and suppression of any possible systematic deviation of the data or even a fake dependence on which may arise from ageing phenomena during the experiment. To prevent these undesired effects, the experiment was performed as a series of temperature loops (K KK) and each series corresponded to a given value of . The series are separated by low temperature waiting periods randomly selected within the range from 1 to 1000 hours. The studied values for within the sequence are also randomly chosen, and each value appears in the sequence several times. A small drift of (K/month) with ageing time was detected and corrected from the data displayed in Fig. 4. The standard deviation was found to be insensitive to ageing. The inset illustrates the actual histograms of for three different values of .

The behaviour of and can be explained by an adequate theory based on the analysis of the mean first-passage time [16] between the and the martensitic phase. Here we briefly summarise this theoretical approach. The probability for the system to remain in the metastable phase after time is given by: , where is the transition probability per unit time. As for certain systems the transition seems to be athermal, while it is not in others, our main assumption in reproducing the experimental observations is that thermal fluctuations are only active within two characteristic limiting temperatures: when , (no transition is possible), and when , (the transition occurs with absolute certainty). This assumption leads to the following expressions for the average temperature transition and its fluctuations :
where the mean first-passage time and are given by and . is the logarithm of the probability that the transition has not occurred before the temperature is reached, and is given by .
In order to compare the predictions of the model with the experimental results, we must propose a function . Different functions were checked and the results obtained were qualitatively equivalent. The simplest assumption is that exhibits a pole at and a zero at , i.e. , where is a characteristic frequency for nucleation. By inserting into the expression for above, we find:
By a simultaneous non-linear minimum- fitting to the and data for Cu68.4Al27.8Ni3.8, we obtain the following estimations of the three-free-parameter model: K, K and s-1. The fit agrees remarkably well with the experimental data (Fig. 4) and reproduces the increase of with and also the slightly decreasing behaviour of . The fitted values of and are estimations of the extreme values of . Note that K/min renders an estimation of the cooling rate above which no time effects will be observed in Cu68.4Al27.8Ni3.8. On the other hand, for the Cu68.0Zn16.0Al16.0 sample we have found athermal behaviour, even at 0.1 K/min. Assuming that for this sample is similar to the previous one, K. and coincides within the errors and no isothermal behaviour can be observed with the allowed temperature control resolution.
Our results indicate that strictly, at finite temperatures, athermal transitions do not occur. However, in practice, if is small enough, kinetic effects are difficult to observe. In this case (close to the athermal limit), scaling of versus will occur for A.E. measurements. We have verified the robustness of such scaling in the case of the Cu-Zn-Al. We claim that, in general, versus will be independent of , where is the transformed fraction. The model proposed in this letter refers to the nucleation of the first martensite domain in the system. The subsequent growth will be characterised by different energy barriers. For Cu-Zn-Al the fact that scaling extends well below the onset of the transition, reveals that the system satisfies the conditions for it to behave athermally over all the transformation range. In contrast, scaling does not occur for Cu-Al-Ni either at the transition onset or in the subsequent evolution.
A question still remains open: why do the two selected samples, with transition temperatures within the same temperature range, have different ranges? We argue that the origin lies in the small symmetry differences between the corresponding low temperature phases: orthorhombic and hexagonal, which give rise to different accommodation mechanisms of the transformational shape change necessary to minimise the elastic stored energy during the transition. Microgliding and microtwinning are the operative mechanisms in Cu-Zn-Al and Cu-Al-Ni respectively [17]. Our results are consistent with the accepted idea that twinning permits a larger degree of metastability.
To conclude, we have proposed a scaling argument to check when a first-order phase transition can be treated as athermal. The different behaviour exhibited by martensites with different transformation mechanisms has been explained by a single model based on the mean first-passage time. In the light of present results, it is clear that for systems with a lack of scaling, the definition of a single transition temperature is ambiguous: it is a stochastic variable ranging between and which are the limiting temperatures which characterize the transition.
We would like to thank J.M.Sancho and A.Labarta for fruitful discussions. This work has received financial support from CICyT (Project No MAT98-0315) and CIRIT (Project 2000SGR00025). F.J.P acknowledges financial support from DGICyT.
REFERENCES
- [1] Shape Memory Materials, ed. by K.Otsuka and C.M.Wayman, Cambridge University Press, Cambridge (1998).
- [2] Z.Nishiyama, Martensitic Transformations, Academic Press, N.Y., 1978, p. 240.
- [3] For a recent review see A. Planes and Ll.Mañosa, Solid State Phys. 55, 159 (2001).
- [4] G.Bertotti, Hysteresis in Magnetism, Academic Press, San Diego, 1998.
- [5] E.Vives, J.Ortín, Ll.Mañosa, I.Ràfols, R. Pérez-Magrané and A. Planes, Phys. Rev. Lett. 72, 1694 (1994); Ll.Carrillo, Ll.Mañosa, J.Ortín, A.Planes and E.Vives, Phys. Rev. Lett. 81, 1889 (1998).
- [6] Z.Yu, P.C.Clapp, J. Appl. Phys. 62, 2212 (1987); Ll. Mañosa, A.Planes, D. Rouby, M.Morin , P.Fleischmann and J.L.Macqueron, Appl. Phys. Lett, 54, 2574 (1989).
- [7] R. Vergne, J.C. Cotillard, and J.L. Porteseil, Rev. Phys. Appl. 16, 847 (1981).
- [8] M.P. Lilly, A.H. Wootters, and R.B. Hallock, Phys. Rev. Lett. 70, 3347 (1995).
- [9] For a recent review on crackling noise in complex systems see: J.P.Sethna, K.A.Dahmen and C.R.Myers, Nature 410, 242 (2001).
- [10] J.P.Sethna, K.Dahmen, S.Kartha, J.A.Krumhansl, B.W.Roberts and J.D.Shore, Phys. Rev. Lett., 70, 3347 (1993).
- [11] W. Cao, J.A. Krumhansl, R.J. Gooding, Phys. Rev. B 41 11319 (1990); M. Rao, S. Sengupta, Phys. Rev. Lett. 78, 2168 (1997).
- [12] M.Aspelmeyer, U.Klemradt, L.T.Wood, S.C.Moss, and J.Peisl, Phys. Stat. Sol. (a) 174, R9 (1999); T.Kakeshita, T.Saburi and K.Shimizu, Phil. Mag. B, 80, 171 (2000).
- [13] D.A. Vul and B.N. Harmon, Phys. Rev. B 48, 6880 (1993).
- [14] The temperature was measured on the Cu block. The thermal lag between sample and block temperature was calibrated for all the temperature rates investigated. A linear dependence of the lag on has been found consistently with the predictions of an model for heat conduction. See: E.Calvet and H.Prat, Recent progress in microcalorimetry, Pergamon Press (1963).
- [15] The recorded number of counts as a function of time has been double checked by using a continuous analog counter, connected in parallel with the frequency counter. Results are perfectly comparable which means that the dead times inherent to the gated frequency counter are irrelevant for the analysis.
- [16] M.C.Torrent and M.San Miguel, Phys. Rev. A 38, 245 (1988); V.Pérez-Muñuzurri, F.Sagués and J.M.Sancho, Phys. Rev. E 62, 94 (2000).
- [17] J.L.Pelegrina and M.Ahlers, Acta metall. mater. 38, 293 (1990).