Phase states in amorphous carbon111to be published in Nanostructured Carbon for Advanced Application, 185-198, ed. G. Benedek et al. (2001 Kluwer Academic Publisher, Netherlands).
Abstract
Amorphous carbon (a-C) formed under energetic atom deposition and by cooling of a melt by MD simulations in a wide -range is investigated. Simulations of a-C formation with atomic beam deposition reveal a sharp GLC-to-DLC transition with . The average coordination number, , depends on the depositing atom energy. Voronoi polyhedra of the 3-coordinated atoms changes dramatically in the vicinity of the transition while for the 4-coordinated atoms they are changing a few. The elastic moduli along with densities of states of electrons and phonons in the GLC and DLC states are investigated. Changes of a-C with temperature and pressure evolution and GLC-DLC transformations are studied. The map of isoconfigurational states on the ()-plane shows regions of GLC and DLC phases stability.
1 Introduction
Amorphous carbon (a-C) in solid state is a rather big family of carbon materials with many types of short-range and medium-range orders (SRO and MRO). From thermodynamic point of view any a-C is a non-ergodic and non-equilibrium system. The diffusional structure relaxation time in graphite and diamond at K is huge because the activation energy of this process is estimated to be larger than eV. In a-C the structure relaxation processes are also very slow at those temperatures. Therefore many forms of a-C are rather stable to be used and investigated. Structure of solid a-C is a continuous random network (CRN). The local order (LO) of an atom is determined by configuration of its covalently bonded nearest neighbors. Because of polyvalence the a-C network possesses an alternating LO. The topologic disorder of the network originates from both alternating LO and random local distortions. The MRO of CRN is mainly determinated by correlations of atoms of the same LO and by orientational correlation of the Voronoi polyhedra. From general point of view there are no restrictions on the ratios and ( are concentrations of -, -, - fractions), as well as on the range and characteristics of MRO. The structure properties of a-C are determined by kinetics of its formation. For this reason different forms of a-C are characterized by the initial (essentially non-equilibrium) state of C and by the method of its preparation. Here we are concentrated on investigations of topology and properties of a-C obtained by atom (ion) beam deposition deposition and by modelling of cooling of a melt in a wide -range. These forms of a-C have a lot of applications [1-4]. Experimental information concerning the microscopic structure of these materials is incomplete, but big variety of their macroscopic properties is observed. In [2] the a-C films were separated on the graphite-like (GLC) and diamond-like (DLC) rather qualitatively: those films which have macroscopic properties (density, hardness, electric and heat conductivity) similar to that of diamond are treated as DLC. Otherwise the films are GLC. It was believed [4] that mainly the big concentration of bonding is responsible for the diamond-like properties. Meanwhile computer simulations [5] showed up that the distorted -network with low fraction can have diamond-like macroscopic properties. It was still unclear whether there are topological and thermodynamic criteria of the GLC and DLC state classification. The canonical thermodynamic approach is not valid in the case of a non-ergodic system [6]. Therefore we start from the polyamorphizm problem formulation. Then molecular dynamic (MD) computer simulations are used to get an answer whether the polyamorphous states of a-C (GLC and DLC) can be identified or not. It turns out that the positive answer does exist at least in the case of a-C with Tersoff’s or Brenner’s classic empiric potential. The classical empiric potential simulations (CEPS) of a-C formation with atomic beam deposition reveal that a sharp GLC-to-DLC transition takes place with , is the average coordination number of a-C. It depends on the depositing atom energy, . We have compared the densities of states (DOS) of electrons and phonons in the GLC and DLC states. To calculate them the tight-binding MD (TBMD) simulations were performed.
Further changes of a-C with temperature and pressure evolution and GLC-to-DLC transformations in the CEPS are investigated. The map of isoconfigurational states on the ( )-plane shows regions of GLC and DLC phase stability. Specific volume and potential energy of a-C as functions of along with the map of isoconfigurational states allow to determine glass-to-liquid transition temperature, , vs . In result the phase diagram of a-C is constructed. It has to be pointed out from very beginning that all of the obtained results concern the model a-C with the chosen classical empiric potential or with the TB interactions. Nevertheless we believe that they mimic reality at least qualitatively.
2 Polyamorphizm of a-C
The term “polyamorphizm” was introduced in analogy with “polymorphizm” in [7] and then was reintroduced independently by others [8]. Literally it means that a system can exist in two different amorphous phase states of the same composition. Concerning solid amorphous states the given definition became invalid because many non-ergodic structure states with different structure and thermodynamic properties can be stable at the same -point for much longer than the observation time. Moreover the number of the possible structure states is exponentially large (see below). Therefore the free energy has a lot of comparable minima in the phase space (see e.g. [8, 9]). The minima set can be ordered by the following way. A subset of the minima of a comparable depth which are separated by low barriers and correspond to states of different SRO’s forms a basin of the structure states. The basins are separated by higher barriers. Those basins which have comparable depths and similar structure properties of states within them do form megabasins [8]. The number of structure states within of a megabasin is determined by configurational entropy or complexity [6], ( is the index numbering the megabasins):
| (1) |
Here is the number of atoms and is the number of the structure states which do not contribute into the configurational entropy in thermodynamic limit,
| (2) |
Transitions within a basin are governed by the short range atomic rearrangements. The characteristic time of these rearrangements, , is the shortest of the structure transformation times. MRO transformation needs correlated structure rearrangements which can be connected with formation of stressed regions or inner boundaries. This process needs also the short range diffusion. The characteristic time of this transformation, , as a rule, is much longer as compare with . The long-range ordering time, , is the largest of the structure relaxation times. The observation time, , has to be much shorter than , otherwise a stable crystalline phase forms. The averaged within -th megabasin free energy, , depends on . It is the thermodynamic quantity which characterized the amorphous phase and makes understandable the polyamorphism thermodynamics. The difference
| (3) |
determines stability of the amorphous phases. Crossover of the “coexisting curve”,
is the necessary condition of the polyamorphic transformation. Let us denote by the coexistance temperature of phase states and . The transformation is observable with
| (4) |
or
| (5) |
Here , are times of transition from a state within the megabasin into a state within the megabasin . Because of the multiplicity of the structure states within the basins, (1), one can expect that the polyamorphic transformation in result of a sequence of the short range rearrangements is possible and the condition (4) is satisfiable. In the case of a-C it seems that this condition can be fulfilled at least for polyamorphic states which differ mainly by LO. MD simulations mimic the kinetics of the structure formation evolution. The time of state to state transformation which controlled by the short-range rearrangements can be presented in the following form
| (6) |
where , is the Boltzmann’s constant; is the frequency of “attempts” (it is about the Debye frequency); is the activation enthalpy of the short-range rearrangements. , the difference of the free energies of the states, is the thermodynamic driving force of the transformation. This expression is valid with .
The essential difference of the specific volumes, compressibilities and thermal expansion coefficient of graphite and diamond allows to expect that these quantities along with are enough to identify GLC and DLC.
3 Topologic transition in a-C deposited from atom beam
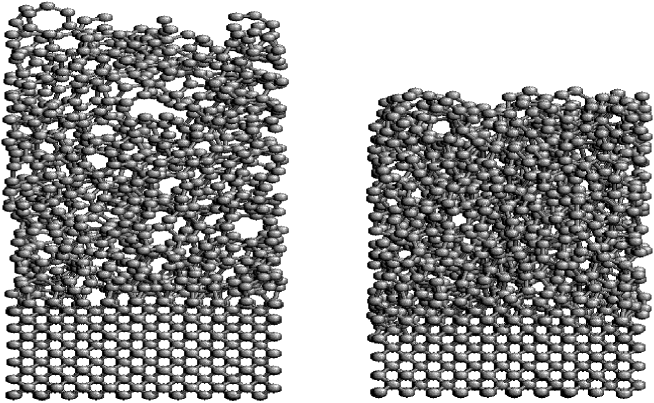
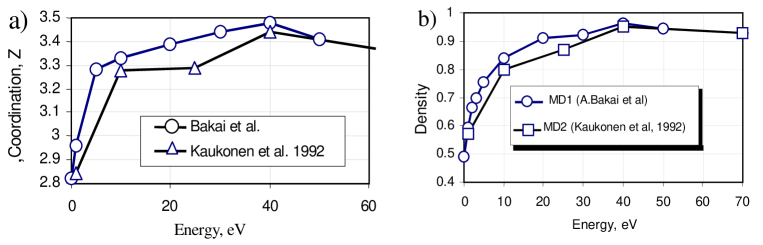
We have performed the CEPS (with Tersoff’s potential) of a-C deposited from atom beam. The structure and properties of the obtained “samples” (with up to ) were investigated. Some results of similar MD simulations of Kaukonnen et al. (with ) are reported in [10]. These results are confirmed in our investigations but our main goal is the assumed polyamorphism of a-C. Beam deposition on diamond substrate at K produces low-density and high-density samples (see Fig. 1), dependently of . Density and coordination number, , vs are shown on Fig. 2. Besides of the dramatic increasing of the density at very low eV, no specific behavior of these quantities are observed. Pair correlation function of 3-fold and 4-fold coordinated atoms show that independently of correlations are significant only up to second coordination shell and that average pair correlation radius, , is about .
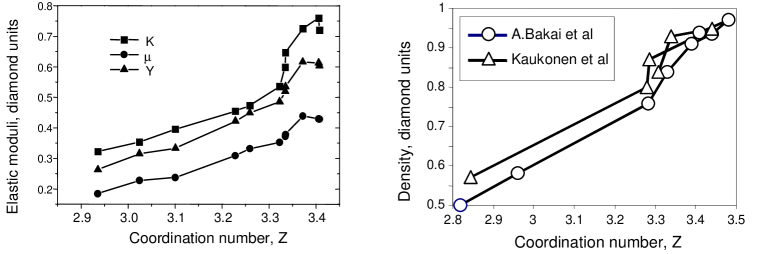
Apparently, SRO determines properties of this a-C. When the density, and bulk, shear and Young moduli, and are plotted vs (Fig. 3), all these quantities “jump” up to in the vicinity of . It looks like a phase transition on . Because the pair correlation functions show up no dramatic changes in the vicinity of it is clear that SRO changes are responsible for the observed singularity.
Voronoi and Deloney divisions (they are dual each to other) are useful in topology investigations. The results of analysis of Voronoi polihedra are presented on Fig. 4 and Fig. 5. Voronoi polihedra of 4-fold coordinated atoms are almost unchanged in shape and volume at any . Voronoi cells of the 3-fold coordinated atoms are distorted three-angled prisms at any but their volume changes essentially. The Voronoi polihedra of the 3-fold and 4-fold coordinated atoms at are shown on Fig. 4.
At low the average volume of cell of 4-fold coordinated atoms, , is something larger than that with , (, due to contribution of micropores in the former case.
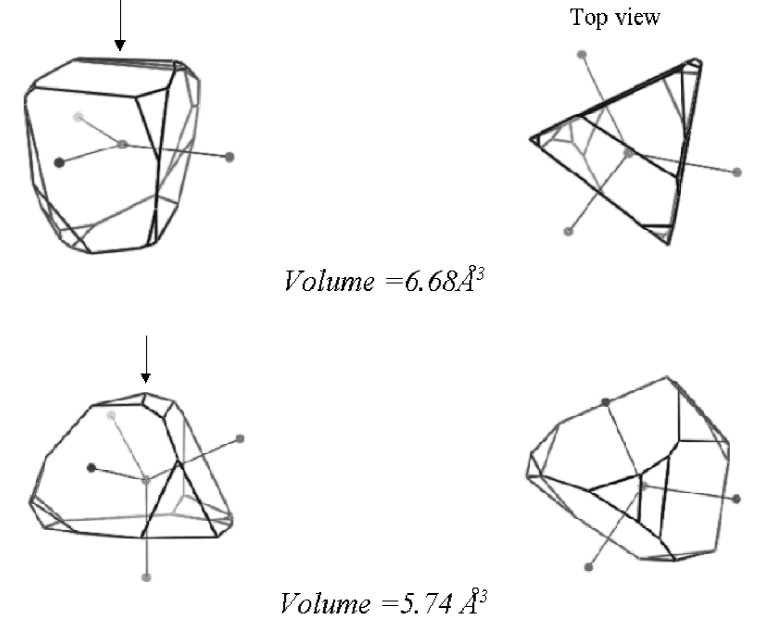
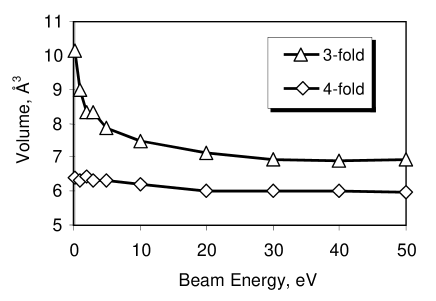
Note that for diamond at . The specific volume of 3-fold coordinated atoms dramatically depends on . It is equal to at and to with . Remarkably that the specific volumes of both 3-fold and 4-fold coordinated atoms do not depend on (or density) with (5). One could say that is close to a quantum limit of 3-fold coordinated carbon. The specific volume of graphite, at , is far above this limit. It is worth noticing that the calculated of a-C at is close to specific volumes of some stable graphens with large distortions of the -network. In onions the interlayer distance for inner layers is about and average volume per atom is about . A similar estimation can be obtained for the volume per atom within inner tubes of multi-wall nanotubes. In [5] the quenched glassy carbon of high density, () in result of relaxation at transforms into stable a-C with and . No essential changes of and were observed on the ending stage of the annealing. Kelires has pointed out that the revealed DLC in its nature is a type of GLC because of low . The estimated specific volume, , in this a-C is what is in nice harmony with obtained numbers in our simulations. To investigate the densities of states of phonons and electrons a TBMD simulation method was used. Cells of up to were cut from the prepared in CEPS samples. Afterward the TBMD simulations were performed to provide the structure relaxation and to get the densities of states. It was found a considerable relaxation of the samples on the initial stage of this procedure. The CEPS give more crude simulation than the TBMD method (for details see [11]). Despite changes of density and coordination in result of the relaxation are not so large, changes of the electron and phonon densities of states of the samples in initial states and after relaxation are significant.
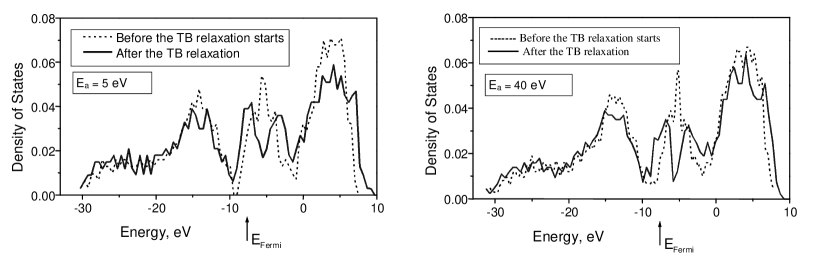
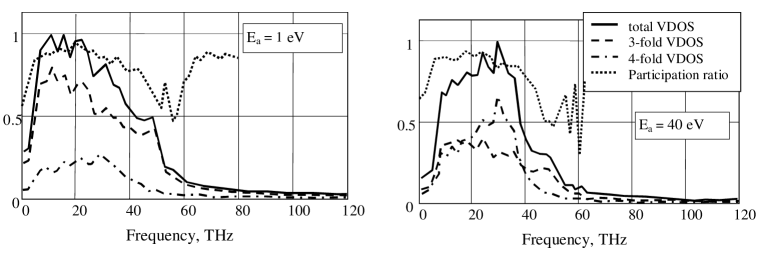
On Fig. 6 the electron density of states for as obtained (dashed line) and TBMD-relaxed sample (solid line) with and are shown. It is seen that the CEPS gives more non-equilibrium configurations and, as a result, a maximum of electron states at Fermi level, , exists. After TBMD-relaxation a pseudogap of about eV width forms around . Very similar electron densities of states are obtained for a-C in [11-13] in TB and Car-Parinello approaches. A minor difference of the electron densities of states of the structures with and can be recognized. It means that the shape of -electron band is not more sensitive to topological disorder when the mobility edge is absent and no extended states do exist. The phonon densities of states are more sensitive to the network local order and topology, because of the changes of the elastic moduli. The participation ratio (doted lines on Fig. 7) is lower with for the high frequency phonons.
(Because the rigidity of a-C is higher with , the main maximum of the phonon density of states is shifted from THz at to THz at ). It means that the localization radius of the high frequency phonons decreases with densification and with increasing distortions around of -bonded atoms. It is worth to note that because the size of the simulation cell is not so large (, is the average interatomic distance) the calculated participation ratio here is rather a qualitative characteristic of the localization phenomenon. The used atomic beam deposition procedure is based on fast quenching of as deposited atoms. The obtained GLC () and DLC () have essentially different structures and properties and coexist at the same just because the time of the depositing atom thermalization and are shorter than (6). Nevertheless the revealed topological transition in the vicinity of is a good starting point to look for metastable polymorphous states of a-C. For this purpose formation and evolution of a-C under fulfilled condition (4) have to be performed (see below).
4 Phase states of a-C
As a result of annealing at and samples of a-C deposited from the atom beam, independently of in initial state, transforms into state with and . In these simulations (CEPS) we have used cells with and . In the initial states the samples had , and . The annealing times were up to ps. No significant changes of states were recognized at the end of the annealing procedure. The obtained by the annealing metastable state of a-C has properties close to that of GLC () formed by beam deposition. The obtained result shows that at , GLC is the equilibrium phase of a-C.
Because in crystalline states along with the stable low pressure phase, graphite, exists also diamond which is stable at high pressure, one could expect that a-C also possesses a phase state which is stable at high pressures. To check this idea we have investigated the states of a-C stabilized at GPa and K.
Two sets of runs were performed.
In the first of them the temperature
was kept constant. In the second set
the pressure was constant.
The simulations at constant temperature
were performed as following. Prepared by atom beam deposition sample
() after
relaxation at a chosen temperature
( K) was compressed step by step.
At each of the steps the linear size of the cell was reduced on
. Then the sample was equilibrated in thermostat during
ps before the next compression step started. One run time
was up to ps. A similar procedure was applied in
simulations with constant pressure. At all pressures
( GPa) initial temperature was chosen to be equal to
K. It increased in successive steps with step width
K.
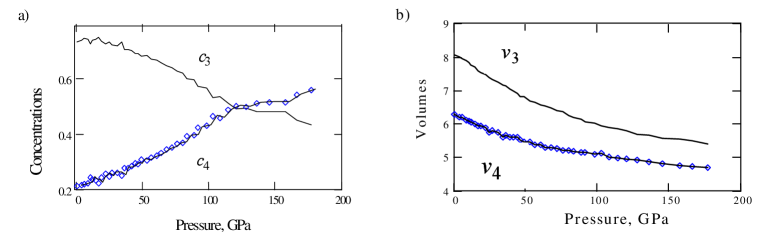
As an example, specific volume, average volumes and , and vs. at K are shown on Fig. 8. The pressure dependence of the specific volume is essentially nonlinear (Fig. 8a) due to changes of LO and coordination. Interestingly that compressibilities of and both are equal to about GPa at GPa what is almost 4 times smaller than those at GPa. It means that with the environments of 3-fold coordinated sites are as rigid as those of the 4-fold coordinated sites. In other words, not coordination but topology of the carbon CRN determines macroscopic properties of a-C.
Results of simulations at constant are depicted on Fig. 9. Specific volume vs. is shown on Fig. 9a.
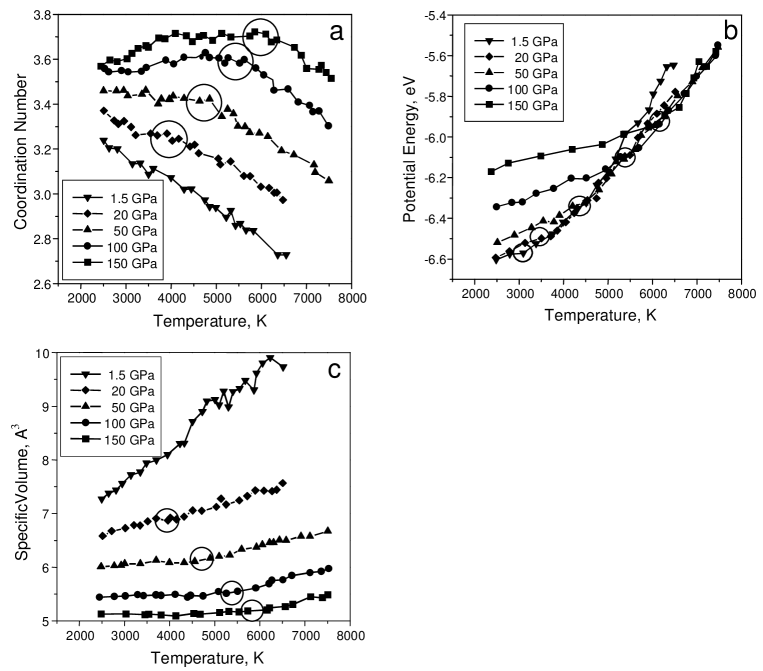
It is seen that the compressibility changes dramatically at GPa, as it took place also at lower temperatures. Besides, the thermal expansion coefficient (it is proportional to slope of ) and the heat capacity (slope of the potential energy, , vs ) change considerably in narrow temperature regions which are marked on Fig. 9 by circles. It is naturally to treat the marked temperatures as because not first but second derivatives of the free energy change step-like at the glass transition. The slope equals about K/GPa. As it is known, depends on the heating and compression rates. In our simulations these rates were varying not so much to recognize this dependence. The results of the investigation of the a-C phase states are summarized on 10 where the levels of constant on the () plane are shown. Because the pair correlation lengths are not considerably dependent on (), the equation
| (7) |
determines curves of isoconfigurational states.
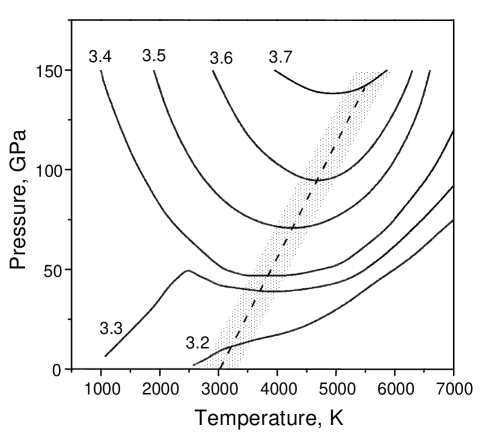
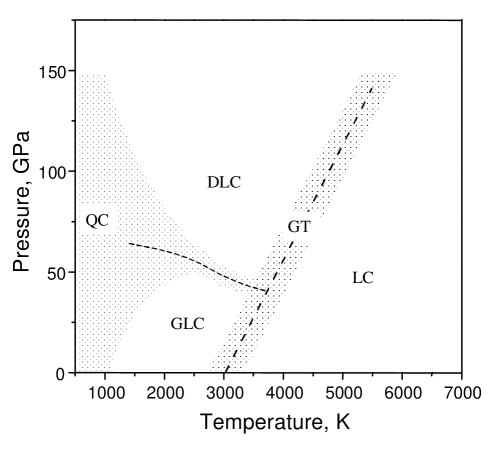
The performed investigations show that the states with have structure and physical properties considerably different from those of states with . Topologies of the isoconfigurational state curves with and are also essentially different. Therefore we can conclude that a -C possesses two phase states, GLC and DLC in the used here terminology. The phase diagram of a-C is shown on Fig. 11. The transition region between GLC and DLC is dashed. The glass-to-liquid transition region is also shown. The applied approach do not allow to conclude whether first order phase transition GLC-to-DLC exists or not. It worth noting that continuous phase transformation without phase transition, are also possible, especially in amorphous states [14-17]. This kind of the phase transformation takes place when heterophase fluctuations are strong in the vicinity of the coexisting curve. To solve the problem of the phase transitions of a- C additional investigations have to be done. As it was pointed above, the structure relaxation kinetics is too slow to be essential below K. Therefore on the map (10.) this temperature region belongs to the quenched a-C states, (QC), in which appreciable short range reordering is not seen.
5 Concluding remarks
Results of the simulations surprisingly support an old idea on the mechanism of DLC formation under ion beam deposition. In accordance with this idea energetic atom or ion forms small (its size depends on the atom energy) region in which local temperature and pressure are rather high to initiate binding formation. If the pressure increases with the energy, , then the concentration has also to increase. Experimental observations agree with idea. In [18-21] the empiric expressions are proposed and used to estimate . Evidently the idea of the fast equipartition of kinetic energy in a compact region on the ballistic stage, when a few atoms are involved in collisions, is incorrect. Just on this stage majority of inelastic replacements and displacements, including bonding changes and formation, happen. Afterward some structure relaxation takes place on the short stage of thermalization and quenching. Nevertheless it turns out that in total complicate collisional and thermalization kinetics of the a-C formation by beam deposition looks like result of generation of statistically independent temperature and pressure microspikes. Let us assume that the structure relaxes toward equilibrium (for the current and ) state and then this last one occurs quenched. With this assumption it has to be concluded that GPa at eV, and GPa with eV with effective temperature K. In [20] effective pressure was estimated to be about GPa in result of an empiric expression fitting. The collision dynamics of depositing atoms bonding rearrangements was investigated in a density functional based TBMD scheme in [22, 23]. It was found that below eV atoms surface rearrangements dominates. The fraction of bonds considerably increases at when subsurface processes dominate. These results are in qualitative agreement with basic ideas formulated in [18-21], but no molten states were identified in the simulations.
Another evident idea concerns rigidity of a-C. Bulk modulus of graphite is almost twice smaller than that of diamond. For this reason it could be expected that the rigidity of a-C increases rapidly with above the site percolation threshold which is equal to for diamond-like lattice. In other words, GLC-to-DLC topologic transition takes place at [24]. Moreover the bulk modulus of DLC has to increase as
| (8) |
above the percolation threshold (see [25, 26, 27]). The elastic moduli of a-C above increases very fast (see Fig.2) but the law (8) evidently is out of rule because, as it was shown above, changes rapidly and rigidities of the - and -networks in the vicinity are almost equal each to other.
Nevertheless manifestations of the percolation transition of -network are considerable in the temperature dependencies of at . As it is seen from Fig. 8 and Fig. 9, is flat or has a positive slope below for the states with , i.e. with . This result can be interpreted as following. Above the percolation threshold the -network forms a rigid skeleton which in average have smaller thermal expansion coefficient than that of the -network. Therefore fringes of the -network play role of compression cell walls for bonded atoms. When temperature increases transformations take place due to thermoelastic stresses. Above the skeleton is molten and, as result, average coordination drops. The basic problem of any simulations is to ascertain to which extension a model mimics reality. The same is with used here approaches. Tersoff’s version of the potential energy allows correctly simulate graphite and diamond structure at low temperatures. But it is not so good (as it is pointed out i. e. in [28, 29]) for simulations at big , in the vicinity of and above . For example, in Tersoff’s version of CEPS the diamond melting temperature is equal to K [30] which is about K larger than the experimentally determined quantity. Currently we are investigating a-C states taking into account the torsion energy. Boundaries of DLC and GLC occupation regions have to be changed, -curve has to be shifted, but schematically the phase state map of a-C is expected to have a similar scheme. Account of the torsion energy impacts on equilibrium concentrations and, consequently, on topology of the isoconfigurational curves. Determined in [28] of diamond is close to the experimentally measured quantity. It is expected that will be lower than that established in the reported here simulations. This expectation is based on the empirical rule:
| (9) |
which valid for all glass-forming substances. For example, with K it has to be K what is in accord with presented above results.
If topology and connectivity of the -network plays a decisive role in GLC-to-DLC transition then the curve
| (10) |
determines the boundary between GLC and DLC phases on the map of isoconfigurational states. Here is the percolation threshold of the -network. The equation (10) determines the curve of topologic phase transition. The site probability to belong to the percolation cluster is its order parameter. The topologic phase transition in a-C occurs directly connected with thermodynamic phase transition since depends on and dynamic, and thermodynamic quantities are sensitive to the CRN topology changes in the vicinity of . If an amorphous phase with exist then phase transition between this phase and a phase with is unavoidable. It is the first order phase transition if changes step-like across the coexistence curve. Otherwise it is the phase transition of a higher order.
As it was reported in [29] -liquid (the liquid with overwhelming 3-fold coordination of atoms) does not exist above the melting point of graphite as it follows from CEPS of carbon in which the torsion energy is taken into account (it is because the torsion energy diminishes entropy of bonded structures as compare to - and -bonding). At lower temperatures role of the entropy in structure formation becomes less important. With that -liquid can appear above of GLC. In this case -liquid-to--liquid transition exists. Currently hunting of this transition is in progress.
References
- [1] A.S. Bakai and V.E. Strelnitskij, Structure and properties of carbon condensates obtained by fast particle flux deposition, (in Russian), Atominform, Moscow, (1984).
- [2] J. Robertson and E.P. O’Reily, Phys.Rev. B 35, 2946 (1987).
- [3] S. Aisenberg, and F.M. Kimock, Mater. Sci. Forum 52, 1 (1990).
- [4] J. Robertson, Progr. Solid State Chem. 2, 199 (1991).
- [5] P.C. Kelires, Phys. Rev. B 47, 1829 (1993).
- [6] R. Palmer, Adv. Phys. 31, 669 (1982).
- [7] L.S. Palatnik, A.A. Nechitailo and A.A Koz’ma, Docl. Akad. Nauk SSSR 36, 1134 (1981).
- [8] C.A. Angell, Science 267, 1924 (1995).
- [9] P.W. Anderson, in Lectures on amorphous systems, R. Balian (ed.), it III-Condensed Matter, North-Holland, Amsterdam, (1979).
- [10] H.P. Kaukonen and R.M. Nieminen, Phys. Rev. Lett. 68, 620 (1992).
- [11] C. Lee, W. Lambrecht, B. Segal, P. Kelires, Th. Frauenheim and U. Stephan, Phys.Rev. B 49, 1148 (1994).
- [12] Th. Frauenheim, P. Blaudeck, U. Stephan and G. Jungnickel, Phys. Rev. B 48, 4823 (1993).
- [13] N.A. Marks, D.R. Mckenzie, B.A. Pailthorpe, M. Bernasconi and M. Parrinello, Phys. Rev. B 54, 9703 (1996).
- [14] A.S. Bakai, Low Temp. Phys. 22, 733 (1996).
- [15] A.S. Bakai, Low Temp. Phys. 24, 20 (1998).
- [16] E.W. Fischer and A.S. Bakai, in Slow dynamics in complex systems, M. Tokuyama and I. Oppenheim (eds.), AIP Conf. Proc. 1999, 469, 325 (1999).
- [17] A.S. Bakai, Condenced Matter Phys. 3, 675 (2000).
- [18] J. Robertson, Diamond Relat. Mater. 2, 984 (1993).
- [19] C.A. Davis, Thin Solid Films 226, 30 (1993).
- [20] P.J. Fallon, V.S. Veerasamy, C.A. Davis, et. al., Phys. Rev. B 48, 4777 (1993).
- [21] Y. Lifshitz, S.R. Kasi and J.W. Rabalais, Mater. Sci. Forum 52-53, 237 (1990).
- [22] S. Uhlmann, Th. Frauenheim and U. Stephan, Phys. Rev. B 51, 4541 (1995).
- [23] S. Uhlmann, Th. Frauenheim and S. Lifshitz, Phys. Rev. Lett. 81, 641 (1998).
- [24] D. Stauffer, Introduction to percolation theory, Tailor & Francis Ltd. (1985).
- [25] Y.Kantor and I. Webman, Phys. Rev. Lett. 52, 1891 (1984).
- [26] D. Bergman, Phys. Rev. B 31, 1696 (1982).
- [27] A.S. Bakai, V.Yu. Gonchar, S.V. Krikun and G.Ya. Lubarsky, Functional materials 2, 222 (1995).
- [28] N.J. Glosli and F.H. Ree, J.Chem. Phys. 110, 441 (1999).
- [29] N.J. Glosli and F.H. Ree, Phys. Rev. Lett. 82, 4659 (1999).
- [30] J.Tersoff, Phys. Rev. Lett. 61, 2879 (1988).