[
Phonons and Lattice Dielectric Properties of Zirconia
Abstract
We have performed a first-principles study of the structural and vibrational properties of the three low-pressure (cubic, tetragonal, and especially monoclinic) phases of ZrO2, with special attention to the computation of the zone-center phonon modes and related dielectric properties. The calculations have been carried out within the local-density approximation using ultrasoft pseudopotentials and a plane-wave basis. The fully relaxed structural parameters are found to be in excellent agreement with experimental data and with previous theoretical work. The total-energy calculations correctly reproduce the energetics of the ZrO2 phases, and the calculated zone-center phonon frequencies yield good agreement with the infrared and Raman experimental frequencies in the monoclinic phase. The Born effective charge tensors are computed and, together with the mode eigenvectors, used to decompose the lattice dielectric susceptibility tensor into contributions arising from individual infrared-active phonon modes. This work has been partially motivated by the potential for ZrO2 to replace SiO2 as the gate-dielectric material in modern integrated-circuit technology.
pacs:
PACS numbers: 77.22.-d, 61.66.-f, 63.20.-e, 77.84.Bw]
I Introduction
ZrO2, or zirconia, has a wide range of materials applications because of its high strength and stability at high temperature. A prospective application of particular current interest is its possible use to replace SiO2 as the gate-dielectric material in metal-oxide-semiconductor (MOS) devices.
The use of SiO2 as the gate dielectric, and in particular the quality of the Si/SiO2 interface, have been a foundation of modern integrated-circuit technology since its invention decades ago. Driven by the seemingly endless pressure for higher operation speed, smaller physical dimensions, and lower driving voltage, the gate dielectric thickness in integrated circuits has been rapidly reduced from the order of 12m in the early 1960s to the current value of about 23 nm. If SiO2 is not replaced by another material, this would require the gate dielectric thickness to be reduced to less than 1 nm in the coming decade.[1] Such a reduction in gate oxide thickness, however, would impose several severe problems on the current Si/SiO2 semiconductor technology, including a high level of direct tunneling current, a large degree of dopant (boron) diffusion in the gate oxide, and reliability problems associated with nonuniformity of the very thin film. It has been demonstrated that the direct tunneling current grows exponentially as the thickness of the gate dielectric film decreases.[2, 3] For films thinner than 2 nm, the tunneling current could become as large as 1 A/cm2, which would require a level of power dissipation that would be intolerable for most digital device applications.[4] These fundamental problems are largely attributable to the inherently low dielectric constant of silicon dioxide (), quite small in comparison with many other oxide dielectrics.
Several approaches have been proposed for overcoming these fundamental challenges associated with the use of SiO2 films. In particular, much recent effort has been focused on metal oxides having a larger dielectric constant than that of SiO2, since these might be used to provide physically thicker dielectric films that are equivalent to much thinner SiO2 ones in terms of their capacitance, but exhibiting a greatly reduced leakage current. Some of the proposed candidates include Ta2O5,[5, 6] TiO2, ZrO2, Y2O3, Al2O3, and hafnium and zirconium silicate systems (Hf1-xSixO2 and Zr1-xSixO2).[7] Among these candidates, ZrO2 is a promising one because of its good dielectric properties () and thermodynamic stability in contact with the Si substrate.
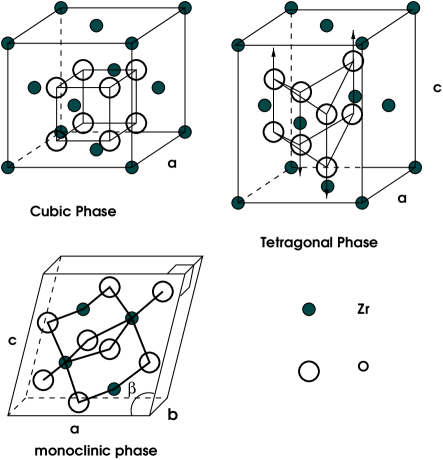
Zirconia is known to have three low-pressure structural phases. The system passes from the monoclinic ground state to a tetragonal phase, and then eventually to a cubic phase, with increasing temperature. The monoclinic phase (space group or ) is thermodynamically stable below 1400 K. Around 1400 K a transition occurs to the tetragonal structure (space group or ), which is a slightly distorted version of the cubic structure and is stable up to 2570 K. Finally, the cubic phase (space group or ) is thermodynamically stable between 2570 K and the melting temperature at 2980 K. This information is summarized in Table I, which also shows the coordination number of the Zr and O atoms for each of the three phases. In the monoclinic phase there are two nonequivalent oxygen sites with coordination numbers of 3 (O1) and 4 (O2), while all the Zr atoms are equivalent and have a coordination of 7.
Our purpose is to investigate the lattice contributions to the dielectric properties of these three ZrO2 phases, especially the monoclinic phase. Because previous experimental and theoretical work indicates that the electronic contribution to the dielectric constant is rather small () and is neither strongly anisotropic nor strongly dependent on structural phase, [8, 9, 10, 11, 12] and because is best calculated by specialized linear-response techniques, we have not calculated it here. Instead, we focus on the lattice contributions to the dielectric response because, as we shall see, these are much larger, more anisotropic, and more sensitive to the lattice structure.
| Coordination | |||||
|---|---|---|---|---|---|
| Phase | Space group | (K) | Zr | O1 | O2 |
| Cubic | 2570 - 2980 | 8 | 4 | 4 | |
| Tetragonal | 1400 - 2570 | 8 | 4 | 4 | |
| Monoclinic | 1400 | 7 | 3 | 4 | |
In order to achieve this, the Born effective charge tensors and the force-constant matrices are calculated for the three ZrO2 phases using density-functional theory. We first check that our relaxed structural parameters and energy differences between phases are consistent with previous theoretical [13, 14, 15, 16, 17, 18, 19, 20] and experimental work.[21, 22] The Born effective charge tensors are then computed from finite differences of polarizations as various sublattice displacements are imposed, with the polarizations computed using the Berry-phase method.[23] The force constants are obtained in a similar way from finite differences of forces. Reasonable agreement is found between the calculated frequencies and the measured spectra for both IR-active and Raman-active modes, [9, 24, 25, 26, 27] although possible reassignments are proposed for certain modes based on the results of our calculations. Finally, our theoretical information is combined to predict the lattice contributions to the bulk dielectric tensor. We thus clarify the dependence of the dielectric response on crystal phase, orientation, and lattice dynamical properties. In particular, we find that the lattice dielectric tensors in the tetragonal and monoclinic phases are strongly anisotropic. We also find that the monoclinic phase has the smallest orientationally-averaged dielectric constant of the three phases, owing to the fact that the mode effective charges associated with the lowest-frequency modes are rather weak.
The paper is organized as follows. In Sec. II we briefly describe the technical aspects of our first-principles calculations. Sec. III presents the results, including the structural relaxations, the Born effective charge tensors, the phonon normal modes, and the lattice contributions to the dielectric tensors. Sec. IV concludes the paper.
II Details of First-Principles Calculations
The calculations are carried out within a plane-wave pseudopotential implementation of density-functional theory (DFT) in the local-density approximation (LDA) using Ceperley-Alder exchange-correlation.[28, 29] The use of Vanderbilt ultrasoft pseudopotentials [30] allows a highly accurate calculation to be achieved with a low energy cutoff, which is chosen to be 25 Ry in this work. The and semicore shells are included in the valence for Zr, and the and shells are included in the valence for O. A conjugate-gradient algorithm is used to compute the total energies and forces. For each of the three ZrO2 phases, a unit cell containing 12 atoms (4 Zr and 8 O atoms) is used in our calculations. Although we thus use an unnecessarily large cell for the cubic and tetragonal phases, this approach has the advantage that the three zirconia phases can be studied in a completely parallel fashion.
A 444 Monkhorst-Pack [31] k-point mesh is found to provide sufficient precision in the calculations of total energies and forces. In order to calculate Born effective charges and force-constant matrices, each atomic sublattice in turn is displaced in each Cartesian direction by 0.2% in lattice units, and the Berry-phase polarization [23] and Hellmann-Feynman forces are computed. To be specific, a 4420 k-point sampling over the Brillouin zone was used in the Berry-phase polarization calculations, and we have confirmed that good convergence was achieved for the three ZrO2 phases with such k-point sampling. The Born effective charge tensors and force-constant matrices are then constructed by finite differences from the results of these calculations.
III Results
A Atomic Structures of ZrO2 Phases
The three crystal structures of ZrO2 are shown in Fig. 1. Cubic zirconia takes the fluorite (CaF2) structure, in which the Zr atoms are in a face-centered cubic structure and the oxygen atoms occupy the tetrahedral interstitial sites associated with this fcc lattice. The structure of tetragonal zirconia can be regarded as a distortion of the cubic structure obtained by displacing alternating pairs of oxygen atoms up and down by an amount along the direction, as shown in the figure. This doubles the primitive cell from three to six atoms and is accompanied by a tetragonal strain. The structure can be specified by the two lattice parameters and and a dimensionless ratio . Cubic zirconia can be considered as a special case of the tetragonal structure with and (if the primitive cell is used for tetragonal phase, ).
Monoclinic zirconia has a lower symmetry and a more complex geometric structure with a 12-atom primitive cell. The lattice parameters are , , , and (the non-orthogonal angle between and ) as shown in Fig. 1. The atomic coordinates in Wyckoff (lattice-vector) notation are and , with parameters , and specified for each of three kinds of atoms: Zr, O1, and O2. Note that there are two non-equivalent oxygen sites: atoms of type O1 are 3-fold coordinated, while O2 are 4-fold coordinated. All Zr atoms are equivalent and are 7-fold coordinated. Thus, four lattice-vector parameters and nine internal parameters are needed to specify the structure fully.
| This work | PPa | FLAPWb | Expt.c | |
| Cubic | ||||
| a | ||||
| Tetragonal | ||||
| a | ||||
| c | ||||
| Monoclinic | ||||
| a | ||||
| b | ||||
| c | ||||
Tabulated in Table II are the relaxed structural parameters for the three phases of ZrO2 as computed within our energy minimization procedure, as well as results of previous theoretical and experimental work for comparison. The experimental parameters given in the last column were used as the starting point for our DFT–LDA structural relaxations. It can readily be seen that there is excellent agreement between our results and previous theory and experiment. The volumes are all slightly underestimated, by 2-3%, as is typical of LDA calculations. The largest discrepancy is for , the internal coordinate in the tetragonal phase; our value is 30% smaller than the experimental value, but it is very closed to the results of the previous pseudopotential calculation. (The discrepancy with experiment should not be taken too seriously, in view of the fact that the theory is a zero-temperature one.) The very close (usually 1%) agreement with the previous pseudopotential results of Ref. [16] provides a good confirmation of the reliability of our calculations.
| O1-Zr bond lengths and angles | ||||
|---|---|---|---|---|
| O2-Zr bond lengths and angles | ||||
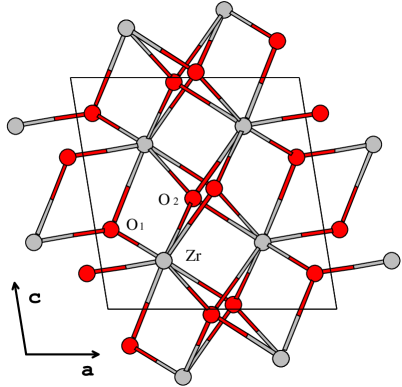
Fig. 2 illustrates the relaxed monoclinic structure, and Table III lists the calculated bond lengths and bond angles for the O–Zr bonds. Bond lengths taken from Ref. [32] are also listed for comparison. As can be seen in the figure, a three-fold coordinated oxygen atom (O1) is bonded to the three nearest-neighbor Zr atoms in an almost planar configuration, as can be verified by noting that the sum of the three bond angles is about 350∘. A second four-fold oxygen atom (O2) forms a distorted tetrahedron with its four nearest Zr neighbors, the degree of distortion being evident from the lengths and angles in the table. The presence of these two distinct oxygen atoms with utterly different environments suggests that their contributions to the dielectric properties of the material may be quite different. We shall see how this is manifest as a difference of the Born effective charge tensors for O1 and O2 in the next subsection.
Our total-energy calculations have correctly reproduced the energetics of the three ZrO2 phases. The differences of total energies per formula unit for the monoclinic and tetragonal phases, relative to the cubic phase, are 0.044 eV and 0.089 eV respectively, to be compared with 0.045 eV and 0.102 eV from previous calculation,[16] and 0.057 eV and 0.120 eV from one experiment.[33]
B Born Effective Charge Tensors
The Born effective charge tensor quantifies the macroscopic electric response of a crystal to internal displacements of its atoms. We begin with a calculation of the bulk polarization P, using the Berry-phase polarization method to compute the electronic contribution, as formulated in Ref. [23]. , the Born effective charge tensor for the -th atom in the unit cell, is defined via
| (1) |
where is the volume of the unit cell, is the displacement of the -th atom in the unit cell, and is the induced change in bulk polarization resulting from this displacement. Using Eq. (1), can be computed from finite differences of P under small but finite distortions.[34]
In the Berry-phase polarization scheme, one samples the Brillouin zone by a set of strings of k-points set up parallel to some chosen reciprocal lattice vector, thereby computing the electronic polarization along that direction. For cubic and tetragonal ZrO2, this is relatively straightforward since the reciprocal lattice vectors are all mutually perpendicular. For monoclinic ZrO2, however, one has to transform the polarization to Cartesian coordinates after first computing it in lattice coordinates.
| Phase | Atom | |||
|---|---|---|---|---|
| Cubic | Zr | |||
| O | 2.86 | 2.86 | 2.86 | |
| Tetragonal | Zr | |||
| O1 | 3.53 | 2.22 | 2.53 | |
| O2 | 2.22 | 3.53 | 2.56 | |
| Monoclinic | Zr | |||
| O1 | 4.26 | 2.64 | 1.19 | |
| O2 | 3.20 | 2.52 | 2.26 |
Our results for the dynamical effective charges of the three phases are presented in Table IV. In the cubic phase, symmetry requires that the Born effective charge tensor should be isotropic () on each atom, and that (O1)=(O2); the neutrality sum rule requires that (Zr)=(O). The values given in Table IV can be seen to be in excellent agreement with the corresponding values of (Zr)=5.75 and (O)=2.86 reported in Ref. [8].
In the tetragonal phase, (Zr) is diagonal in the Cartesian frame with =. The diagonal elements of (O) have the same form, but the shifting of oxygen atom pairs creates two different configurations for oxygen atoms (denoted O1 and O2) and introduces off-diagonal elements. Specifically, (O1)=(O1)=(O2)=(O2). Thus, it is more natural to refer to a reference frame that has been rotated 45∘ about the axis; in this frame the (O) become diagonal. This symmetry analysis is confirmed in our calculations, as can be seen from Table IV. We have recently become aware of the independent work of Ref. [12], which also reports values for the tensors in the tetragonal phase of ZrO2. These authors find =5.74 and =5.15 for Zr, and =3.52, =2.49 and =2.57 for oxygens. Evidently there is again very good agreement between our results and those of previous theory.
In the monoclinic phase, the Born effective charge tensors are more complicated because of the complexity of the lattice structure. The two oxygen sites are now non-equivalent, and the crystal structure should be regarded as composed of three kinds of atoms, namely, Zr, O1, and O2. Each kind of atom appears four times in the unit cell, once at a “representative” Wyckoff position , and then also at partner positions , and given by action of the space-group operations , , {} and {}. Thus, all three kinds of atoms have equally low symmetry, and their resulting tensors are neither diagonal nor symmetric. Specifically, for these representative atoms we find
We have confirmed that our computed effective-charge tensors for the other atoms obey the relations expected by symmetry, namely, that the tensors should be identical for partners at , and that the off-diagonal , , , and matrix elements should change sign for the partners at and . In Table IV we report the eigenvalues of the symmetric part of the effective-charge tensors.
It is obvious from Table IV that the Z∗ values are quite different from the nominal ionic valences (4 for Zr and 2 for O). Except for the value of 1.19, all other magnitudes are greater than their nominal valences. The anomalously large values indicate that there is a strong dynamic charge transfer along the ZrO bond as the bond length varies, indicating a mixed ionic-covalent nature of the ZrO bond. Such an anomaly reflects the relatively delocalized structure of the electronic charge distributions, and is quite common in other weakly ionic oxides such as the ferroelectric perovskites.[35]
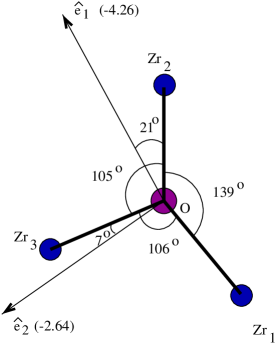
As discussed in Sec. III A, the oxygen atom of type O1 is bonded to three nearest-neighbor Zr atoms in an almost planar configuration. One might then expect that the largest dynamical charge transfer would occur for motions of the O atom in this plane, with a smaller magnitude of for motion perpendicular to this plane. To check this, we computed the eigenvectors that result from diagonalizing the symmetric part of the Born charge tensor of the O1 atom, corresponding to the eigenvalues in the penultimate row of Table IV. Sure enough, the principle axis associated with the eigenvalue =1.19 of smallest magnitude points almost directly normal to the plane of the neighbors (making angles of , and to the three O–Zr bonds). The other two principal axes lie essentially in the plane of the neighbors, as shown in Fig. 3. Moreover, the principal axis connected with the eigenvalue =4.26 of largest magnitude is nearly parallel to the bond to the closest neighbor Zr1. It can also be seen that the vector connected with the intermediate eigenvalue is very nearly aligned with the O1–Zr3 bond. Not surprisingly in view of its more tetrahedral coordination, the tensor for atom O2 is more isotropic, as indicated by the smaller spread of the eigenvalues in the last line of Table IV.
C Phonons
The frequencies of phonons at , the center of the Brillouin zone, are calculated for the cubic, tetragonal and monoclinic phases. For each phase, we first calculate the force-constant matrix
| (2) |
obtained by calculating all the Hellmann-Feynman forces () caused by displacing each ion in each possible direction () in turn. (Here Greek indices label the Cartesian coordinates, and and run over all the atoms in the unit cell.) In practice, we take steps that are 0.2% in lattice units, average over steps in positive and negative directions, and the resulting matrix is symmetrized to clean up numerical errors. The dynamical matrix is then diagonalized to obtain the eigenvalues . Once again, we will mainly focus on the monoclinic phase, and briefly summarize the results for the cubic and tetragonal phases.
| Cubic | This work | |||
|---|---|---|---|---|
| 1 | 258 () | |||
| Tetrag. | This work | Expt. [38] | Expt. [39] | Ref. [37] |
| 1 | 154 () | 140 | 164 | 146 |
| 2 | 437 () | 550 | 467 | 466 |
| 3 | 334 () | 320 | 339 | 274 |
| Mono. | This work | Expt. [9] | Expt. [25] | Expt. [27] |
| 104 | ||||
| 1 | 181 ( | 180 | ||
| 192 | ||||
| 2 | 224 () | 235 | 220 | 224 |
| 3 | 242 () | |||
| 4 | 253 () | 270 | 250 | 257 |
| 5 | 305 () | |||
| 6 | 319 () | 324sh (?) | ||
| 7 | 347 () | |||
| 8 | 355 () | 360 | 330 | 351 |
| 375 | 370 | 376 | ||
| 9 | 401 () | |||
| 10 | 414 () | 415 | 420 | 417 |
| 445 | 440 | 453sh | ||
| 11 | 478 () | |||
| 12 | 483 () | 515 | 520 | 511 |
| 13 | 571 () | 620 | 600 | 588 |
| 14 | 634 ( | 687 (?) | ||
| 725 (?) | ||||
| 15 | 711 () | 740 | 740 | 789 |
The low-temperature phase of ZrO2 is monoclinic, with space group . The little group at is the point group consisting of operations , , , and . The character table of this point group indicates that there are four symmetry classes and thus four irreducible representations, each of which is one-dimensional. A standard group-theoretical analysis indicates that the modes at the point can be decomposed as
| (3) |
(see also Ref. [24]). Of the 36 modes, 18 modes () are Raman-active and 15 modes () are infrared-active, the remaining three modes being the zero-frequency translational modes. Only the 15 infrared-active modes contribute to the lattice dielectric tensor, as discussed in the next subsection. Similarly, for the tetragonal ZrO2 phase,
| (4) |
where the and representations are two-dimensional while all other modes are one-dimensional. One mode and one pair are acoustic, leaving one IR-active and two IR-active pairs; , and are Raman-active, and is silent (see also Ref. [36]). For the cubic phase one finds
| (5) |
where both and representations are three-dimensional. One of the triplets is translational, leaving one IR-active triplet.
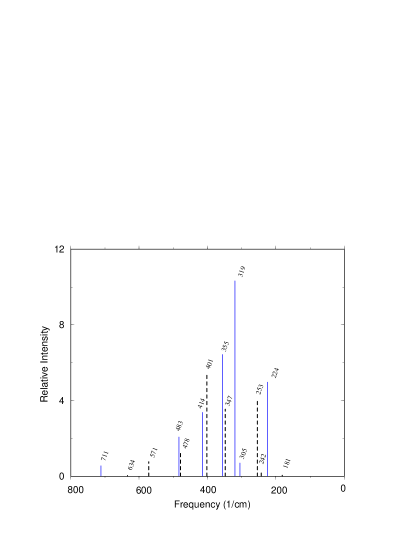
Table V lists our calculated IR-active phonon frequencies in comparison with available theoretical [37] and experimental values.[9, 25, 27, 38, 39] In some cases, possible reassignments are suggested. The overall agreement is very good; we obtain all the major features of the experimental infrared spectra. In order to facilitate comparison with experiment, the oscillator strengths of the infrared-active modes (namely , see Eqs. (8-9) of the Sec. III D) are calculated and plotted versus frequency in Fig. 4. The horizontal axis is reversed for comparison with experimental spectra such as that of Fig. 2 of Ref. [25]. The solid and dashed lines indicate and modes, respectively. The two modes at 181 cm-1 and 634 cm-1 are very weak, so that it is not surprising that they were not observed in most experiments. The mode at 242 cm-1 is buried by the modes at 253 cm-1 and 224 cm-1, while the mode at 305 cm-1 is similarly shadowed by the strongest mode at 319 cm-1. Because the pairs of modes at 347/355 cm-1, 401/414 cm-1 and 478/483 cm-1 are very close and of comparable strength, we think that they might be observed as single modes in the experiments.
The calculated Raman-active phonon mode frequencies for the monoclinic structure are summarized in Table VI. The overall pattern of the calculated Raman-active spectrum agrees quite well with the experimental results, but we again suggest possible reassignments of some of the modes. Specifically, we obtained one Raman-active mode at 180 cm-1 that was not observed in either experiment. We agree with Carlone [26] in excluding the mode at 355 cm-1 suggested in Ref. [24], and in interpreting the feature at 780 cm-1 as a first-order and not a second-order one.[24] On the other hand, our calculations do not give any frequency close to 705 cm-1 as observed by Carlone.[26] The mode at 317 cm-1 obtained in our calculation is observed somewhat ambiguously in one experiment [24] but not in the other.[26] The reason why we assigned the highest calculated mode at 748 cm-1 as shown in Table VI is that the corresponding Raman spectra at 15 K indicated this mode at 745 cm-1.[26]
The overall good correspondence between our results and the experimental data for both infrared and Raman-active modes therefore tends to justify our phonon analysis, suggesting that we are now on firm ground to proceed to the calculation of the lattice contributions to the dielectric tensors for the ZrO2 phases.
D Lattice Dielectric Tensors
In this section, we present our calculations of the lattice contributions to the static dielectric tensor (), which can be separated into contributions arising from purely electronic screening () and IR-active phonon modes according to [40]
| (6) |
Here and label Cartesian coordinates, is the electron charge, is a reference mass that we take for convenience to be 1 amu, is the frequency of the -th IR-active phonon normal mode, and is the volume of the three-atom, six-atom, or 12-atom unit cell for cubic, tetragonal, or monoclinic cases, respectively. The mode effective charge tensors are given by
| (7) |
where , the eigendisplacement of atom in phonon mode , is normalized according to . It is also convenient to write
| (8) |
where
| (9) |
is the contribution to the trace of the dielectric tensor coming from the mode , and the scalar mode effective charge is defined via .
Presented in Table VII are the scalar mode effective charges and the corresponding contribution to the static dielectric response for each IR-active mode. (Note that and modes are three-fold and two-fold degenerate, respectively. The vs. for the monoclinic phase are also presented graphically in Fig. 4.) From Table VII or Fig. 4, we find that for the monoclinic phase the softest modes have small values and hence do not contribute much intensity, while the modes with largest are at significantly higher frequency ( 319 cm-1). This observation will be important for explaining the relative smallness of the dielectric tensor of the monoclinic phase, as discussed below.
| Mode | This Work | Mode | Expt. [26] | Mode | Expt. [24] |
| 1 | 92 | ||||
| 1 | 103 () | 1 | 99 | 2 | 101 |
| 148 | |||||
| 2 | 175 () | 2 | 177 | 3 | 177 |
| 3 | 180 () | ||||
| 4 | 190 () | 3 | 189 | 4 | 189 |
| 5 | 224 () | 4 | 222 | 5 | 222 |
| 5 | 270 | 266 | |||
| 6 | 313 () | 6 | 305 | 6 | 306 |
| 7 | 317 () | 7 | 315 | ||
| 8 | 330 () | 7 | 331 | 8 | 335 |
| 9 | 345 () | 8 | 343 | 9 | 347 |
| 10 | 355 | ||||
| 10 | 381 () | 9 | 376 | ||
| 11 | 382 () | 10 | 376 | 11 | 382 |
| 12 | 466 () | 11 | 473 | 12 | 476 |
| 13 | 489 () | 12 | 498 | 13 | 502 |
| 14 | 533 () | 13 | 534 | 14 | 537 |
| 15 | 548 () | 14 | 557 | 15 | 559 |
| 16 | 601 () | 15 | 613 | 16 | 616 |
| 17 | 631 () | 16 | 633 | 17 | 637 |
| 17 | 705 | ||||
| 18 | 748 () | 18 | 780 | 764 |
| Mode (cm-1) | |||
|---|---|---|---|
| Cubic | 258 () | ||
| Tetragonal | 154 () | ||
| 334 () | |||
| 437 () | |||
| Monoclinic | 181 () | ||
| 224 () | |||
| 242 () | |||
| 253 () | |||
| 305 () | |||
| 319 () | |||
| 347 () | |||
| 355 () | |||
| 401 () | |||
| 414 () | |||
| 478 () | |||
| 483 () | |||
| 571 () | |||
| 634 () | |||
| 711 () |
When all the modes are summed over, we obtain the total lattice contribution to the static dielectric response (the second term of Eq. (6)). We find
The calculated dielectric tensors have the correct forms expected from the crystal point group: the cubic one is diagonal and isotropic, the tetragonal one is diagonal with , and the monoclinic one is only block-diagonal in and subspaces. Our values are also in very good agreement with previous theoretical calculations for the cubic and tetragonal phases. Ref. [12] reports that for the cubic phase, within about 6% of our result. Ref. [12] also gives the two independent components of in the tetragonal phase as 42.36 and 15.03, again in excellent agreement with our results, and showing the same enormous anisotropy.
To compare with experiment, we note that can be estimated from the index of refraction , which has been reported experimentally to be about 2.16 (),[11] 2.192 (),[10] and 2.19 () [9] for the cubic, tetragonal and monoclinic ZrO2 phases, respectively. Theoretical works have reported that the orientational average for cubic ZrO2,[8] and and () for tetragonal ZrO2.[12] We can see that does not vary strongly with structural phase, nor is there any evidence for strong anisotropy. Moreover, the only experimental measurements of of which we are aware are on polycrystalline samples, for which we need to take an orientational average anyway. Therefore, we somewhat arbitrarily assume an isotropic value of =5.0 for the purposes of comparison with the total dielectric response. Then we obtain orientationally averaged static dielectric constants of 36.8, 46.6 and 19.7 for the cubic, tetragonal and monoclinic ZrO2 phases, respectively.
Experimental reports of the value of for monoclinic ZrO2 span a wide range from about 16 to 25; [9, 41] our estimated value of 19.7 falls comfortably in the middle of this range. Unfortunately, we are not aware of any experimental measurements of the static dielectric response in the cubic or tetragonal phase. Since these phases exist only at elevated temperatures, comparison with zero-temperature theory would need to be made with caution in any case. However, neither the cubic–tetragonal nor the tetragonal–monoclinic transition is ferroelectric in character, so the influence of the thermal fluctuations on is is probably not drastic.
E Discussion
As indicated in the Introduction, much current interest in ZrO2 and related oxides is driven by the search for high- materials for use as the gate dielectric in future-generation integrated-circuit devices. While the dielectric constant of monoclinic ZrO2 is much bigger than that of SiO2, our results indicate that it is actually rather low compared to the values in the range 35-50 expected for the tetragonal and cubic phases. From this perspective, it appears that monoclinic ZrO2 has a disappointingly low static dielectric response.
As can be seen from Eq. (6) or (9), the contribution of a given mode to the dielectric response scales as , so that a large will result if there are modes that have simultaneously a large and a small . As can be seen from Table VII, this is not the case for monoclinic ZrO2. Instead, we find that the cluster of modes with the lowest frequencies (cm-1) also have low values (), while the most active modes reside at higher frequencies (cm-1). This is in direct contrast to the case of the cubic perovskite CaTiO3 studied recently by Cockayne and Burton,[42] who find a very soft mode cm-1) and very active ( mode, contributing to an enormous dielectric constant .
The much larger values of obtained for the cubic and tetragonal phases suggests that the unfavorable coincidence of low- and low- values may be peculiar to the monoclinic phase, and that other structural modifications (e.g., quasi-amorphous structures) may actually have a significantly larger . This clearly presents an avenue for future study.
Finally, in low-symmetry structures such as the monoclinic (or especially amorphous) phases, it is of interest to attempt to decompose spatially into contributions coming from different atoms in the structure. For example, one might ask whether it is primarily the three-fold or the four-fold oxygens that are responsible for the dielectric response in the monoclinic phase. For this purpose, we first carry out a decomposition of the lattice dielectric tensor into contributions
arising from pairs of atoms, where and are the eigenvalue and eigenvector of the force constant matrix for the phonon mode , is the volume of unit cell, and . We then heuristically define the contribution coming from atom to be
| (10) |
This atom-by-atom decomposition attributes most of the contribution to as coming from the Zr atoms (exactly 2/3 in the cubic phase and close to this ratio in the other two phases). As for the oxygen, we found that both the three-fold and four-fold oxygen atoms make a similar contribution to the orientationally averaged dielectric constant in the monoclinic phase. (Not surprisingly, the anisotropies of the two oxygen contributions are somewhat different.) While this analysis has not proven especially fruitful here, it may be useful in future studies of low-symmetry (e.g., amorphous) phases.
IV Conclusion
In summary, we have investigated here the Born effective charge tensors, lattice dynamics, and the contributions of the lattice modes to the dielectric properties of the three ZrO2 phases. The structural parameters, including all internal degrees of freedom of the three ZrO2 phases, are relaxed, and excellent agreement is achieved with experimental structural refinements and with previous ab initio calculations. The observed relative stability of the ZrO2 phases is reproduced in our calculation. The calculated Born effective charge tensors show anomalously large values of , reflecting a strong dynamic charge transfer as the bond length varies and indicating a partially covalent nature of the ZrO bonds. The calculated zone-center phonon mode frequencies are in good agreement with infrared and Raman experiments.
Finally, the lattice contributions to the dielectric tensors have been obtained. We find that the cubic and tetragonal phases have a much larger static dielectric response than the monoclinic phase, with an especially strong anisotropy in the tetragonal structure. The relatively low in monoclinic ZrO2 arises because the few lowest-frequency IR-active modes happen to have rather small oscillator strengths, while the modes with the strongest dynamical mode effective charges occur at higher frequency. This result, together with the predicted increase of in the cubic and tetragonal phases, suggests that the static dielectric constant is a strong function of the structural arrangement. Thus, there may be a prospect for larger values in structurally modified (e.g., amorphous) forms of ZrO2, or in solid solutions of ZrO2 with other oxides.
Acknowledgments
This work was supported by NSF Grant 4-21887. We would like to thank E. Garfunkel for useful discussions. One of us (X.Z.) thanks I. Souza for helpful discussions in connection with the calculation of Born effective charge tensors.
REFERENCES
- [1] L.C. Feldman, E. P. Gusev, and E. Garfunkel, Ultrathin Dielectrics in Silicon Microelectrics.
- [2] D. A. Buchanan and S. H. Lo, Microelectronic Engineering 36, 13 (1997).
- [3] G. Heiser and A. Schenk, J. Appl. Phys. 81, 7900 (1997).
- [4] H. S. Momose, M. Ono, T. Yoshitomi, T. Ohguro, S. I, Nakamura, M. Saito, and H. Iwai, IEEE Trans. Electron Devices 43, 1233 (1996).
- [5] G. B. Alers, D. J. Werder, Y. Chabal, H. C. Lu, E. P. Gusev, E. Garfunkel, T. Gustafsson, and R. S. Urdahl, Appl. Phys. Lett. 73, 1517 (1998).
- [6] J. V. Grahn, P. E. Hellberg, and E. Olsson, J. Appl. Phys. 84, 1632 (1998).
- [7] G. D. Wilk, R. M. Wallance, and J. M. Anthony, J. Appl. Phys. 87, 484 (2000).
- [8] F. Detraux, Ph. Ghosez, and X. Gonze, Phys. Rev. Lett. 81, 3297 (1998).
- [9] A. Feinberg and C. H. Perry, J. Phys. Chem. Solids 42, 513 (1981).
- [10] R. H. French, S. J. Glass, F. S. Ohuchi, Y. N. Xu, and W. Y. Ching, Phys. Rev. B 49, 5133 (1994).
- [11] D. L. Wood and K. Nassau, Appl. Opt. 12, 2978 (1982).
- [12] G.-M. Rignanese, F. Detraux, X. Gonze, and A. Pasquarello, Phys. Rev. B (in press).
- [13] E. V. Stefanovich, A. L. Shluger, and C. R. A. Catlow, Phys. Rev. B 49, 11560 (1994).
- [14] M. Wilson, U. Schonberger, and M. W. Finnis, Phys. Rev. B 54, 9147 (1996).
- [15] J. K. Dewhurst and J. E. Lowther, Phys. Rev. B 57, 741 (1998).
- [16] B. Krlik, E. K. Chang, and S. G. Louie, Phys. Rev. B 57, 7027 (1998).
- [17] G. Jomard, T. Petit, A. Pasturel, L. Magaud, G. Kresse, and J. Hafner, Phys. Rev. B 59, 4044 (1999).
- [18] G. Stapper, M. Bernasconi ,N. Nicoloso, and M. Parrinello, Phys. Rev. B 59, 797 (1999).
- [19] S. Fabris, A. T. Paxton, and M. W. Finnis, Phys. Rev. B 61, 6617 (2000).
- [20] H. J. F. Jansen, Phys. Rev. B 43, 7267 (1991).
- [21] C. J. Howard, R. J. Hill, and B. E. Reichert, Acta Crystallogr. Sect. B 44, 116 (1988).
- [22] P. Aldebert and J. P. Traverse, J. Am. Ceram. Soc. 68, 34 (1985).
- [23] R. D. King-Smith and D. Vanderbilt, Phys. Rev. B 47, 1651 (1993).
- [24] E. Anastassakis, B. Papanicolaou, and I. M. Asher, J. Phys. Chem. Solids 36, 667 (1975).
- [25] T. Hirata, Phys. Rev. B 50, 2874 (1994).
- [26] C. Carlone, Phys. Rev. B 45, 2079 (1992).
- [27] H. Zhang, Y. Liu, K. Zhu, G. Siu, Y. Xiong, and C. Xiong, J. Phys. Cond. Matter 11, 2035 (1999).
- [28] D. M. Ceperley and B. J. Alder, Phys. Rev. Lett. 45, 566 (1980).
- [29] We used LDA but not GGA in this work for two reasons. First, we wanted to facilitate comparison with previous DFT studies on ZrO2 that were carried out using LDA. Second, Ref. [17] has tested the effect of LDA and GGA’s (PW91 and PB) on ZrO2. These authors find that while the lattice parameters increase slightly with the use of the GGA ( is augmented less than 1% for the monoclinic ZrO2), the and ratios and internal structural parameters are almost unaffected.
- [30] D. Vanderbilt, Phys. Rev. B 41, 7892 (1990).
- [31] H. J. Monkhorst and J. D. Pack, Phys. Rev. B 13, 5188 (1976).
- [32] D. K. Smith and H. W. Newkirk, Acta. Crystallogr. 18, 983 (1965).
- [33] R. Ackermann, E. G. Rauh, and C. A. Alexander, High. Temp. Sci. 7, 304 (1975).
- [34] R. Resta, M. Posternak, and A. Baldereschi, Phys. Rev. Lett. 70, 1010 (1993).
- [35] W. Zhong, R. D. King-Smith, and D. Vanderbilt, Phys. Rev. Lett. 72, 3618 (1994).
- [36] P. Bouvier, H. C. Gupta, and G. Lucazeau, J. Phys. Chem. Solids 62, 873 (2001).
- [37] A. P. Mirgorodsky, M. B. Smirnov, and P. E. Quintard, J. Phys. Chem. Solids 60, 985 (1997).
- [38] T. Hirata, E. Asari, and M. Kitajima, J. Solid State Chem. 110, 201 (1994).
- [39] C. Pecharromn, M. Ocaa, and C. J. Serna, J. Appl. Phys. 80, 3479 (1996).
- [40] All three ZrO2 phases are non-piezoelectric, so the fixed-strain and free-stress dielectric tensors are identical for these systems.
- [41] G.-M. Rignanese, X. Gonze, and A. Pasquarello, Phys. Rev. B 63, 104305 (2001).
- [42] E. Cockayne and B. P. Burton, Phys. Rev. B 62, 3735 (2000).