Unexpected Metallic-like Behavior of the Resistance in the Dielectric Spin Density Wave State in (TMTSF)2PF6
Abstract
We report unexpected features of the transport in the dielectric spin density wave (SDW) phase of the quasi one-dimensional compound (TMTSF)2PF6: the resistance exhibits a maximum and a subsequent strong drop as temperature decreases below K. The maximum in is not caused by depinning or Joule heating of the SDW. The characteristic temperature of the maximum and the scaling behavior of the resistance at different magnetic fields evidence that the non-monotonic dependence has an origin different from the one known for the quantum Hall effect region of the phase diagram. We also found that the borderline which divides the field induced SDW region of the phase diagram into the hysteresis and non-hysteresis domains, terminates in the sub-phase; the borderline has thus no extension to the SDW phase.
The quasi-one-dimensional organic compound (TMTSF)2PF6 undergoes a phase transition from metallic to spin-density wave (SDW) state as temperature decreases below K (at ambient pressure) [1, 2, 3, 4]. As pressure increases, decreases and vanishes at kbar [1, 2, 3, 4]. Application of the magnetic field along the least conducting direction (crystal axis ), restores the dielectric state; this takes place via a cascade of the field induced spin density wave states (FISDW) accompanied by the sequence of the quantum Hall effect (QHE) states with various numbers of filled Landau bands [5, 6, 7]. A typical phase diagram of the FISDW states for kbar is illustrated in the inset to Fig. 1.
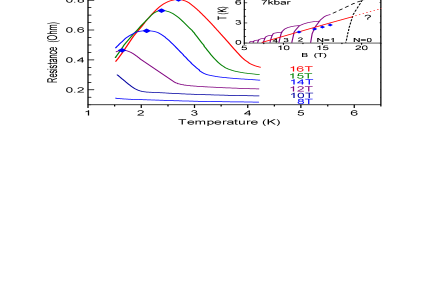
Earlier [8], we found that there is another boundary, which subdivides the area of the existence of the FISDW states (at ) into the low temperature- and the high-temperature domains (see the inset to Fig. 1). In the former domain, the transitions between different FISDW states () take place as the first order phase transitions which manifest experimentally in hysteretic variations of observable physical parameters as magnetic field drives the system through the transitions. In the latter domain, the transitions between different phases are not accompanied with a hysteresis and are not therefore of the first order. The above picture is consistent with a novel theoretical model suggested by Lebed [9] in which the low-temperature and the high-temperature domains have a meaning of the quantum and semiclassical regions, correspondingly. In this novel model, the nesting vector is predicted to be partially quantized in the quantum domain and is not quantized in the semiclassical domain.
We also reported in Ref. [8] that a qualitative difference between the two domains exists not only at the boundaries between the FISDW states, but through the overall area of the FISDW phase. We found that the temperature dependence of the resistance measured along the most conducting direction (i.e. the crystal axis ) has a maximum in the vicinity of the same - line (see Fig. 1); this coincidence was observed for different pressure values from 7 to 14 kbar.
The maxima in were observed earlier [10] in the phases and have been associated with the onset of the quantum Hall effect [10, 11, 12]. Indeed, as decreases, the Hall component of the conductivity grows to the quantized value, . As a result of the interplay between the diagonal and off-diagonal components of conductivity, exhibits a maximum, as follows from the equation:
| (1) |
Within such an explanation (see e.g. Refs. [10, 11] and references therein), the -maxima are associated with the QHE and do exists in all phases with ; obviously, such maxima should be missing in the dielectric SDW phase with . On the other hand, these maxima in follow a borderline which has a fundamental meaning [9]. The aim of the current studies is (i) to test whether the above explanation holds and becomes monotonic in the dielectric phase and (ii) to verify whether or not the quantum/semiclassical borderline extends to the dielectric phase as illustrated by the question mark in the inset to Fig. 1.
We found an unexpected behavior of the resistance in the phase: as temperature decreases, the resistance does not increase monotonically as anticipated for the insulating SDW state but exhibits a maximum and further falls down by a factor of . We found that the coordinates of the maximum in the phase do not fall onto the borderline extrapolated from the QHE region () to the phase. For example, extrapolated to the same and values, is typically a factor of 2 lower than . We compared the temperature dependences of the resistance for and for the QHE regime at in the vicinity of the -maxima. The scaling analysis of the two quantities showed that the two effects of maxima in have different critical exponents and thus the features of the resistance in the and phases have different origin. Our results thus demonstrate that the boundary plotted through the high order FISDW phases has no extension in the lowest order phase; this is consistent with the current theoretical interpretation [11]. On the other hand, the unexpected maximum in the purely insulating phase has no explanation in the frameworks of the current theories.
Measurements were carried out on two samples (of a typical size mm3) grown from a solution by a conventional electrochemical technique. We used either four Ohmic contacts formed at the plane or eight contacts at two planes; in all cases m Pt-wires were attached by a graphite paint to the sample along the most conducting direction . The sample and a manganin pressure gauge were inserted into a Teflon cylinder placed inside a nonmagnetic 18 mm o.d. pressure cell [13] filled with Si-organic pressure transmitting liquid. The cell was mounted inside the liquid He4, or He3/He4 mixing chamber, in a bore of a superconducting magnet. For all measurements, the magnetic field was applied along . Sample resistance was measured by four probe ac technique at 132 Hz, with a typical current A. The out-of phase component of the measured voltage was negligibly small, indicating Ohmic contacts to the sample. The temperature was determined by RuO2 resistance thermometer. The temperature was varied slowly, at a rate K/min in order to avoid deterioration in sample quality. The changes in the sample resistance were fully reproducible during the measurements including temperature sweeps; this indicated that the sample quality did not change. Measurements were done in magnetic fields up to 17.5 T and for temperatures down to K.
According to the existing theory [14, 15, 16, 17] and the known phase diagram [18, 4], the insulating phase can be realized in 2 ways: either at high pressures/high fields kbar, T (as shown in the inset to Fig. 1), or at low pressures/low fields kbar (as shown in the inset to Fig. 2). In the latter case, the magnetic field can be much lower; it should only be bigger than T to quench the superconducting state. In the current studies we focused on the low pressure/low field region in order to avoid possible influence of the magnetic breakdown in strong fields on the behavior. Figure 2 demonstrates that the sample resistance varies in accordance with the phase diagram: as temperature decreases, first decreases through the metallic phase, then changes sign at the transition point to the insulating SDW phase and grows by a factor of 40, and, eventually, falls to zero as superconducting state sets in. The two squares at the curve in Fig. 2 mark the two corresponding transitions.

Figure 3 shows the temperature dependence of the resistance in different fields, measured at pressure 5.4 kbar. Starting from high temperatures, shows a typical metallic behavior. At temperature , the SDW state (with ) sets in and the sample resistance starts growing. Unexpectedly, in this purely insulating state, exhibits a maximum at a certain temperature K and falls down by a factor of 2. Similar behavior of was observed also at and 5.5 kbar (the results for kbar are shown in the inset to Fig. 3).
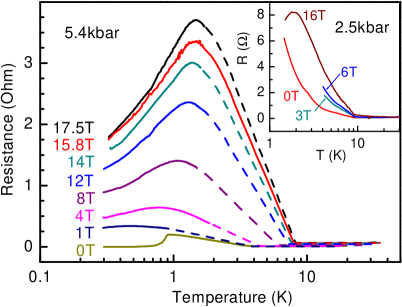
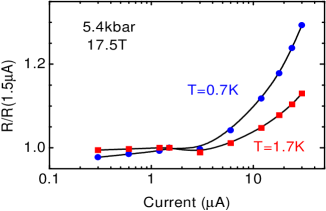
The maximum in is seen for any magnetic field; the temperature of the maximum increases with field. In order to verify that the maxima are not related to depinning or Joule heating, we measured the curves in the vicinity of the . Figure 4 shows that the differential resistance, , on both sides of the maximum, is independent of current up to nearly 4 A; this result demonstrates that the maxima measured at A are not related to the non-ohmic behavior. As current increases further, increases both, at and . This high-current nonlinearity is therefore likely to be caused by depinning rather than overheating. The former mechanism should increase the resistance [12], whereas the latter one should cause to decrease with current for K, and to increase for K (see Fig. 3).
The maxima seem at first sight similar to the ones which are typical in the FISDW regime at (shown in Fig. 1). However, the temperatures of the -maximum, , in the insulating phase is less than that in the neighboring phase by a factor of . This substantial difference can not be due to the minor difference in pressure (7 kbar vs 5.4 kbar) because is only weakly pressure dependent [19]. It follows therefore that the measured values in the phase do not belong to the borderline linearly extrapolated to the phase (dashed line in the inset to Fig. 1). Since we did not observe other -maxima (i.e., at ) in the phase, we conclude that the semiclassical/quantum borderline, , existing throughout the FISDW-phases does not extend to the insulating phase.
The fundamentally different origin of the -maxima in the FISDW and SDW phases is demonstrated by the following scaling analysis of the corresponding data. In this procedure, we normalized the resistance (for all curves taken at different magnetic fields) by its maximum value and replaced the temperature for each curve by the reduced temperature . Figures 5 a and b show the result of such simple scaling for and (i.e. for the SDW and FISDW regimes, correspondingly).
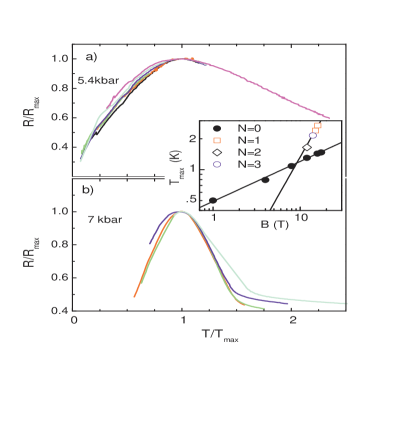
All the data (taken for different magnetic fields) collapse onto two different universal dependences . For , all curves, measured at magnetic fields from 1 to 17.5 T scale excellently thus demonstrating a similar origin. For (Fig. 5b), the scaling is also good though there is a minor systematic departure of the individual curves from the scaling curve, which increases with . We emphasize that the two universal scaling curves in Figs. 5 a and b are clearly different; the two scaling exponents are also different, and 0.4, correspondingly (see the inset to Fig. 5). This difference demonstrates that the -maxima in the SDW phase and in the FISDW regime have different underlying mechanisms.
The borderline determined empirically in Ref. [8], separates the regions of the existence and the absence of the first order phase transitions. It was also found that , for different fields and pressures exhibits a maximum at nearly the same border. On the other hand, according to the theory [10, 11] the maxima of in the FISDW regime are caused by the developing QHE. Our finding that the borderline has no extension to the phase is therefore in a good agreement with the above interpretation, because there is no QHE in the phase. Our data thus indicates that the QHE develops only in the ‘quantum’ (hysteretic) domain. This conclusion suggests the absence of the QHE in the high- phases where vanishes to zero (e.g., for at kbar, as shown in the inset to Fig. 1).
In the purely insulating phase, the QHE is missing and the appearance of the -maxima can not be explained by growth of the off-diagonal conductivity. Therefore, the origin of the maxima and of the strong drop in resistance towards low temperatures is puzzling. We wish to note an interesting coincidence. The temperature of the maxima in the phase is K in strong magnetic fields ( T). On the other hand, the magnetoresistance in the phase exhibits ‘rapid oscillations’ [20] whose amplitude vanishes as decreases below approximately the same temperature, K. A symmetry-group analysis [21] shows that in (TMTSF)2X compounds there exist two incommensurate spin density waves. Although the second SDW has smaller magnitude, it causes ‘rapid oscillations’ and may preserve semimetallic properties as . It is noteworthy, that a low-temperature region of the SDW phase diagram of (TMTSF)2PF6 was shown to have a non-trivial origin [22, 23] and was suggested to have an inner structure. We can not exclude therefore that the observed by us metallic-like behaviour of resistivity in the phase is somewhat related to inner subphases of the SDW phase.
To summarize, we studied temperature and magnetic field dependence of the resistance of the quasi-one dimensional compound (TMTSF)2PF6 both in the QHE () and SDW () phases. We found that the borderline which divides the FISDW region of the phase diagram into the hysteresis and non-hysteresis domains terminates in the sub-phase; the border has no extension to the SDW phase. The maxima of in the FISDW region (which have been shown to occur approximately at the same borderline) develop only in the phase; their existence thus correlates with the existence of the QHE. This co-occurrence agrees with the current theoretical explanation of the -maxima in the phases. We found that in the SDW phase which is considered to be insulating, the resistance does not grow infinitely as temperature decreases but exhibits a maximum at K and falls to lower temperatures. The -maxima in the ‘insulating phase’ take place in the linear conductance regime and are not caused by depinning or Joule heating. We found that the temperature of the -maxima, , in the SDW phase is not a continuation of the border line which separates the hysteretic and non-hysteretic domains in the regime. A scaling analysis of the resistance has shown that the maxima in the and phases have different origin. The unexpected strong drop of the resistance in the SDW phase at K has no explanation within frameworks of the existing theories.
The work was partially supported by INTAS, RFBR, NATO, NSF, NWO, Russian Programs ‘Statistical physics’, ‘Integration’, ‘The State support of the leading scientific schools’, and COE Research in Grant-in-Aid for Scientific Research, Japan.
REFERENCES
- [1] L. P. Gor’kov and A. G. Lebed, J. Phys. (Paris) Lett. 45, L-433 (1984).
- [2] L. P. Gor’kov Sov. Phys. Usp. 27, 809 (1984).
- [3] T. Ishiguro, K. Yamaji and G. Saito, Organic Superconductors (2nd Edition, Springer-Verlag, Heidelberg, 1998).
- [4] P. M. Chaikin J. Phys I France 6, 1875 (1996).
- [5] K. Maki, Phys. Rev. B 33, 4826 (1986). A. Virosztek, L. Chen, and K. Maki, Phys. Rev. B 34, 3371 (1986).
- [6] S. T. Hannahs, J. S. Brooks, W. Kang, L. Y. Chiang and P. M. Chaikin Phys. Rev. Lett. 63, 1988 (1989)
- [7] J. R. Cooper, W. Kang, P. Auban, G. Montambaux and D. Jérome Phys. Rev. Lett. 63, 1984 (1989).
- [8] A. V. Kornilov, V. M. Pudalov, Y. Kitaoka, K. Ishida, T. Mito, J. S. Brooks, J. S. Qualls, J. A. A. J. Perenboom, N. Tateiwa, T. C. Kobayashi, cond-mat/0103088.
- [9] A. G. Lebed, JETP Lett. 72, 141 (2000).
- [10] W. Kang, S. T. Hannahs, L. Y. Chiang, R. Upasani, P. M. Chaikin, Phys. Rev. B 45, 13566 (1992).
- [11] V. M. Yakovenko, H.-S. Goan, Phys. Rev. B 58, 10648 (1998).
- [12] T. Vuletić C. Pasquier, P. Auban-Senzier, S. Tomić, D. Jérome, K. Maki, and K. Bechgaard, Eur. Phys. J. B 21, 53 (2001).
- [13] A. V. Kornilov, V. A. Sukhoparov, V. M. Pudalov, High Pressure Science and Technology, ed. W. Trzeciakowski, World Scientific, Singapore, 63 (1996).
- [14] M. Heritier, G. Montambaux and P. Lederer, J. Phys. (Paris) Lett. 45, L-943 (1984).
- [15] A. G. Lebed, Sov. Phys.: JETP, 62, 595 (1985).
- [16] K. Maki, Phys. Rev. B 33, 4826 (1986).
- [17] K. Yamaji, Synth. Met. 13, 29 (1986).
- [18] W. Kang, S. T. Hannahs, P. M. Chaikin, Phys. Rev. Lett. 70, 3091 (1993).
- [19] Figure 3 shows that the -values measured at and 5.4 kbar differ from each other less than by 20%.
- [20] J. P. Ulmet, L. Bachere, and S. Askenazy, Sol. St. Commun. 58, 753 (1986). S. Uji, J. S. Brooks, M. Chaparala, S. Takasaki, J. Yamada, and H. Anzai, Phys. Rev. B 55, 12446 (1997).
- [21] A. G. Lebed, Physica Scripta, 39, 386 (1991).
- [22] T. Takahashi, T. Harada, Y. Kobajashi, K. Kanoda, K. Suzuki, K. Murata, and G. Saito, Synth. Met., 41-43, 3985 (1991).
- [23] J. C. Lasjaunias, K. Biljaković, F. Nad’, P. Monceau, K. Bechgaard, Phys. Rev. Lett. 72, 1283 (1994).