[
Electronic structure of the trilayer cuprate superconductor Bi2Sr2Ca2Cu3O10+δ
Abstract
The low-energy electronic structure of the trilayer cuprate superconductor Bi2Sr2Ca2Cu3O10+δ near optimal doping is investigated by angle-resolved photoemission spectroscopy. The normal state quasiparticle dispersion and Fermi surface, and the superconducting -wave gap and coherence peak are observed and compared with those of single and bilayer systems. We find that both the superconducting gap magnitude and the relative coherence-peak intensity scale linearly with for various optimally doped materials. This suggests that the higher of the trilayer system should be attributed to parameters that simultaneously enhance phase stiffness and pairing strength.
pacs:
PACS numbers: 71.18.+y, 74.72.Hs, 79.60.Bm]
The high- cuprate superconductors (HTSCs), based on the number of CuO2 planes in the characteristic multilayer blocks, can be classified into single-layer materials [e.g., Bi2Sr2CuO6+δ (Bi2201), HgBa2CuO4+δ (Hg1201), and La2-xSrxCuO4 (LSCO)], bilayer materials [e.g., Bi2Sr2CaCu2O8+δ (Bi2212), HgBa2CaCu2O6+δ (Hg1212) and YBa2Cu3O7-δ (Y123)], trilayer materials [e.g., Bi2Sr2Ca2Cu3O10+δ (Bi2223), and HgBa2Ca2Cu3O8+δ (Hg1223)], and so on. This structural characteristic has a direct correlation with the superconducting properties: within each family of cuprates, the superconducting phase transition temperature () increases with the layer number () for , and then starts to decrease[1, 2]. Taking the Bi-family of HTSCs as an example, the maximum is approximately 34, 90, and 110 K for optimally doped Bi2201 (), Bi2212 (), and Bi2223 (), respectively. Despite various experimental and theoretical efforts, a conclusive microscopic understanding of this evolution has not yet been reached, partly because of the lack of detailed knowledge about the electronic structure of the trilayer systems. In particular, angle-resolved photoemission spectroscopy (ARPES), one of the most direct probe of the electronic structure of HTSCs [3], has so far been limited to single and bilayer compounds. To gain further insight into the role of multiple CuO2 planes in determining the macroscopic physical properties of the cuprates, like the value of the , it is crucial to extend the investigation of the electronic structure to trilayer HTSCs, and to compare the results with those from the single and bilayer materials. Given that the Bi-based cuprates represent the HTSC family best characterized by ARPES, the trilayer system Bi2223 is the ideal candidate for such a comparative study.
In this Letter, we report the first ARPES study, to the best of our knowledge, of the electronic structure of the trilayer HTSC Bi2223, for which high quality single crystals with dimensions suitable for ARPES measurements has been recently synthesized. As in the single- and bi-layer materials, at nearly optimally doped Bi2223, we observed a large hole-like Fermi surface, a flat quasiparticle band near , -wave pseudo and superconducting gaps, and a large superconducting peak (the so-called coherence peak in the case of Bi2212). The superconducting gap magnitude and the relative weight of the superconducting peak both increase linearly with for the optimally doped Bi-based HTSCs. This indicates that the higher of Bi2223 is caused by the enhancement of both pairing strength and phase stiffness, consistent with the idea that optimal doping corresponds to the intersection between phase-coherence and pairing-strength temperature scales.
Bi2223 single crystals were grown by floating-zone technique. Nearly optimally doped samples [ K, K] were obtained by subsequently annealing the slightly underdoped as-grown Bi2223 crystals ( K) for three days at 400 ∘C and atm, and then rapidly quenching them to room temperature. Magnetic susceptibility measurements did not detect the presence of second phases, and X-ray diffraction showed well ordered bulk structures, with the typical superstructure seen in Bi2201 and Bi2212. Optimally doped Bi2212 ( K) and Bi2201 ( K) with K were also studied for comparison. ARPES experiments were performed at the Stanford Synchrotron Radiation Laboratory (SSRL) on a beamline equipped with a Scienta SES200 electron analyzer. Multiple ARPES spectra were acquired simultaneously in a narrow window of with, unless otherwise specified, an angular resolution of (along the cut direction) and an energy resolution of 10 meV. The samples were aligned by Laue diffraction, and cleaved in-situ under a pressure better than torr. Bi2223 samples #1, #3 (#2, #4) were cleaved at K ( K). Data were collected within 12 hours after cleaving and aging effects were negligible.
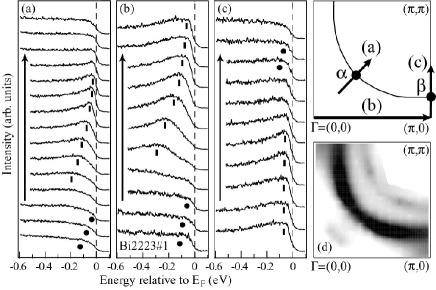
Fig. 1 presents the normal state ARPES spectra measured on Bi2223 along the high symmetry directions of the first Brillouin zone (BZ). Similar to what has been observed on optimally doped Bi2201 and Bi2212[3], the quasiparticle band is rather flat near (,0) while it is quite dispersive and defines a clear Fermi crossing along the (0,0)-(,) direction. The umklapp bands, one of the characteristics of the Bi-family of cuprates, are also detected. The Fermi surface (FS) can be identified by the local maxima of the intensity map obtained by integrating the ARPES spectra within a narrow energy window at the Fermi energy (), after the spectra were normalized with respect to the high energy spectral weight. As in the case of Bi2201 and Bi2212[3], one main and two weak umklapp FSs, shifted by with respect to the main FS, are clearly observed (Fig. 1d).
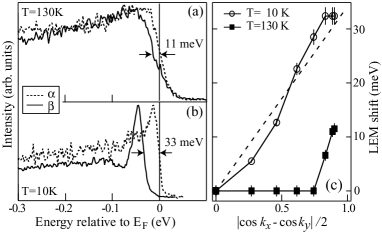
By tracking the energy position of the leading-edge midpoint (LEM) as a function of temperature and momentum, one can identify an anisotropic pseudogap and a superconducting gap () consistent with a -wave symmetry. Figs. 2a and 2b show that at , where the FS crossing along the nodal region is found (see the BZ sketch in Fig. 1), the LEMs of both normal and superconducting state spectra are located at , indicating the absence of any gap. On the other hand, in the antinodal region (i.e., at ) the LEM is always shifted below , corresponding to an 11 meV pseudogap above and a 33 meV superconducting gap below . The momentum dependence of both normal and superconducting state gaps along the normal state FS is summarized in Fig. 2c. The superconducting gap can be fitted to the -wave functional form (where is the superconducting gap amplitude), while the pseudogap vanishes in wide momentum-space regions resulting in a partially gapped FS (or, equivalently, four disconnected FS arcs in the BZ) at 130 K. Similar phenomena have also been observed in Bi2212 [4]. Furthermore, for the Bi2223 samples #2-4 the pseudogap at was found to vary from 6 to 9 meV at 125 K (which is possibly caused by some small variations in carrier dopings), and the sample with larger pseudogap also has a larger superconducting gap.
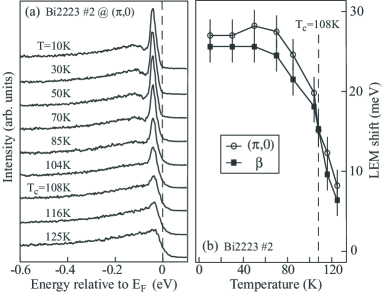
Again in analogy with the case of Bi2212[5], in Fig. 2 one also notices that the normal state spectrum at sharpens up upon entering the superconducting state, but the most dramatic change in the lineshape takes place at , where the spectrum evolves into a peak-dip-hump structure below . This so-called superconducting peak, which dominates the spectral function in the (,0) region, has been argued to be an important characteristics of the HTSCs[6]. It has so far been detected by ARPES only on Bi2212[7] and Y123[8], and the present results substantiate its existence in the spectral function of an system. In order to gain more information, detailed temperature dependence measurements were performed at , and the results are presented in Fig. 3a. The superconducting peak emerges slightly above (i.e., at 116 K). Upon further cooling the sample below , its intensity increases rapidly before it eventually saturates at low temperatures, while the total spectral weight is conserved (within 1-2%). At the same time, the LEM shifts to high binding energies reflecting the opening of the superconducting gap (Fig. 3b). Note also that, due to the weak quasiparticle dispersion in the flat band region, the spectra at and exhibit a very similar behavior, as emphasized by Fig. 3b.
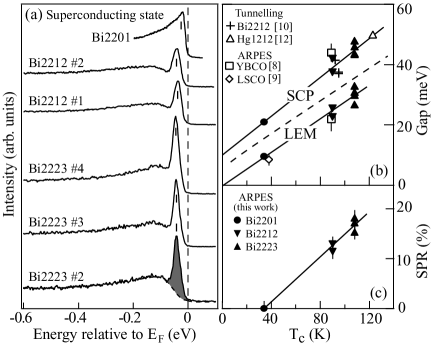
So far, we have shown that various properties of Bi2223 qualitatively resemble those of Bi2212 and/or Bi2201. The natural question is: what part of the electronic structure of Bi2223 can account for the highest among the Bi-family of cuprates? To further investigate this issue, we compare in Fig. 4a the superconducting state spectra from optimally doped Bi2201 and Bi2212, and nearly optimally doped Bi2223 taken under the same experimental conditions (except for the higher energy resolution, i.e. 6meV, used for the Bi2201 data). The superconducting gap magnitude can be estimated by either the position of the superconducting peak or the LEM shift below in the (,0) spectra. We found that the average LEM (peak position) gap values are 10 (21), 24 (40), 30 (45) meV for the systems, respectively. As shown in Fig. 4b, the gap value of the three different systems scales linearly with the corresponding . In particular, the LEM gap can be well fitted by a line across the origin corresponding to an -independent ratio . Furthermore, from ARPES and tunnelling spectroscopy results reported for other families of cuprates it is found that the values of for optimally doped LSCO[9], Bi2212[10], YBCO[8, 11], and Hg1212[12] follow the same gap versus linear relation (see Fig. 4b).
From the data presented in Fig. 4a, one can also extract the so-called superconducting peak ratio (SPR), which is defined as the ratio between the integrated spectral weight of the superconducting peak and that of the whole spectrum (i.e., from 0.5 to +0.1 eV). As shown in Fig. 4a, for the Bi2223 sample #2, the peak intensity is obtained by fitting the smooth “background” with a phenomenological function and then subtracting its contribution to the total integrated weight, as discussed in detail elsewhere[13]. For Bi2201, the superconducting peak is not resolved in the ARPES data and therefore its SPR is estimated to be close to zero. In recent scanning tunnelling spectroscopy (STS) experiments a superconducting peak in the density of state was observed for Bi2201. This, however, was detected only at certain locations on the cleaved sample surface and was not resolved in the spatially averaged STS spectra[14], consistent with what is observed by ARPES. For Bi2212 and Bi2223, the spectra in Fig. 4a (normalized at high binding energy to allow a direct comparison) indicate that the superconducting peak amplitude for Bi2223 is much larger than that of Bi2212. Overall, the SPRs of these systems scale linearly with (Fig. 4c)[15]. For Bi2212, it has been argued that the SPR is related to the phase stiffness of the condensate or superfluid density ()[13, 16]. The weak superconducting peak in the (spatially averaged) ARPES spectra from Bi2201 may then reflect a low superfluid density, and in fact the peak amplitude is negligible also in Bi2212 samples with K[13]. The -dependence of the SPR is qualitatively consistent with the muon spin resonance (SR) results, which show that for the optimally doped cuprates increases with (for ), and scales with in approximately a linear fashion as in the celebrated “Uemura plot” [17]. Therefore, the ARPES results together with those from tunnelling and SR indicate that both and increase with for the different optimally doped cuprates.
Within current understanding, and are the two most important quantities in characterizing the superconducting state, as they reflect the strength of the two basic ingredients of superconductivity: pairing and phase coherence. , the temperature at which the Cooper pairs start to form, is determined by pairing strength (or ); , the temperature at which the Cooper pairs, if any, become phase coherent, is determined by the phase stiffness (or ). The superconducting phase transition temperature is given by [18]. For conventional superconductors, ; therefore, and phase fluctuations are not important in determining . The situation is different for the HTSCs: in order to have high , it is necessary to have both large and , as we have seen for nearly optimally doped Bi2223. The reason for this is that HTSCs are doped Mott insulators with low carrier density, for which and are comparable and proposed to have the doping dependence sketched in Fig. 5 [18, 19]. The crossing of ( being doping) and gives (with the subscript referring to optimal doping, which is found to be approximately fixed at for many HTSCs [20]). The approximate linear relations and observed for various optimally doped systems lead to and , as theoretically proposed[18].
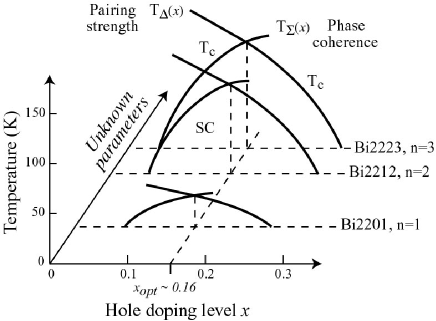
We have shown that many aspects of the electronic structure of Bi2223, such as the Fermi surface topology and flat band dispersion, resemble those of Bi2212 and Bi2201. A preliminary lineshape analysis[21] suggests that the interlayer coupling between CuO2 planes within a multilayer block is not stronger, but possibly even weaker in Bi2223 than in Bi2212, where bilayer band splitting, which causes multiple features or broader lineshapes in ARPES spectra, were recently observed[22]. This and the fact that in Hg1201 is comparable to that of Bi2212 indicate that the interlayer coupling within a multilayer block is not the dominant factor for the enhancement of . Moreover, does not scale with in a linear way within a specific HTSC family; and for a given , e.g. , varies from K to K for different families of cuprates. Instead, we have shown that scales approximately linearly with both and . One could speculate that the resolution of the vs. problem might be incorporated into a broader task, namely the search for the parameters that enhance both superconducting gap and superfluid density, and in turn the optimal . These parameters could be affected by and other conspiring factors, for which various candidates have already been proposed, including superconductivity enhancement in the non-CuO2 layers[23], or as a consequence of impurities and distortion/strain introduced into the system[24, 25]. To highlight these unknown parameters, we add a third axis to the phase diagram of the hole-doped HTSCs (Fig. 5), along which both pairing strength and phase stiffness (and thus ) increase with the same monotonic trend, contrary to their opposite trends along the doping axis. In this way, the Bi-based cuprates and possibly different families of HTSCs can be integrated into one comprehensive phase diagram.
Acknowledgements: DLF and ZXS would like to thank S. Maekawa and T. H. Geballe for helpful discussions. SSRL is operated by the DOE Office of Basic Energy Science Divisions of Chemical Sciences and Material Sciences. The Stanford experiments are also supported by the NSF grant DMR0071897 and ONR grant N00014-98-1-0195-A00002. The crystal growth work at Stanford was supported by DOE under Contract Nos. DE-FG03-99ER45773-A001 and DE-AC03-76SF00515. MG is also supported by the A. P. Sloan Foundation and NSF CAREER Award No. DMR-9985067.
REFERENCES
- [1] M. Di Stasio, K.A. Muller, and L. Pietronero, Phys. Rev. Lett. 64, 2827 (1990), and references therein.
- [2] J.M. Tarascon et al., Phys. Rev. B 38, 8885 (1992).
- [3] Z.-X. Shen and D.S. Dessau, Phys. Rep. 253, 1 (1995); A. Damascelli, D.H. Lu, and Z.-X. Shen, J. Electron Spectr. Relat. Phenom. 117-118, 165 (2001); D.W. Lynch and C.G. Olson, Photoemission Studies of High-Temperature Superconductors (Cambridge University Press, 1999).
- [4] D.S. Marshall et al., Phys. Rev. Lett. 76, 4841 (1996); M. Norman et al., Nature 392, 157 (1998).
- [5] A. Kaminski et al., Phys. Rev. Lett. 84, 1788 (2000).
- [6] See for example D.-H. Lee, Phys. Rev. Lett. 84, 2694 (2000); T. Senthil and M.P.A. Fisher cond-mat/9910224; E.W. Carlson et al., Phys. Rev. B 62, 3422 (2000).
- [7] D.S. Dessau et al., Phys. Rev. Lett. 66, 2160 (1991).
- [8] D.H. Lu et al., Phys. Rev. Lett. 86, 4370 (2001).
- [9] X.J. Zhou et al., unpublished.
- [10] Ch. Renner et al., Phys. Rev. Lett. 80, 149 (1998); Y. De Wilde et al., ibid. 153 (1998); N. Miyakawa et al., ibid. 157 (1998).
- [11] For YBCO, because of the additional gap anisotropy due to the presence of the CuO chains[8], the maximum gap amplitude (i.e., at the point) is plotted in Fig.4b.
- [12] J.Y.T. Wei et al., Phys. Rev. B 57, 3650 (1998).
- [13] D.L. Feng et al., Science 289, 277 (2000).
- [14] M. Kugler et al., Phys. Rev. Lett. 86, 4911 (2001).
- [15] We note that Bi2223 and Bi2212 have different structures and thus possibly different photoemission matrix elements. However, the large enhancement of the superconducting peak in Bi2223 and the qualitative aspect of Fig. 4c are not likely just matrix element artifacts.
- [16] H. Ding et al., cond-mat/0006143.
- [17] Y.J. Uemura et al., Nature 364, 605 (1993), and references therein.
- [18] V.J. Emery and S. Kivelson, Nature 374, 434 (1995).
- [19] Y.J. Uemura, Physica C 282-287, 194 (1997), which also shows that (and thus ) eventually decreases in the overdoped regime. It is omitted here for simplicity, and will not affect the qualitative conclusions drawn here.
- [20] M.R. Presland et al., Physica C 176, 95 (1991); J. Tallon et al., Phys. Rev. B 51, 12911 (1995); S. Ono et al., Phys. Rev. Lett. 85, 638 (2000).
- [21] D.L. Feng, Ph.D. thesis, Stanford University, 2001.
- [22] D.L. Feng et al., Phys. Rev. Lett. 86, 5550 (2001); ibid., cond-mat/0107073; Y.-D. Chuang et al., cond-mat/0102386; ibid., 0107002.
- [23] T.H. Geballe and B.Y. Moyzhes, Physica C 341-348, 1821 (2000).
- [24] H. Eisaki et al., unpublished.
- [25] A. Bianconi et al., Int. J. Mod. Phys. B 14, 3342 (2000).