Bond-Stretching-Phonon Anomalies in Stripe-Ordered La1.69Sr0.31NiO4
Abstract
We report a neutron scattering study of bond-stretching phonons in La1.69Sr0.31NiO4, a doped antiferromagnet in which the added holes order in diagonal stripes at 45∘ to the Ni-O bonds. For the highest-energy longitudinal optical mode along the bonds, a softening of 20% is observed between the Brillouin zone center and zone boundary. At 45∘ to the bonds, a splitting of the same magnitude is found across much of the zone. Surprisingly, the charge-ordering wave vector plays no apparent role in the anomalous dispersions. The implications for related anomalies in the cuprates are discussed.
pacs:
PACS: 63.20.Kr, 71.27.+a, 71.45.Lr, 61.12.-qThere is resurgent interest in the role of phonons with respect to the high-temperature superconductivity found in layered copper-oxides Zhao et al. (1997). Particularly striking are the anomalies in high-energy optical modes observed by neutron scattering in La2-xSrxCuO4 Pintschovius and Reichardt (1998); Pintschovius and Braden (1999); McQueeney et al. (1999a) and YBa2Cu3O6+x Pintschovius and Reichardt (1998); Reichardt (1996); Petrov et al. ; McQueeney et al. . There have been various speculations as to whether the observed phonon anomalies might be related to instantaneous charge inhomogeneities, particularly those in the form of stripes Emery et al. (1999). Recently, detailed analyses of electron-phonon interactions in a dimerized stripe phase have been reported Castro Neto (2001); Park and Sachdev (2001).
One way to learn about the effect of charge stripes on lattice dynamics is to study a model system with well-defined stripe order. Here we present the first single-crystal study, to our knowledge, of the bond-stretching phonon modes in such a system, specifically La2-xSrxNiO4 with . The stripe order in Sr-doped nickelates has been characterized in detail by neutron diffraction, and the most recent summary of results is given in Yoshizawa et al. (2000). For , the crystal structure is tetragonal, consisting of a body-centered stacking of NiO2 planes. Within the NiO2 planes, the charge stripes run diagonally along either [110] or directions, at 45∘ to the Ni-O nearest-neighbor bonds, which extend along [100] and [010] directions. (In contrast, the charge stripes observed in superconducting La1.6-xNd0.4SrxCuO4 run parallel to the Cu-O bonds Ichikawa et al. (2000); however, for , the stripes inferred to exist in La2-xSrxCuO4 have the diagonal orientation of the nickelates Wakimoto et al. (1999); Fujita et al. .) The maximum transition temperatures for charge-stripe and magnetic order occur at Yoshizawa et al. (2000); Cheong et al. (1994). Well below the charge-ordering temperature, , the nickelates have very large resistivities Katsufuji et al. (1996, 1999), consistent with all of the added holes being localized in charge stripes.
We focus on the highest-energy longitudinal optical modes propagating along the [100] and [110] directions. These modes show only weak dispersion in stoichiometric La2NiO4 Pintschovius et al. . In contrast, we observe a softening of 20% along [100] on moving from the Brillouin zone center to the zone boundary, quite similar to that found in La2-xSrxCuO4 Pintschovius and Braden (1999); McQueeney et al. (1999a); along [110], a splitting of the same magnitude is observed over much of the zone and, in particular, at the zone boundary. These results are important for two reasons. 1) The observed anomalies must be associated with the local charge inhomogeneity. They are induced by the hole doping, and the holes are localized in the stripes. 2) There is no evidence that the charge-ordering wave vector, , plays a special role. If the phonon anomalies were related to collective phase fluctuations of the charge stripes, as in a conventional charge-density-wave system Schulz (1978), then one might expect them to appear at . With the absence of a collective signature, it seems likely that the dominant effects involve local interactions between charge and lattice fluctuations.
Our La2-xSrxNiO4 crystal, grown by the floating-zone method, is cylindrical, with a diameter of 6 mm and length of 30 mm; the Sr concentration of was confirmed by inductively-coupled plasma analysis (with an uncertainty of ). At room temperature, the lattice parameters of the tetragonal unit cell are Å and Å. The charge and spin ordering transitions were confirmed to be consistent with previous workYoshizawa et al. (2000) (magnetic and charge-order transitions of approximately 160 K and 235 K, respectively) by neutron diffraction measurements performed at the JRR-3M reactor in Tokai, Japan. The inelastic-neutron-scattering measurements of phonons were performed on the 1T triple-axis spectrometer at the Orpheé reactor of the Laboratoire Léon Brillouin in Saclay, France. The spectrometer is equipped with a Cu (111) monochromator and a pyrolytic graphite (PG) (002) analyzer, each of which is both vertically and horizontally focused. The analyzer was set to detect neutrons with a final frequency of 3.55 THz (14.7 meV). A PG filter was placed after the sample to minimize unwanted neutrons at harmonic wavelengths.
Figure 1(a) shows scans of scattered intensity versus excitation frequency for phonons propagating in the [100] direction, parallel to the in-plane Ni-O bonds. The scans are taken at wave vectors along the line in the first Brillouin zone, moving from the zone center (, bottom) to the zone boundary (, top), where the components of the wave vector are measured in reciprocal lattice units, . (The effective zone boundary for a single NiO2 plane is at ; the fact that the actual boundary is at results from the body-centered stacking of the layers.) Each scan is dominated by a single, well-defined peak, that disperses from approximately 21 THz at zone center to less than 18 THz half-way across the zone, and then back up again. The lines through the data points are fitted gaussian peaks on top of a background that is taken to be independent of wave vector and frequency.
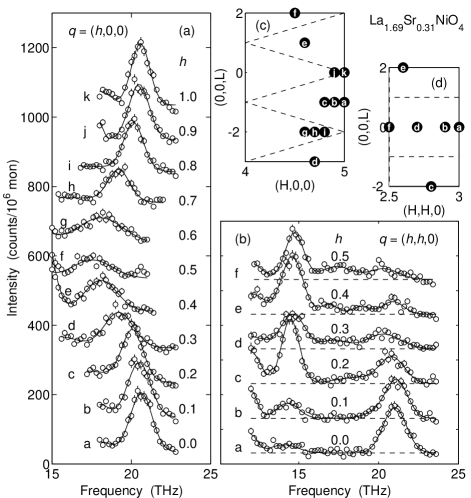
Figure 1(b) shows scans measured along the [110] direction. Because of twinning of the stripe domains, we simultaneously probe phonons propagating parallel and perpendicular to the stripes. Again, we focus on the mode that starts at about 21 THz at zone center; the mode at 14 THz involves bond-bending motion, and does not exhibit any notable doping-dependent behavior. [The intensity variation seen in the figure for this mode is associated with its sensitivity to the -component of the wave vector Q, which varies from point to point as noted in Fig. 1(d).] On moving from zone center to zone boundary, we note that the highest-frequency mode varies little in frequency, but it loses intensity. Concommitant with this, signal appears in the 17–18 THz regime, growing in strength as the zone boundary is approached.
Using the gaussian fits as a smoothed version of the data, we present our results as intensity plots in Fig. 2(a) and (b). Here, the intensity has been multiplied by ( is the component of Q along the phonon propagation direction) to correct for sensitivities of the neutron-scattering cross section. Dramatic differences are observed in the dispersions of the stripe-ordered system compared to those in stoichiometric La2NiO4, which are indicated by the gray circles Pintschovius et al. . Contrary to naive expectations based on the Peierls-distortion model Schulz (1978), there is no particular anomaly at the charge-ordering wave vector [see Fig. 2(b)]. Instead, we find a splitting of the mode along [110] over a substantial part of the zone. The size of the dispersion in the [100] direction is about the same as the [110] splitting, and is essentially identical to the magnitude of the dopant-induced softening reported for superconducting La1.85Sr0.15CuO4 Pintschovius and Braden (1999); McQueeney et al. (1999a). The softened modes are consistent with a previous study of the phonon density-of-states in La2-xSrxNiO4 McQueeney et al. (1999b), where a dopant-induced peak was observed at meV ( THz).
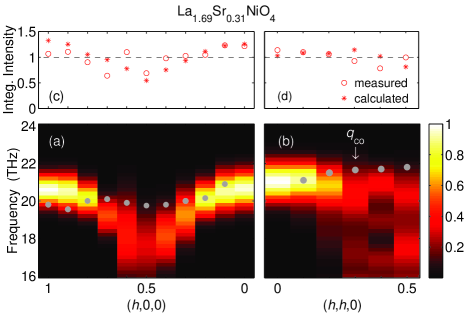
Integrating the corrected intensity data of Fig. 2(a) and (b) over frequency yields the open circles shown in Fig. 2(c) and (d), respectively. The experimental results are compared with intensities calculated from the interatomic-potential model used to describe the phonons in La1.9NiO3.93 Pintschovius et al. . (An overall normalization of the calculated to the measured intensities has been applied in each panel.) The general consistency between the measured and calculated integrated intensities suggests that the distribution of weight for the anomalously-softened bond-stretching modes does not extend significantly below 16 THz.
To interpret our results, let us consider some simple phenomenological models. The high-energy bond-stretching phonons involve the motion of the in-plane oxygens between the much heavier nickel atoms. Suppose we assume the nickel atoms to be infinitely heavy and consider only nearest-neighbor forces; then each oxygen acts like an Einstein oscillator, with no dispersion of its vibrational frequency. Correcting for the finite mass of the nickel would result in a slight decrease in frequency towards the zone boundary; however, accounting for Coulomb repulsion between neighboring oxygen ions would counter that with an increase in frequency at the zone boundary, where neighboring oxygens move opposite to one another. Ignoring these corrections, a simple Einstein model gives a rough approximation of the measured dispersions in stoichiometric La2NiO4 Pintschovius et al. [see Fig. 2(a) and (b)].
To go further, we will restrict ourselves to a linear Ni-O chain model. The softening of phonons at the zone boundary can be described by introducing a force between nearest-neighbor O ions with a negative force constant, Pintschovius et al. (1989, ) [see Fig. 3(a)]. This force phenomenologically incorporates a particular type of electron-phonon coupling. An example of the dispersion from such a model is shown in Fig. 3(c). The eigenvector for the softened zone-boundary mode, sketched in Fig. 3(e), involves linear breathing motion of the O about the Ni.
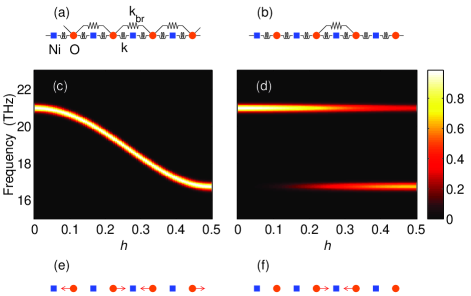
Next, suppose that acts only between one pair of oxygens out of three [see Fig. 3(b)]. The result is a splitting of the modes, as illustrated in Fig. 3(d). Note that the intensity of the softened mode is strong at the zone boundary, but goes to zero at zone center. This effect is achieved without a dimerization of the lattice. As shown in Fig. 3(f), the eigenvector of the softened mode at zone boundary involves an isolated, local breathing motion of a pair of O about a Ni site. The behavior of this mode does not require coherence between motions in different unit cells.
It seems likely that both of these models have some degree of relevance to our observations; however, it is difficult to associate them in a consistent or unique way with specific details of the measured dispersions. Of greater interest is the nature of the electron-phonon coupling modelled by . In model calculations for La2-xSrxCuO4, Falter and Hoffmann Falter and Hoffmann (2001) have emphasized the importance of ionic charge fluctuations in response to atomic displacements and the irrelevance of Fermi-surface nesting effects of the type once proposed by Weber Weber (1987). Given the experimental evidence for poor electronic screening of phonons in optimally-doped cuprates Homes et al. (2000), extended Coulomb interactions should also be important.
In the present case of the nickelate, little metallic screening is expected due to the gap of eV in the optical conductivity at low temperature Katsufuji et al. (1996); Pashkevich et al. (2000). The bond-stretching modes involve polar fluctuations of the negative oxygen ions against the positive nickel ions, and so should couple to charge fluctuations. The lowest-energy channel for charge fluctuations must involve the dopant-induced holes, and since the holes are segregated into stripes, charge fluctuations must be associated with some form of stripe fluctuations.
In a conventional charge-density-wave (CDW) system, one might expect the mode along [110] to couple to fluctuations of the phase of the CDW with respect to the lattice Schulz (1978). In the present case, the absence of a characteristic wave vector suggests that local charge fluctuations may be more relevant for the bond-stretching modes. Local fluctuations were predicted by Yi et al. Yi et al. (1998) in a random-phase-approximation treatment of Hartree-Fock stripes. Nevertheless, our results do not rule out the possibility of weak, low-energy, collective phase fluctuations of the stripes.
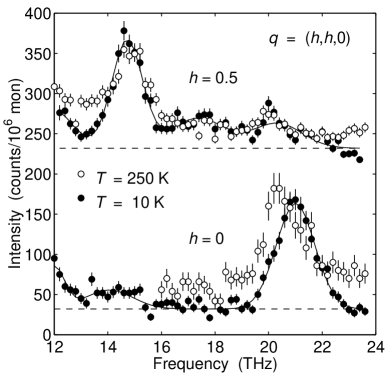
Do the effects we observe depend on static ordering of the stripes? Figure 4 shows a comparison of phonons at zone-center and zone boundary along [110] measured at 10 K and 250 K, which is above the charge-ordering temperature. One can see that at 250 K, the zone-center mode has softened slightly but remains strong and well-defined; however, at the zone boundary, the intensity remains spread out in frequency. Thus, the anomalies do not disappear with the static order.
Rather similar phonon softenings were observed in the sample identified as La1.9NiO3.93 Pintschovius et al. ; Pintschovius et al. (1989). Despite the specified stoichiometry, that sample exhibited superlattice peaks of the type with , , and odd, consistent with the stage-2 ordering of interstitials found in La2NiO4.105 Tranquada et al. (1994). The latter compound exhibits evidence of incipient stripe correlations, but no stripe order Tranquada et al. (1997). This is further evidence that local interactions are sufficient to yield the phonon anomalies.
To summarize, we have observed doping-induced anomalies in bond-stretching modes of La1.69Sr0.31NiO4, a compound in which the doped holes order in stripes at low temperature. The anomalies persist over a substantial portion of the Brillouin zone, with no obvious signature of collective stripe fluctuations. The splitting of the mode along [110] is similar to recent observations in superconducting Ba0.6K0.4BiO3 Braden et al. , where charge inhomogeneity is also expected to be relevant. These results provide support for a connection between the phonon anomalies observed in the cuprates and instantaneous charge inhomogeneity.
We gratefully acknowledge stimulating discussions with R. Werner and helpful comments from P. D. Johnson and S. A. Kivelson. This work was supported by the Materials Sciences Division, Office of Science, U.S. Department of Energy under Contract No. DE-AC02-98CH10886, and by the U.S.-Japan Cooperative Research Program on Neutron Scattering. JMT and KN wish to thank the staff of the Laboratoire Léon Brillouin for their hospitality during the experiments.
References
- Zhao et al. (1997) G.-M. Zhao, M. B. Hunt, H. Keller, and K. A. Müller, Nature 385, 236 (1997); H. A. Mook and F. Doğan, Nature 401, 145 (1999); A. Bussmann-Holder et al., J. Phys.: Condens. Matter 13, L169 (2001); T. Schneider and H. Keller, Phys. Rev. Lett. 86, 4899 (2001); A. Lanzara et al., Nature 412, 510 (2001).
- Pintschovius and Reichardt (1998) L. Pintschovius and W. Reichardt, in Neutron Scattering in Layered Copper-Oxide Superconductors, edited by A. Furrer (Kluwer, Dordrecht, The Netherlands, 1998), p. 165.
- Pintschovius and Braden (1999) L. Pintschovius and M. Braden, Phys. Rev. B 60, R15039 (1999).
- McQueeney et al. (1999a) R. J. McQueeney et al., Phys. Rev. Lett. 82, 628 (1999a).
- Reichardt (1996) W. Reichardt, J. Low Temp. Physics 105, 807 (1996).
- (6) Y. Petrov et al., eprint cond-mat/0003414.
- (7) R. J. McQueeney et al., eprint cond-mat/0105593.
- Emery et al. (1999) V. J. Emery, S. A. Kivelson, and J. M. Tranquada, Proc. Natl. Acad. Sci. USA 96, 8814 (1999).
- Castro Neto (2001) A.-H. Castro Neto, Phys. Rev. B 64, 104509 (2001).
- Park and Sachdev (2001) K. Park and S. Sachdev, Phys. Rev. B 64, 184510 (2001).
- Yoshizawa et al. (2000) H. Yoshizawa et al., Phys. Rev. B 61, R854 (2000).
- Ichikawa et al. (2000) N. Ichikawa et al., Phys. Rev. Lett. 85, 1738 (2000).
- Wakimoto et al. (1999) S. Wakimoto et al., Phys. Rev. B 60, R769 (1999).
- (14) M. Fujita et al., eprint cond-mat/0101320.
- Cheong et al. (1994) S.-W. Cheong et al., Phys. Rev. B 49, 7088 (1994).
- Katsufuji et al. (1996) T. Katsufuji et al., Phys. Rev. B 54, R14230 (1996).
- Katsufuji et al. (1999) T. Katsufuji et al., Phys. Rev. B 60, R5097 (1999).
- (18) L. Pintschovius et al., Phys. Rev. B 64, 094510 (2001).
- Schulz (1978) H. J. Schulz, Phys. Rev. B 18, 5756 (1978).
- McQueeney et al. (1999b) R. J. McQueeney, J. L. Sarrao, and R. Osborn, Phys. Rev. B 60, 80 (1999b).
- Pintschovius et al. (1989) L. Pintschovius et al., Phys. Rev. B 40, 2229 (1989).
- Falter and Hoffmann (2001) C. Falter and G. A. Hoffmann, Phys. Rev. B 64, 054516 (2001).
- Weber (1987) W. Weber, Phys. Rev. Lett. 58, 1371 (1987).
- Homes et al. (2000) C. C. Homes et al., Phys. Rev. Lett. 84, 5391 (2000).
- Pashkevich et al. (2000) Y. G. Pashkevich et al., Phys. Rev. Lett. 84, 3919 (2000).
- Yi et al. (1998) Y.-S. Yi, Z.-G. Yu, A. R. Bishop, and J. T. Gammel, Phys. Rev. B 58, 503 (1998).
- Tranquada et al. (1994) J. M. Tranquada et al., Phys. Rev. B 50, 6340 (1994).
- Tranquada et al. (1997) J. M. Tranquada, P. Wochner, and D. J. Buttrey, Phys. Rev. Lett. 79, 2133 (1997).
- (29) M. Braden, W. Reichardt, S. Shiryaev, and S. N. Barilo, eprint cond-mat/0107498.