Magnetic Field Dependence of the Transverse Plasmon in SmLa0.8Sr0.2CuO4-δ
Abstract
The magnetic field and temperature dependence of the transverse and longitudinal plasmons in SmLa0.8Sr0.2CuO4-δ have been measured for frequencies cm-1 and magnetic fields T. A transition between a vortex glass and a vortex liquid regime, which revealed different field dependencies of the resonance frequencies, could be clearly observed. The positions and the spectral weights of the plasmons were successfully described using the multilayer model (Phys. Rev. B 64, 024530, 2001), which takes the compressibility of the electronic liquid into account. The compressibility is shown to remain constant in the broad range of field and temperature, which strongly supports the applicability of the model. The absolute value of the compressibility is close to that of a two-dimensional noninteracting electron gas.
The Josephson coupling of the CuO2 layers in the high-temperature superconductors leads to the appearance of a plasma resonance (JPR) along the c-axis [1]. The frequency of this resonance is determined by the strength of the Josephson coupling between the layers and is directly connected to the c-axis penetration depth. The magnetic field and temperature dependence of the JPR has been intensively investigated during the last years providing important informations on the c-axis transport and on the vortex dynamics [2, 3, 4, 5]. Recently, static stripe ordering has been observed in La1.85-yNdySr0.15CuO4 [6] using this technique.
Additional plasma resonances have been predicted [7] for systems with two different coupling constants between the CuO2 layers. For such systems two longitudinal and a transverse plasma modes are expected. The transverse excitation couples directly to the electromagnetic radiation and can therefore be observed as a peak in the real part of the optical conductivity. To explain the appearance of transverse plasma oscillations a simple model with alternating coupling constants (multilayer model) has been proposed by van der Marel and Tsvetkov [7].
The investigation of the transverse plasma has proved to be difficult in YBaCuO [8] and BiSrCaCuO [9] because the characteristic maxima overlap with the phonon resonances. In contrast, the characteristic plasma frequencies of SmLa1-xSrxCuO4-δ [10] are shifted down to the submillimeter frequency range and therefore can well be separated from the phonons. Recently, several groups have reported the observation of two longitudinal and one transverse plasmons in single crystalline SmLa1-xSrxCuO4-δ [11, 12, 13] and Nd1.4Sr0.4Ce0.2CuO4-δ [12]. However, detailed comparison between the experimental data and the multilayer model predictions revealed substantial discrepancies concerning the position and the spectral weight of the transverse plasmon [11, 12]. It has been proposed [14] that the electronic compressibility should be taken into account to bring theory and experiment in better agreement. And indeed, the extended version of the multilayer model including electronic compressibility [14] was able to successfully reproduce the position and amplitude of the transverse plasmon [13].
In this paper we present the magnetic field and temperature dependencies of the transverse and longitudinal plasmons in a single crystal of SmLa0.8Sr0.2CuO4-δ (SmLSCO). The extended version of the multilayer model [14] has been applied to describe the observed spectra. We analyze the dependences of the model parameters with special attention to the electronic compressibility, which in the first approximation may be expected to be independent on magnetic field and temperature.
The single crystals of SmLSCO were grown using a four-mirror image furnace as described previously [13]. After growth the sample has been annealed in the oxygen under high pressure. The crystal showed a superconducting transition at K with the transition width of 2 K. A thin ac-oriented plate of the size mm2 has been cut from the original crystal and polished to a thickness of by diamond paste. The transmittance measurements in the submillimeter-wave range have been performed using a coherent source spectrometer [15]. Different backward-wave oscillators (BWO’s) have been employed as monochromatic and continuously tunable sources covering the range from 5 cm-1 to 30 cm-1. The Mach-Zehnder interferometer arrangement has allowed measuring both the intensity and the phase shift of the wave transmitted through the sample. Using the Fresnel optical formulas for the complex transmission coefficient of a plane-parallel sample, the complex conductivity has been determined directly from the measured spectra. Due to high degree of the polarization of the radiation, the spectra could be, in principle, measured both along the a- and c-axes. However, due to high conductivity of SmLSCO within the CuO2 planes, the sample was completely opaque for -axis ( is the ac-electric field of the incident radiation). The anisotropy could be measured solely for room temperature as .
The magnetic field T has been applied along the c-axis using a superconducting split-pair magnet equipped with mylar windows for the electromagnetic radiation. The experiments in magnetic field have been performed using the field sweeping (FS) conditions [3]. Within the FS conditions the actual field in the sample may deviate from the external field by the value determined by the Bean critical field [16] , where is the critical current density and is the sample thickness. From the magnetization measurements the Bean critical field has been determined as at K, which corresponds to . The demagnetization effects can be neglected because of the thin-plate geometry of the experiment.
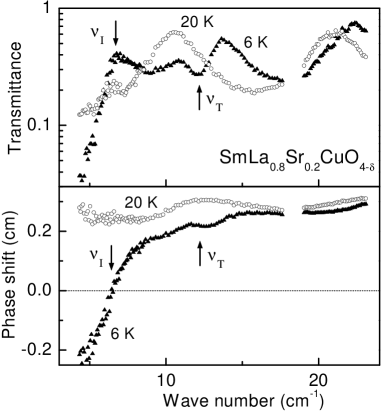
Fig. 1 shows examples of transmittance and phase shift spectra of SmLSCO along the c-axis above and below the superconducting transition. The overall frequency dependence of the data is dominated by the interference fringes due to relative transparency of the sample along the c-axis. In the normally-conducting state ( K) the interference maxima are seen around cm-1 and cm-1, from which the c-axis dielectric constant can directly be estimated via . Here is an integer. The measured curves in Fig. 1 are strongly modified in the superconducting state: both transmittance and phase shift are suppressed at low frequencies due to the growth of the imaginary part of the complex conductivity . Most importantly, two new effects can directly be observed in the experimental transmittance data as an additional maximum at cm-1 and minimum at cm-1. The first feature corresponds to the (low-lying) longitudinal plasmon and is seen also as a zero crossing of the phase shift. The second feature corresponds to a transverse plasmon and is characterized by a minimum in transmittance and a smooth step in the phase shift. The second longitudinal plasmon ( cm is not seen in the transmittance spectra because it strongly overlaps with the transverse resonance.
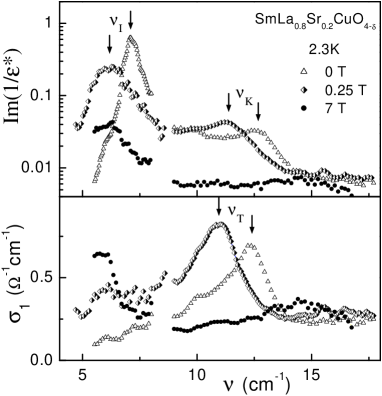
The evaluation of the complex conductivity from the transmittance and phase shift removes the interference fringes from the spectra because they are automatically included in the Fresnel expressions. The resulting conductivity and the loss function are represented in Fig. 2 for different magnetic fields along the c-axis. The complex dielectric function is given by , where is the permittivity of free space and is the angular frequency. The transverse plasmon is clearly seen in the lower frame of Fig. 2 as a maximum of . The longitudinal plasmons cannot be observed in the real part of the conductivity because they do not lead to the absorption of the electromagnetic radiation. Instead, they can be observed as peaks in the loss function.
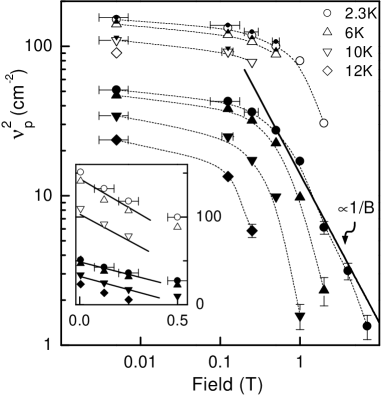
Fig. 3 represents the magnetic field dependence of the plasma resonances in SmLSCO. The frequency of the transverse plasmon has been determined by the peak positions in and the frequency of the longitudinal plasmons have been derived from the maxima of the loss function. For high fields and high temperatures the low-lying longitudinal plasmon was shifted to low frequencies, outside the range of the present experiment. In that case, the resonance frequency has been obtained as zero crossing of , assuming that in the superconducting state the usual low-frequency relation holds: .
For all resonances presented in Fig. 3 the field-dependence can be clearly separated in two regimes: a low-field region with a weak field dependence below T and a high-field regime, for which an approximate dependence is applicable. We identify therefore the high field region as a vortex-liquid state, in which both, theoretically [17] and experimentally [3, 4, 5], the plasma frequency has been shown to behave as .
In addition, the inset of Fig. 3 represents the low-field dependence of the plasma frequencies on the linear scale. From this presentation the linear field-dependence of in low magnetic field becomes evident. At low fields the regime of isolated vortices is expected to be applicable and no field dependence of the plasma frequency is expected in zeroth order approximation. However, taking into account thermal fluctuation and pinning disorder, a linear correction of the squared plasma frequency is expected theoretically [18] and has been recently observed [19] in Tl2Ba2CaCu2O8 using the JPR technique. However, we note that the theoretical considerations have been carried out for the system with a single Josephson coupling between the CuO2 layers. In the zeroth order approximation, we expect the same magnetic field dependencies also for a system with two coupling constants like SmLSCO.
The upper panels of Fig. 4 represents the dielectric contribution of the transverse plasmon , which may be obtained either integrating the area under the resonance in via (Fig. 2) or fitting a conventional oscillator model to the complex conductivity. Both procedures led to similar results. A reliable analysis of the spectra could be carried out for T only, which explains somewhat limited range of data in Fig. 4. As demonstrated by the left upper panel of Fig. 4, the magnetic field strongly influences the dielectric contribution of the transverse plasma: increases by a factor of 2 between and T. The field enhancement of leads to the non-conservation of the transverse spectral weight According to Fig. 3, is reduced by a factor of 1.5 at T, which does not compensate the doubling of the dielectric contribution and indicates a enhancement of the transverse spectral weight in magnetic field of 0.5 T. The temperature dependence of the dielectric contribution is shown in the right upper panel of Fig. 4. As in the case of the field-dependence, the data indicate a weak increase with temperature.
Finally, we discuss the results within the frame of the multilayer model by van der Marel and Tsvetkov [14]. In this model the complex dielectric constant of a layer with two different coupling constants is given by
| (1) |
where and are low- and high-frequency longitudinal plasma frequencies, and are the corresponding damping factors, and is the high-frequency dielectric constant. The transverse plasma frequency is given by . Here and are the weight factors of both longitudinal plasmons, which are connected as The weight factors are obtained via [14]
| (2) |
Here are the unrenormalized weight factors which are directly obtained from the relative distances between the corresponding layers in SmLSCO . This leads to , because . A correction due to the lattice polarizability, characterized by the dielectric constants of the layers, gives [13, 14] .
Despite its relative complexity, the advantage of Eq. (2) is that it contains only one unknown parameter which is inversely proportional to the two-dimensional electronic compressibility (), . Here is the electron density and Å is the lattice constant along the c-axis. The frequencies and the weight factor are measured in the experiment, while the starting weight factors are obtained from structural considerations.
The data, presented in Fig. 3 and in the upper panel of Fig. 4, are already sufficient to determine all parameters of the model, because the dielectric contribution of the transversal plasma can be obtained from Eq. (1) and is given by
| (3) |
Eq. (3) provide the values of the weight factors from known resonant frequencies and the dielectric contribution. However, equivalent results were obtained by directly fitting the experimental spectra using Eq. (1).
The middle panels of Fig. 4 show the weight factor of the high-frequency plasmon in SmLSCO as a function of temperature and magnetic field. The weight factor reveal the dependencies, which are similar to that of in the upper panel: a pronounced increase in magnetic field and much weaker but still visible increase as function of temperature.
A striking result of this work is shown in the lower panels of Fig. 4, which represent the electronic compressibility of SmLSCO. The compressibility reveals neither field nor temperature dependence in the presented range. As a matter of fact, in first approximation it can be expected that the compressibility , where is the chemical potential, is independent of field and temperature. This strongly supports the idea that indeed is the reason for the deviation of the the simple version of the multilayer model [7] from experimental data [11, 12, 13]. From the data of Fig. 4 we obtain per Cu-atom. A discrepancy in absolute value to Ref. [13] ( ) is due to the difference in the high-frequency dielectric constant, which has been adopted for calculations. We note further, that the electronic compressibility of the two-dimensional electronic gas depends upon the effective mass only from which the effective mass may be estimated: .
In conclusion, we have measured the magnetic field and temperature dependencies of the longitudinal and transverse plasmons in SmLa0.8Sr0.2CuO4-δ. In agreement with previous data, two longitudinal and one transverse plasmon have been observed in the submillimeter cm spectra. The field dependence of the resonance frequencies reveals two different regimes. In the low-field region , which we identify as a vortex-glass regime, linearly depends upon field. For higher magnetic fields, are much more strongly suppressed, which may be approximated by and is close to known from the theory of the vortex-liquid state. The full experimental data-set was successfully described by the multilayer model by van der Marel and Tsvetkov [14], which includes the electronic compressibility to correctly obtain the frequency and the spectral weight of the transverse plasmon. The most surprising result is the field and temperature independence of the compressibility, with an absolute value close to that of a two-dimensional noninteracting electron gas.
We would like to thank A. A. Tsvetkov and Ch. Helm for useful discussions. We are indebted to M. Müller for carrying out the SQUID experiments. This work was supported by the BMBF via the contract 13N6917/0 - EKM.
REFERENCES
- [1] M. Tachiki, T. Koyama, and S. Takahashi, in Coherence in High Temperature Superconductors, Editors G. Deutscher and A. Revcolevschi (World Scientific, Singapore, 1995) p. 371.
- [2] O. K. C. Tsui et al., Phys. Rev. Lett. 73, 724 (1994).
- [3] Y. Matsuda et al., Phys. Rev. Lett. 78, 1972 (1997).
- [4] T. Shibauchi et al., Phys. Rev. Lett. 83, 1010 (1999).
- [5] M. B. Gaifullin et al., Phys. Rev. Lett. 84, 2945 (2000).
- [6] S. Tajima et al., Phys. Rev. Lett. 86, 500 (2001).
- [7] D. van der Marel and A. A. Tsvetkov, Czech. J. Phys. 46, 3165 (1996).
- [8] D. Munzar et al., Sol. State Comm. 112, 365 (1999); M Grüninger et al., Phys. Rev. Lett. 84, 1575 (2000).
- [9] V. Železný et al., Phys. Rev. B 63, 060502 (2001).
- [10] H. Shibata and T. Yamada, Phys. Rev. Lett. 81, 3519 (1998).
- [11] H. Shibata, Phys. Rev. Lett. 86, 2122 (2001).
- [12] T. Kakeshita et al., Phys, Rev. Lett. 86, 4140 (2001).
- [13] D. Dulić et al., Phys. Rev. Lett. 86, 4144 (2001).
- [14] D. van der Marel and A. A. Tsvetkov, Phys. Rev. B 64, 024530 (2001).
- [15] G. V. Kozlov and A. A. Volkov, in Millimeter and Submillimeter Wave Spectroscopy of Solids, edited by G. Grüner (Springer, Berlin, 1998), p. 51.
- [16] C. P. Bean, Rev. Mod. Phys. 36, 31 (1964); E. H. Brandt, Rep. Progr. Phys. 58, 1465 (1995).
- [17] A. E. Koshelev, Phys. Rev. Lett. 77, 3901 (1996).
- [18] L. N. Bulaevskii et al., Phys Rev. B 61, R3819 (2000); A. E. Koshelev, L. I. Glazman, and A. I. Larkin, Phys. Rev B 53, 2786 (1996).
- [19] D. Dulić et al., Phys. Rev. Lett. 86, 4660 (2001).