Spin polarization and g-factor of a dilute GaAs two-dimensional electron system
Abstract
The effective g-factor () of a dilute interacting two-dimensional electron system is expected to increase with respect to its bare value as the density is lowered, and to eventually diverge as the system makes a transition to a ferromagnetic state. We report here measurements of in dilute (density 0.8 to 6.5 cm-2), high-mobility GaAs two-dimensional electrons from their spin polarization in a parallel magnetic field. The data reveal a surprising trend. While is indeed significantly enhanced with respect to the band g-factor of GaAs, the enhancement factor decreases from about 6 to 3 as the density is reduced.
pacs:
73.50.-h, 71.70.Ej, 73.43.QtThe ground state of a dilute, interacting electron system has been of interest for decades. It has long been expected that, because of interaction, such a system makes a transition to a ferromagnetic state as the density is reduced below a certain threshold bloch ; stoner . For even lower densities, the system should eventually become an electron solid (Wigner crystal) wigner . A relevant parameter associated with this evolution is the effective g-factor () of the system. In the limit of high density, when the parameter , the average interparticle separation measured in units of effective Bohr radius, approaches zero, should have the ”bare” value determined by the energy band structure of the host material. With decreasing density, is expected to increase monotonically and diverge at the density below which the electron system enters its ferromagnetic state. For an ideal two-dimensional electron system (2DES), quantum Monte Carlo calculations tanatar ; varsano indeed confirm the above trend.
An excellent candidate for testing these predictions is the GaAs 2DES, as it possesses very low disorder combined with a simple band structure. Here we report measurements of the spin polarization of a very high quality, dilute 2DES in a modulation doped GaAs/AlGaAs heterostructure as a function of an in-plane magnetic field. Via transport measurements, we find the magnetic field above which the 2DES becomes fully spin polarized, and from this field we determine . The results reveal a remarkable trend: as the density is lowered from 6.5 to 0.8 cm-2, corresponding to an increase in from 2.1 to 6.3, the measured decreases from 2.7 to 1.3. This implies a substantial overall enhancement of with respect to the band g-factor of GaAs ( in GaAs weisbuch ). The decrease of with , however, is unexpected.
We studied a Si-modulation doped GaAs heterostructure grown on a (100) GaAs substrate. We used a square sample in a Van der Pauw geometry, with a backgate to control the density. We made measurements in a dilution refrigerator at a temperature () of mK and magnetic fields () up to 18T, and in pumped at K and fields up to 33T. The sample was mounted on a single-axis tilting stage that can be rotated, using a computer controlled stepper motor, in order to change the angle () between the sample plane and the magnetic field. The measurements were done using low-frequency lock-in techniques. At zero gate bias, the sample has a density cm-2 and a mobility of 55 m2/Vs.
An external magnetic field applied parallel to the 2DES causes a Zeeman splitting of the energy bands. This splitting induces a difference in population of the spin-up and spin-down subbands, which leads to a net spin polarization of the system. If the splitting exceeds the Fermi energy of the system, all spins are aligned and the 2DES is fully spin polarized. Assuming a simple model, in which is independent of the applied magnetic field, we can write the splitting between the spin-up and spin-down subbands as , where is the Bohr magneton. In this model the 2DES becomes fully spin polarized at a field , given by
| (1) |
where is the effective mass, is the total density of the 2DES and is Planck’s constant. We emphasize that we measure the effective g-factor defined, as in Eq. (1), by the field at which full polarization is achieved.
In our experiments we measure, via the analysis of Shubnikov-de Haas (SdH) oscillations, the Fermi contours of the two spin subbands. We apply a constant magnetic field parallel to the 2D plane and slowly rotate the sample around to induce a small perpendicular field component, . We record the sample resistance during the rotation, and Fourier analyze its SdH oscillations with to obtain the populations of the two spin subbands tutuc . Our experiments allow a determination of the field, , above which the minority spin-subband depopulates and the 2DES becomes fully spin polarized. In the range where the Fourier transforms are done the parallel component of the field, , is equal to the total field to better than 2%.
In Fig. 1 we show plots of the sample resistance vs. , taken at a density cm-2, as determined from the positions of quantum Hall states. The top trace was taken in a purely perpendicular field. The Fourier transform (FT), shown on the right, exhibits two peaks, one at 0.85T and another at approximately half this value, 0.42T. The 0.85T frequency, when multiplied by , gives cm-2, i.e., the total density of the 2DES. The 0.42T peak stems from the spin unresolved SdH oscillations. The rest of the traces shown in Fig. 1 were taken by rotating the sample at the indicated applied almost parallel to the 2DES. With increasing , we observe a splitting of the lower FT peak (0.42T) into two peaks. The positions of these two peaks, multiplied by , give the two spin subband populations. Note that the two populations add up to the total density of the sample. As is increased, the majority spin subband peak merges with the total density peak (0.85T) and the minority spin subband peak moves to very low frequencies and is no longer resolved R2 .
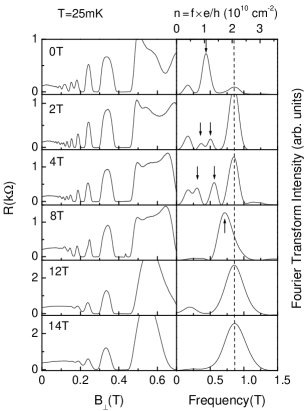
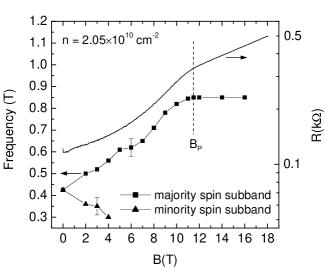
In Fig. 2 we summarize the positions of the FT peaks corresponding to the majority and minority spin subbands as a function of for the case examined in Fig. 1. Above a certain field the majority spin subband population saturates at a value which corresponds to the total density of the 2DES. Therefore, marks the onset of full spin polarization. Within the experimental error, the evolution of the FT peak positions as a function of field is linear. This implies that is roughly independent of the applied parallel field.
We also measured the in-plane magnetoresistance (MR), by fixing at and recording the resistance as a function of the applied magnetic field. The MR trace, taken for cm-2, is also shown in Fig. 2. This trace exhibits a clear break in the functional form of the MR as it changes from an dependence at low field to a simple exponential, dependence at higher fields. The data in Fig. 2 demonstrate that the onset of the simple exponential behavior of the in-plane MR coincides with the field above which the spins are fully polarized. Remarkably, the same functional behavior of the in-plane MR is seen in GaAs 2D hole systems yoon , and it has been shown tutuc that the onset of the simple exponential regime corresponds to the full spin polarization of the 2D system. Several studies on 2D electrons in Si-MOSFETs have also pointed out a correlation between the in-plane MR and the full spin polarization mertes ; okamoto ; vitkalov ; dolgopolov .
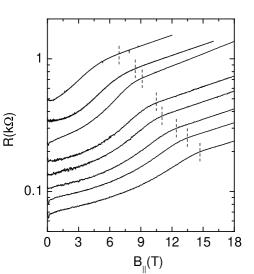
The strong correlation between the full spin polarization and the onset of exponential MR provides another method of finding the field . While this method does not allow a direct measurement of the spin subband populations, it can be useful at lower densities where the SdH method is no longer practical because of a decrease in the number of resistance oscillations. We summarize in Fig. 3 our MR data taken at different densities. At all densities, the MR exhibits an dependence at high fields and the onset of this dependence clearly depends on the density. We emphasize that in several cases where we have made both MR and SdH oscillations measurements in constant field, the values of obtained from the two methods coincide.
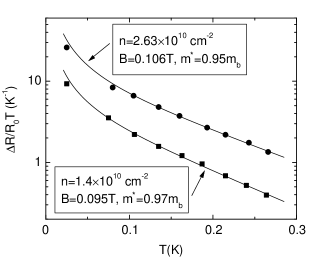
Using the measured values of and the relation (1) we determine . For we use the saturation field of the majority spin subband FT peak and the onset of the exponential regime of the in-plane MR. Another parameter needed is the effective mass, , which also can be different from the band effective mass due to electron-electron interaction kwon . We independently measured from the dependence of SdH oscillations in a purely perpendicular magnetic field at several densities in the range 1.4 to 3 cm-2. The analysis uses the Dingle formula, , where is the normalized amplitude of the SdH oscillations, and . Fits of the Dingle formula to the data are shown in Fig. 4, together with the values of that provide the best least-squares fit. Within the experimental error (7%), is the same as the band effective mass of electrons in GaAs, , where is the free electron mass. For simplicity, in determining we have used the band effective mass.
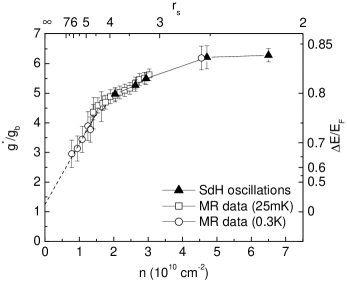
In Fig. 5 we plot the values of , normalized to the GaAs band g-factor, as a function of density and jiang . The open and closed symbols denote the two methods used to determine ; their overlap confirms that the onset of exponential regime of the MR marks the full spin polarization. For the lowest density traces, we have data available only at 0.3K. However, dependence of the in-plane MR, measured at cm-2, showed only a small variation of with in the range 25mK to 0.5K. The larger error bars for the lowest density points in Fig. 5 take into account such variation with .
Figure 5 data highlight the main finding of our work: while the measured values of are three to six times larger than the GaAs band g-factor, this enhancement decreases with increasing . This trend is unexpected and at variance with theoretical calculations which predict that, for an ideal 2DES, should increase as increases and the interaction becomes more important tanatar ; varsano . While we do not have an explanation for this discrepancy, we point out that at least three factors distinguish our samples from ideal 2D systems: finite layer thickness, disorder, and the spin-orbit interaction.
For a 2DES with finite layer thickness, even in a single-electron picture, an in-plane magnetic field can affect the energy bands and therefore both the effective mass wieck and the g-factor. Indeed, band calculations winkler performed for the 2DES studied in our work reveal some enhancement of the effective mass and, to a lesser degree, a reduction of the g-factor with in-plane field. However, these modifications of the band parameters appear to be too small to explain the data of Fig. 5.
The effect of disorder is more subtle. As the density is reduced, the disorder potential can play a more dominant role than the electron-electron interaction, and may lead to an inhomogeneous spatial distribution of the electrons in the sample. If the electrons become localized in the potential minima, it is possible that the behavior of the 2DES reverts to that of a single-particle system and decreases. Such a scenario is consistent with the data of Fig. 5: for , extrapolates to a value close to unity. On the other hand, we have made measurements on a sample with a mobility three times lower than the present specimen, and obtained similar results as those shown in Fig. 5. Moreover, our sample exhibits no signs of strong electron localization: it exhibits SdH oscillations, and its resistivity is less than .
An examination of the results of several studies okamoto ; pudalov ; vitkalov which have reported measurements of in Si-MOSFET 2D electrons provides further argument against disorder being responsible for the anomalous behavior we observe in Fig. 5. These studies have generally reported an enhancement of with increasing in much the same range of that we have examined. The mobility of our 2DES, however, is about a factor of 10 larger than in Si-MOSFETs even though our densities are about 10 times smaller, implying lower disorder in our samples. If disorder were the main culprit, one would expect that Si-MOSFET data should also show a decreasing with increasing R3 .
Another important observation is worth describing. As we mentioned before, the in-plane MR of GaAs 2D holes was recently reported yoon ; papadakis ; tutuc , and a relation between the MR behavior and full spin polarization, similar to that shown in Fig. 2, was established tutuc . If we convert the magnetic fields above which the 2D holes are fully spin polarized to an effective , we find a trend very similar to the one seen in Fig. 5: is enhanced with respect to its band value but it decreases with increasing . We emphasize that the GaAs 2D holes too have very high mobilities and should contain low disorder. We conclude that, while we cannot rule out the role of disorder, the unexpected behavior we observe in Fig. 5 appears to be intrinsic to low disorder GaAs 2D electrons and holes.
The spin-orbit interaction, present in both GaAs 2D electron and hole systems, but nearly absent in Si-MOSFETs, may also play a role here. Since is significantly influenced by the spin-orbit interaction, one may expect that this interaction should modify in a many-body picture also. It is not clear, however, how the spin-orbit interaction would explain the trend in Fig. 5.
Finally, in Fig. 5 we provide a measure of the interaction energy for the spin polarization of our 2DES. We introduce the enhancement energy , defined as the difference between the band Fermi and Zeeman energies, both evaluated at the in-plane field where the 2DES becomes fully spin polarized, i.e. . The energy , measured in units of the Fermi energy is then simply equal to . This quantity, which is indicated on the right scale of Fig. 5, reiterates the main result of our study. The measured decreases with increasing , while theoretical calculations tanatar ; varsano predict the opposite: should be zero at , increase monotonically with , and reach unity for larger than a critical value of .
We thank E.P. De Poortere, D.M. Ceperley, A.H. MacDonald, B.L. Altshuler and R. Winkler for fruitful discussions. This work was supported by the DOE, NSF and the von Humboldt foundation. Part of the work was done at NHMFL which is supported by NSF; we also thank T. Murphy and E. Palm.
References
- (1) F. Bloch, Z. Phys. 57, 545 (1929).
- (2) E.C. Stoner, Proc. R. Soc. Lond. A 165, 372 (1938).
- (3) E. Wigner, Phys. Rev. 46, 1002 (1934).
- (4) B. Tanatar and D.M. Ceperley, Phys. Rev. B39, 5005 (1989).
- (5) D. Varsano, S. Moroni and G. Senatore, Europhys. Lett. 53, 348 (2001).
- (6) C. Weisbuch and C. Hermann, Phys. Rev. B15, 816 (1977).
- (7) E. Tutuc et al., Phys. Rev. Lett. 86, 2858 (2001).
- (8) The peaks observed at very low frequencies (T) in Fig. 1 are FT artifacts.
- (9) J. Yoon et al., Phys. Rev. Lett. 84, 4421 (2000).
- (10) K. Mertes et al., Phys. Rev. B60, 5093 (1999).
- (11) T. Okamoto et al., Phys. Rev. Lett. 82, 3875 (1999).
- (12) S.A. Vitkalov et al., Phys. Rev. Lett. 87, 086401 (2001).
- (13) V.T. Dolgopolov and A. Gold, JETP Lett. 71, 27 (2000).
- (14) Y. Kwon, D.M. Ceperley, and R.M. Martin, Phys. Rev. B50, 1684 (1994).
- (15) Because of the penetration of the wave-function into the barrier, the band g-factor may slightly change with density. Based on recent measurements, however, we estimate this change to be in our sample [H.W. Jiang and E. Yablonovitch, cond-mat/0102044 (2001)].
- (16) A.D. Wieck et al., Phys. Rev. B39, 3785 (1989).
- (17) R. Winkler, unpublished.
- (18) V.M. Pudalov et al., cond-mat/0105081 (2001).
- (19) There is, however, a difference between the disorder potentials in modulation doped heterostructures and Si-MOSFETs: the former is dominated by long range fluctuations while the latter by short range fluctuations.
- (20) S.J. Papadakis et al., Phys. Rev. Lett. 84, 5592 (2000).