ELECTRONIC STRUCTURE, BONDING AND OPTICAL SPECTRUM OF MgB2
Ames Laboratory, Iowa State University, Ames, IA 50011, USA
†Sandia National Laboratories, Livermore, CA 94551, USA
‡Vanderbilt University, Nashville, TN 37235, USA
1 Introduction
The recent discovery of superconductivity (SC) in MgB2 [1] stimulated a significant interest in this system. One of the first questions is whether MgB2 represents a new class of superconductors, or whether it may be related to other known classes in terms of its bonding and electronic properties. Is it a unique system or just a representative of some family of compounds with similar or even better properties? The latter case seems unlikely after all studies [2, 3] of possible dopings such as Mg1-xAlxB2, MgB2-xCx, Mg1-xLixB2 and Mg1-xMnxB2 showed loss of SC, and many attempts to dope MgB2 with other elements failed.
The crystal structure of MgB2 may be regarded as that of completely intercalated graphite [4] with carbon replaced by boron, its neighbor in the periodic table. In addition, MgB2 is formally isoelectronic to graphite. Therefore, chemical bonding and electronic properties of MgB2 are expected to have strong similarity to those of graphite and graphite intercalation compounds (GIC’s), some of which also exhibit SC.
The search for high-temperature SC in carbon phases started in 1965 when SC with in KC8 was reported and subsequently explained in terms of the interaction of bands with the longitudinal phonon modes of the carbon layer [5]. Similar conclusions for the electronic structure at the Fermi level were derived for LiC6. The highest achieved for a GIC was 5 K [6]. A parallel development was that of SC in Bechgard salts, the organic charge-transfer systems. Within this family of materials exhibiting carbon band conductivity, was raised to 12.5 K [7]. It should be noted that the majority of these compounds are unstable at normal conditions and high-pressure experiments are most common.
Later research shifted to the area of carbides of transition metals where metallicity and conductivity are mostly due to transition metal atoms. Only in 1991 was it found that alkali-doped fullerenes also exhibit SC with the highest of 33 K [8]. This group of 3D carbon-based metals has a modified (compared to graphite) coupling of lattice vibrations to Fermi electrons due to the curvature of the molecule, but the conducting states still derive from the graphite band.
In this paper we will show that in spite of the structural similarity to intercalated graphite and, so some extent, to doped fullerenes, MgB2 has a qualitatively different and rather uncommon structure of the conducting states setting it aside from both these groups of superconductors. The peculiar and (so far) unique feature of MgB2 is the incomplete filling of the two bands corresponding to prominently covalent, -hybridized bonding within the graphite-like boron layer. The holes at the top of these bands manifest notably two-dimensional properties and are localized within the boron sheets, in contrast with mostly three-dimensional electrons and holes in the bands which are delocalized over the whole crystal. These 2D covalent and 3D metallic-type states contribute almost equally to the total density of states (DOS) at the Fermi level, while the unfilled covalent bands experience strong interaction with longitudinal vibrations of the boron layer.
Below we discuss the properties of MgB2 following from its theoretical treatment in the local density approximation (LDA). However, an unusually strong non-linear electron-phonon coupling (EPC) [9] together with the probable non-adiabaticity [10] raise a question whether the ground state and the excitation spectrum may be adequately treated in LDA. In this situation it is especially important to check the LDA predictions against the experimental data related to the electronic structure of MgB2 and doped alloys. Therefore we also try to provide the basis for such comparison using both our own results and those available in the literature.
This paper is organized as follows. The electronic structure of bulk and surface of MgB2 and its relation to GIC’s is described in Section 2 along with the effects of doping. Here we justify our choice of the Mg1-xAlxB2 system for detailed studies allowing one to analyze trends associated with band filling and their relation to the loss of SC. We believe that such analysis is more valuable as opposed to the studies of a single system due to many uncertainties (physical and numerical) of current band structure calculations and experiments. The relevance of the theoretical DOS at the Fermi level as well as the anisotropy of conducting states are analyzed in Section 3 in connection with NMR data for Mg1-xAlxB2 alloy. Short description of the EPC studies is presented in Section 4 along with the comparison of theoretically predicted with that deduced from the experimental data. Optical calculations for MgB2 and AlB2 single crystals are described in Section 5.
2 Electronic structure and bonding
MgB2 occurs in the AlB2 structure. Boron atoms reside in graphite-like (honeycomb) layers stacked with no displacement [11] forming hexagonal prisms with the base translation almost equal to the height, (3.009) Å and (1.084) for MgB2 (AlB2). These prisms contain large, nearly spherical pores occupied by Mg atoms. As in graphite (=1.42 Å), the intralayer B–B bonds are much shorter than the interlayer distance, and hence the B–B bonding is strongly anisotropic. However, the intralayer bonds are only twice as short as the interlayer ones compared to the ratio of 2.4 in graphite, allowing for a significant interlayer hopping. For comparison, the interatomic distance between nearest neighbors is 1.55 Å in diamond and 1.4–1.45 Å in the C60 molecule.
Early studies of the band structures of MgB2 and AlB2 [12-15], as expected, showed their notable similarity to that of graphite (see e.g. [16] and references therein). Full-potential band structure calculations of AlB2 are available in the literature [15]. A recent paper [17] reported the results of the studies of MgB2 and AlB2, but the structure of conducting states was not addressed.
Below we discuss the electronic structure of MgB2 and some related compounds obtained [18-20] using the Stuttgart TB-LMTO (ASA) code, full-potential LMTO (FLMTO) [21] and full-potential LAPW (FLAPW) methods. It was found that the addition of gradient corrections to the local exchange-correlation potential has only a tiny effect on the results. It also appears that a general analysis of energy bands for MgB2 may be safely done in ASA, while a reliable treatment of charge densities and anisotropy of transport properties requires more accurate full-potential calculations. The band structure of AlB2 is much more sensitive to the choice of atomic spheres in ASA, and full-potential treatment is imperative. Other methods were also used to calculate the electronic structure of MgB2 with very similar results.
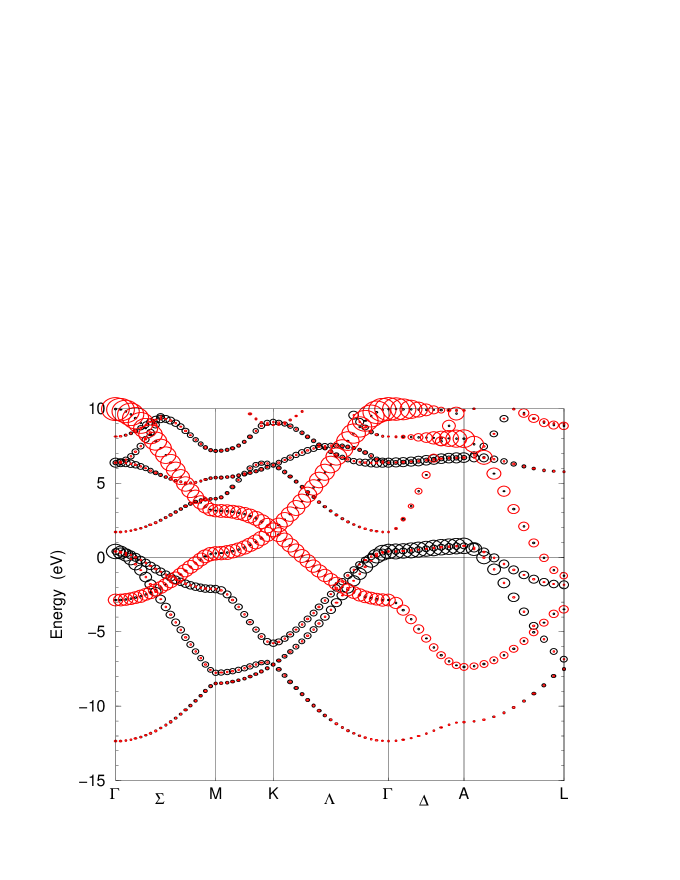
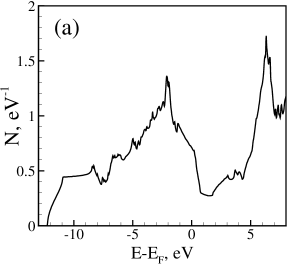
The energy bands, DOS and the Fermi surface of MgB2 are shown in Figs. 1, 2a and 3a. As expected, the bands are quite similar to those of graphite with three bonding bands corresponding to in-plane () hybridization in the boron layer and two bands (bonding and antibonding) formed by aromatically hybridized boron orbitals. Both and bands have strong in-plane dispersion due to the large overlap between all orbitals (both in-plane and out-of-plane) for neighboring boron atoms. In particular, the total width of the bands is 17 eV (which gives [22] , see below). The interlayer overlaps are much smaller, especially for orbitals, so that the dispersion of bands does not exceed 1 eV. From the other hand, in contrast to graphite and GIC’s, two of the bands are filled incompletely, as it was first noted in Ref. [13]. Together with weak dispersion this results in the appearance of two nearly cylindrical sheets of the Fermi surface (see Fig. 3a) around the –A line. As we will see below from the analysis of the charge density distribution, these unfilled bands with boron character fully retain their covalent structure. Conducting covalent bonds represent a peculiar feature of MgB2 making it an exotic compound probably existing on the brink of structural instability. The blue (red) hole-type (electron-type) tubular network in Fig. 3a corresponds to the bonding (antibonding) band.
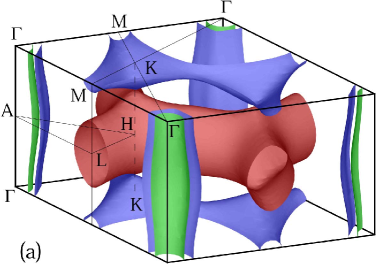
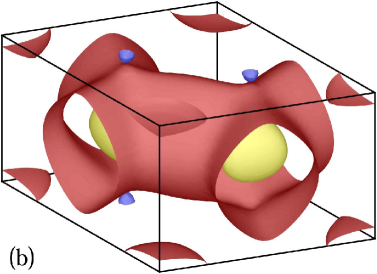
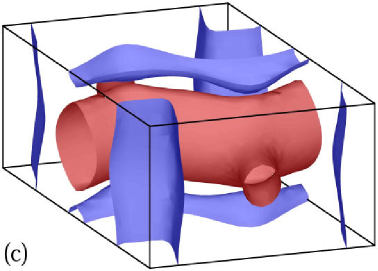
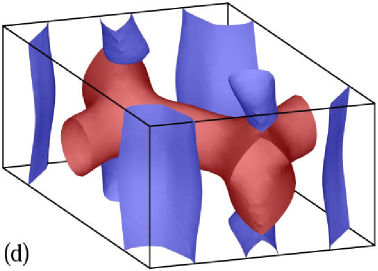
It is seen in Fig. 3a that the bands form two planar honeycomb tubular networks: an electron-type sheet centered at (red) and another similar, but more compact, hole-type sheet centered at (blue). These two sheets touch at some point on the K-H line. Note that the hole-type sheet is close to the electronic topological transition (ETT) at the M point corresponding to the breakdown of the tubular network into separate shell-like pockets (at 0.25-0.30 eV above ). Although the singularity in the electronic properties is weak, the proximity of this ETT results in a strong coupling with the in-plane phonons, and vibrations of moderate amplitude are able to break the links at the M point (see the discussion of Figs. 3c and 3d below). In addition, this ETT takes place with electron doping (see below).
From Fig. 3a it is clear that the Fermi surface of MgB2 has characteristic features (the cylindrical sheets and the tubular links at M and L points) that almost completely determine its topology. These features are associated with relatively small electronic orbits that are especially suitable for identification in de Haas-van Alphen experiments. Such experiments on single crystals are highly desirable for the verification of the band structure obtained in LDA.
In order to examine the relation between the band structure of MgB2 and that of graphite in more detail we studied the following hypothetical sequence of intermediate materials: carbon in the ‘primitive graphite’ (PG) lattice with no displacement between layers as in MgB2, using graphite lattice parameters; boron in the PG lattice with as in MgB2 and as in graphite; boron in the PG lattice with and as in MgB2; LiB2 in the same structure; MgB2 itself. The results of some of these calculations are shown in Fig. 4.

The band structure of PG carbon shown in Fig. 4a is very similar to that of graphite [16] with the appropriate zone-folding for a smaller unit cell. (This is quite natural because of the weak interlayer interaction.) Boron in the same lattice dilated to match the MgB2 in-plane lattice parameter (not shown) has nearly identical bands with the energies scaled by the inverse square of the lattice parameter, in agreement with common tight-binding considerations [23]. Fig. 4b shows the natural enhancement of the out-of-plane dispersion of the bands when the interlayer distance is reduced. Figs. 4c and 4d demonstrate that ‘intercalation’ of boron by Li or Mg produces a significant distortion of the band structure, so that the role of the intercalant is not simply one of donating electrons to boron’s bands (which would return the band structure to that of PG carbon shown in Fig. 4a). The main change upon intercalation is the downward shift of the bands compared to bands. For Li this shift of 1.5 eV is almost uniform throughout the Brillouin zone. Replacement of Li by Mg shifts the bands further, but this shift is strongly asymmetric increasing from 0.6 eV at the point to 2.6 eV at the A point. In addition, the out-of-plane dispersion of the bands is also significantly enhanced. In LiB2 the filling of the bonding bands is nearly the same as in PG boron, while in MgB2 the Fermi level shifts closer to the top of these bands.
The lowering of the bands in MgB2 compared to PG boron is due to stronger interaction of boron orbitals with ionized magnesium sublattice compared to orbitals. This lowering is greater at the AHL plane compared to the KM plane, because the antisymmetric (with ) overlap of the boron’s tails increases the electronic density close to the magnesium plane where its attractive potential is the strongest.
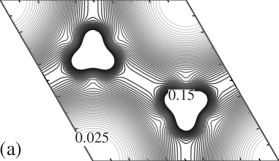
The nature of bonding in MgB2 may be understood from the charge density (CD) plots shown in Fig. 5. As it is seen in Fig. 5a, bonding in the boron layer is typically covalent. The CD of the boron atom is strongly aspherical, and the directional bonds with high CD are clearly seen (see also Ref. [17]). The CD distribution in the boron layer is very similar to that in the carbon layer of graphite [16]. This directional in-plane bonding is also obvious from Fig. 5b showing the CD in the cross section containing both Mg and B atoms. However, Fig. 5b also shows that a large amount of valence charge does not participate in any covalent bonding, but is rather distributed more or less homogeneously over the whole crystal. Further, Fig. 5c shows the difference of the CD of MgB2 and that of hypothetical NaB2 in exactly the same lattice. Not only does it show that one extra valence electron is not absorbed by boron atoms but is rather delocalized in the interstitials; it also shows that some charge moves outward from boron atoms and covalent in-plane B-B bonds. Fig. 5d shows the CD difference between the isoelectronic compounds MgB2 and PG carbon (C2). In MgB2, the electrons see approximately the same external potential as in C2, except that one proton is pulled from each C nucleus and put at the Mg site. It is evident that the change C2MgB2 weakens the two-center bonds (the charge between the atoms is depleted) and redistributes it into a delocalized, metallic density.
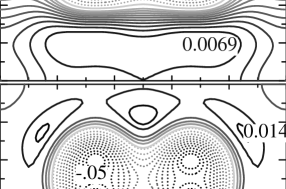
A numerical reconstruction of the electronic charge density from the synchrotron radiation data for a powder MgB2 sample [24] supports this general picture. The charge density found for 15 K is, in fact, very similar to our Fig. 5b and shows all the important features discussed above including the distinct covalent bonds within the boron sheets, the strongly ionized Mg, and the delocalized charges in the interstitials. Further, the Fourier maps obtained [11] for the single crystals also clearly show the covalent hybrids in the boron layer and no covalent bonding between B and Mg atoms.
Because of the coexistence of two different types of conducting states, it is desirable to find the contributions to the total DOS and transport properties from separate sheets of the Fermi surface originating from 2D covalent and 3D metallic-type bonding. Such decomposition is shown in Fig. 6 for the total DOS (see also Ref. [25]) and for the in-plane () and out-of-plane () components of the tensor , where is the -component of the electronic velocity. The 3D (metallic-type bonding) and cylindrical (covalent bonding) parts of the Fermi surface contribute, respectively, about 55% and 45% to . for the hole-type zones rapidly decreases with increasing and already at eV the total DOS is almost completely determined by the 3D electron-type band. The latter contribution is almost constant and probably not related to the change of SC properties under pressure or with doping. The corresponding contribution to conductivity exceeds all other contributions (more than 50% for and ) and is virtually isotropic. Holes in the two cylindrical sheets, as expected, have clearly anisotropic behavior contributing nearly 30% to and virtually nothing to . The 3D hole-type part of the Fermi surface is also notably anisotropic with predominantly -axis conductivity. The total has a rather small anisotropy at with . The average projections of the Fermi velocities are: cm/s, cm/s (see also Refs. [18, 20, 26]). The average Fermi velocities for each Fermi surface sheet are as follows: internal cylinder, 8.85 cm/s; external cylinder, 6.02 cm/s; 3D electronic sheet, 1.12 cm/s; 3D hole sheet, 8.74 cm/s.
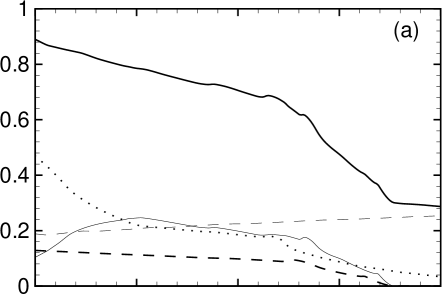
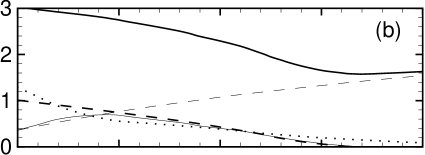

Thus, according to Ref. [19], the structure of MgB2 is held together by strongly covalent bonding within boron layers and by delocalized, ‘metallic-type’ bonding between these sheets. A peculiar feature of this compound is that electrons participating in both of these bond types provide comparative contributions to . This distinguishes MgB2 from closely related GIC’s where covalent bonds in the carbon layers are always completely filled, while the nearly cylindrical parts of the Fermi surface commonly found in those compounds are formed by carbon-derived bands which are also responsible for conductivity in pristine graphite [5].
Thin films are of great technological interest; indeed probably the most important application of MgB2 at present is that for digital logic in very high speed ( 100 GHz) switching applications. Since the device speed scales as the bandgap (and hence with ), MgB2 shows great potential promise as the superconductor of choice. These devices are grown as thin films; thus the role of the surface effects is of interest.
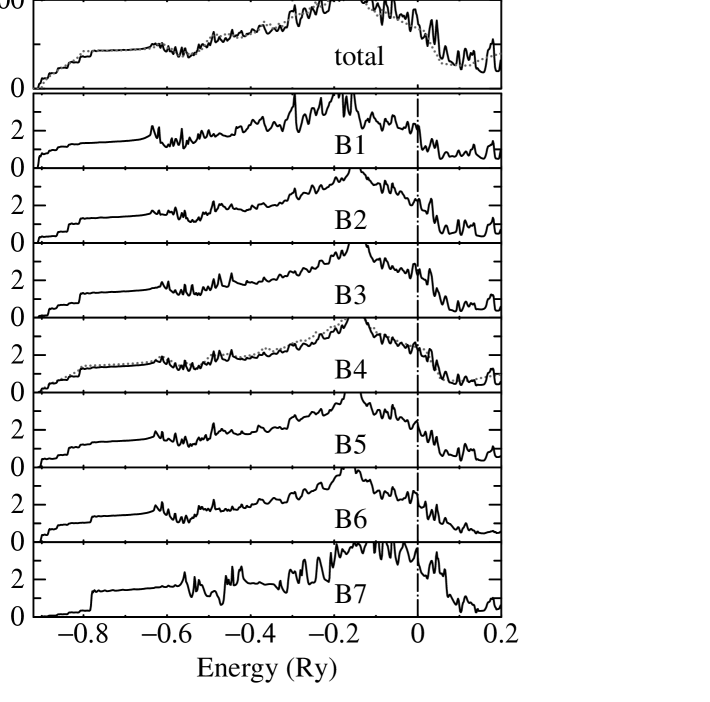
We considered a 7-unit cell (21 atom) slab of MgB2, with 7 cells stacked along the axis, followed by a larger vacuum layer to separate the two faces. A unit cell of MgB2 consists of alternating Mg and B planes along the axis. Thus this slab has two kinds of surfaces: a Mg-terminated surface at and a B-terminated surface at for an ideal, unrelaxed geometry. The slab was fully relaxed; however, it retains the hexagonal symmetry of the bulk lattice, so the only allowed relaxations are in the coordinate (no symmetry-lowering reconstruction was considered). A substantial relaxation was found at both surfaces, each contracting inward so as to reduce the spacing between layers. The relaxation was most pronounced at the Mg-terminated surface (the surface Mg-B spacing contracted by 12%). Fig. 7 shows total DOS (top panel) and partial DOS in sites centered at boron spheres, resolved by layer (panels 2-8). The DOS shown was computed for 8000 points in the full Brillouin zone, using the electronic structure method of Ref. [21]. The dotted lines correspond to that of bulk MgB2: 7 times the total DOS of one unit cell of MgB2 (top panel) and B partial DOS (central panel). The first layer corresponds to the Mg-terminated surface; the last to the B-terminated surface. Several points are evident. (1) The B partial DOS of the central layer is quite similar to that of the bulk DOS, showing that surface perturbations heal in just a few monolayers, as expected for a metal. (2) There is a shift in the B partial DOS towards higher energies at the B-terminated surface (B7), and to lower energies at the Mg terminated surface (B1). To a large extent this effect is electrostatic: the electrostatic potential at the MT boundary for B1 is about 32 mRy higher than for the central layer B4, while the corresponding potential for B7 is about 9 mRy lower. (3) There is an enhancement of DOS near the Fermi level at the B-terminated surface. This is in part due to the electrostatic shift, but also there is an additional structure in the local DOS corresponding to the formation of the surface band which localizes approximately at B6 and B7. (4) There is a slight increase in the total DOS relative to the bulk (top panel), which originates in the surface states from the B-terminated surface.
Now let us discuss the relation of MgB2 to other compounds. The closest existing material is the isostructural AlB2 corresponding to the addition of one electron to MgB2. Al is the only neighbor of Mg in the periodic table that may be used as a dopant producing an isostructural solid solution with a reasonably wide single-phase region. As it is always more useful to study a sequence of similar compounds or doping trends in alloys instead of analyzing a single system, below we discuss the trends in the band structure and related properties of the Mg1-xAlxB2 alloy.
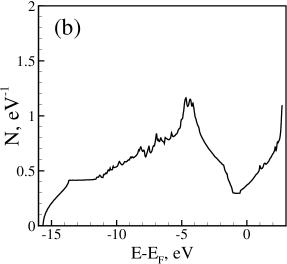
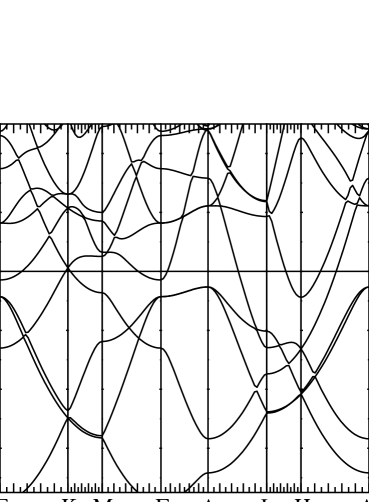
Our FLMTO band structure and DOS of AlB2 shown in Figs. 8 and 2b are in excellent agreement with earlier results [15, 17].
The Fermi surface for AlB2 is shown in Fig. 3b. The red electron-type network (blue pocket at ) corresponds to the antibonding (bonding) band, while red and yellow pockets at and correspond to the ‘interstitial’ electron-type band. In contrast to MgB2, the bands in AlB2 are completely filled, and the Fermi surface has no cylindrical sheets. This difference stems from an extra valence electron, but the rigid band picture does not fully describe the effect of replacement of Mg by Al [20]. The bands are pushed further down in the AHL plane (compared to the bands), together with the interstitial band [20] which is unfilled in MgB2 (2 eV at the point). In AlB2 the latter interstitial band falls below the Fermi level and forms electronic pockets at and H points. The hole-type tubular sheet of the Fermi surface found in MgB2 shrinks to very small hole pockets at the K point in AlB2.
It has been shown [2] that Mg1-xAlxB2 in the region forms single-phase solutions at and at with the same AlB2 structure, while at the system appears to decompose in two isostructural AlB2-type phases with different ratios. The Mg-rich phase remains superconducting up to where is only 2 K lower than in pure MgB2, while the transition broadens in the two-phase region and there is no supeconductivity in the Al-rich phase with (as well as in pure AlB2 [27]).
Unfortunately, very little is known about the subtle structural transition in the Mg1-xAlxB2 alloy. However, as this transition is accompanied by the loss of SC, more detailed experimental characterization of the structural transition as well as of the dependence of the electronic structure on doping are highly desirable. In particular, our FLMTO calculations show that in the rigid band model at approximately the band structure undergoes an above-mentioned ETT at the M point where the hole-type tubular sheet of the Fermi surface splits into compact pockets. In principle, this ETT may be the source of the structural transition, but verification of this connection needs further studies.
Hole doping by replacing Mg by Na or Li seems logical, but the experiments on Mg1-xLixB2 (as well as on MgB2-xCx and Mg1-xMnxB2) revealed the loss of SC [3]. Weak SC was observed under pressure in NaC2 [28] which is very unstable. However, it may be possible to form an alloy (Mg,Na)B2 with modest amounts of Na. It is evident from Fig. 6 that the hole-type parts of the Fermi surface change dramatically with band filling.
The band structure of BeB2 in AlB2 lattice calculated with experimental average or optimized lattice parameters is quite similar to that of MgB2 [15, 20]. The differences include a notable reduction of the lattice parameters (especially of the ratio), wider valence bands, larger dispersion of the bands, and a somewhat different shape of the bands [20]. Due to this latter difference, the hole-type and electron-type sheets of the Fermi surface corresponding to bonding and antibonding bands become almost identical in BeB2. The ETT at the M point (tubular link breaking) shifts approximately 2 eV higher compared to MgB2 and becomes irrelevant for the EPC.
The hypothetical ZnB2 in MgB2 structure is also very similar to MgB2 in terms of the electronic properties. Our calculations for this compound with lattice parameters of MgB2 produced a very similar band structure with a nearly identical Fermi surface. Another recently discovered isoelectronic system LiBC [29] contains both B and C. According to our results this system is a perfect insulator, and any substitution of C by B will lead to metallic behavior. Experimentally small conductivity was observed in LiBC [29]. Electronic structure of this system is also very similar to that of BN [30].
3 Nuclear spin-lattice relaxation
For SC, one of the important parameters is in the normal state. Several groups have performed LDA calculations of this quantity and the results range within 0.68–0.74 states/(eVf.u.) [18-20, 26]. Experimentally can be determined in many different ways but the nuclear spin-lattice relaxation (NSLR) rate measurements represent an excellent opportunity to check experimentally not only the total and its partial components but also their anisotropy, i.e. the distribution between the in-plane and out-of-plane orbitals. For instance, in the studies of in alkali-doped C60 the theoretical analysis of NMR data provided a qualitatively new interpretation of NMR experiments.
For NSLR on 11B () in MgB2 the experimental papers [31-33] reported 180, 155 and 165 Ksec. The relaxation rates were interpreted in terms of dipolar and orbital contributions due to the low Korringa ratio and the known dominance of states at the Fermi level [18-20, 26]. Below we show the results obtained in a more careful theoretical analysis for Mg1-xAlxB2 [34]. As we will see, the studies of NSLR in this system may provide valuable information about the genesis of anisotropy of electronic states at the Fermi level.
We used the following expressions for a monocrystaline material with the hexagonal symmetry [35]:
for Fermi-contact and orbital contributions, respectively. Here and are the corresponding hyperfine fields, is the expectation value of over the state , and is the partial DOS at the Fermi level for the representation (for more details see Refs. [35, 36]). To obtain these values we used the LMTO-ASA method. To check the sensitivity of our results to the parameters of calculations we used different exchange-correlation potentials and inputs with different radii of the B sphere (both with and without empty spheres). The relevant partial contributions to in MgB2 and AlB2 are listed in Table 1. One can see that in MgB2 all orbitals on the B site have a sizeable DOS, while in AlB2 only orbital has a large DOS with . The component in AlB2 becomes relatively more important compared to MgB2 resulting in the dominance of the Fermi-contact mechanism of NSLR, as we will show below. In both materials the contribution of states to NSLR is very small. As for the Mg site, the component of is the most important, and we expect that NSLR for the Mg nucleus is dominated by the Fermi-contact mechanism. However, below we will focus on the 11B NSLR, because of the boron role in SC.
| MgB2 | 3.4 | 50 | 36 |
|---|---|---|---|
| AlB2 | 3.3 | 19 | 1.9 |
To calculate according to a general prescription one has to estimate the values of for different and the electronic density at the nucleus . We found that the convergence of the total NSLR rate with respect to the boron sphere radius in this system is worse compared to metals (from to the total decreases by 15%). The uncertainty is mostly related to the value of .
In our calculations we used the largest that were possible without a significant distortion of the band structure, 2.4 for MgB2 and 2.1 for AlB2. For these radii we have in MgB2 and 1.37 in AlB2. For comparison, the atomic value [37] for in B is 0.78. The electronic densities on the nucleus for MgB2 and AlB2 were, respectively, 2.68 and 3.02.
The contributions to the 11B relaxation rate for the polycrystalline sample calculated using the general formulas [35] are given in Table 2. The in-plane and out-of-plane orbitals in MgB2 have similar DOS, and hence the relative magnitude of orbital and dipolar contributions to NSLR is close to the 3/10 rule for states in a cubic crystal described by Obata [35]. The Fermi-contact contribution is also important and amounts to 40% of the orbital term. The contributions from the partial waves to the dipole and orbital relaxation rates are small (at the order of 1%) due to the low diagonal and off-diagonal densities of states and . The quadrupole contribution to NSLR is negligible due to the rather small 11B quadrupole moment.
| Contact | Orbital | Dipole | Total | Enhanced | Experiment | |
|---|---|---|---|---|---|---|
| MgB2 | 12 | 30 | 9 | 51 | 81 | 56 [31], 64 [32], 61 [33] |
| AlB2 | 21 | 1 | 1 | 23 | 26 | — |
The values of obtained in such manner correspond to the theoretical ‘bare’ partial boron whereas the actual contains different terms enhanced according to the corresponding susceptibilities. To estimate the possible range of enhancement, we calculated the total enhancement coming from the spin susceptibility only (which is the case for AlB2). We estimated the effective Stoner exchange parameter eV from the splitting of the bands at the point in the external magnetic field. The corresponding Stoner enhancement of the uniform spin susceptibility in the 3D case may be written [38] as with , while in the 2D case the enhancement is described by the same formula with . In our case due to the mixed 2D and 3D character of the bands it is not clear what value of should be used, but the difference in the result for and 2.0 is less than 10%. We used resulting in the enhancement of by approximately 60% (Table 2). The obtained ‘bare’ and enhanced values provide a range of possible NSLR rates for MgB2 which should be compared with the experimental rates [31-33] of (56–64) (Ksec)-1. The fact that such simple estimate may give a faster relaxation compared to experiments suggests a possible importance of unique effects resulting in the lowering of the effective boron .
The roles of the three NSLR mechanisms are very different in AlB2 where no experimental data are available. According to our theoretical estimation, due to the sharp decrease of the boron component of compared to MgB2 and its very strong anisotropy (see Table 1), the orbital and dipolar contributions to NSLR become very small, and the NSLR in AlB2 is completely dominated by the Fermi-contact mechanism. This conclusion may be verified experimentally by studying the Korringa ratio. The resulting Stoner-enhanced NSLR rate in AlB2 is more than three times smaller than in MgB2 (see Table 2).
We also calculated the NSLR rate in Mg1-xAlxB2 in the rigid band approximation with MgB2 bands. From Fig. 9 one can see how the roles of different mechanisms of NSLR change with doping. The sharp decrease of in the 2D sheets of the Fermi surface with doping [19] leads to the corresponding lowering of all contributions to NSLR, and at the point of the complete filling of these 2D bands we expect a very large . Experimental verification of this sharp dependence of on doping in this alloy may be a crucial test of our understanding of the electronic structure of this system and is highly desirable. Together with the nuclear quadrupole resonanse data (which is related to the anisotropy of total charges on different orbitals) such measurements should help to build a general picture of the anisotropy of orbitals.
The above calculations have been done for a polycrystalline sample. Because single crystals are becoming available, we include our estimations of the anisotropy in the angular dependence of NSLR rate [35] . For MgB2 we obtained , so that the NSLR is nearly isotropic. The NSLR rate in AlB2 is isotropic because it is determined by isotropic Fermi-contact mechanism.

Summarizing the results of this Section, the orbital NSLR mechanism dominates over the spin-dipolar and Fermi-contact ones in MgB2, because the boron orbitals at the Fermi level are distributed nearly isotropically and have a large DOS. Strong anisotropy and low density of states at the Fermi level in AlB2 results in the dominance of the Fermi-contact mechanism. With the values of 0.7 (0.5) st./eV for the bare total (boron partial) DOS at the Fermi level for MgB2 and 1.7 eV for the effective Stoner exchange parameter, reasonable agreement is obtained with the experimental NSLR rates. In addition, the NSLR rate strongly depends on the concentration in the Mg1-xAlxB2 system, and the experimental studies of this dependence are highly desirable for the understanding of the anisotropy of boron states. We note a relatively weak radial convergence of the NSLR rate in this system compared to the well studied metals, as well as a common uncertainty related to the estimate of the enhancement factor. However, these uncertainties do not affect our qualitative conclusions.
4 Electron-phonon coupling
Already in the first publication [18] following the discovery of SC in MgB2 the strength of the EPC was estimated and a qualitative suggestion that MgB2 is a standard BCS superconductor was made. Measurements of the B-isotope effect [40] on Tc, tunneling [41], transport [42], thermodynamic properties [43], and the phonon density of states [44] confirm that MgB2 is most likely an electron-phonon mediated -wave superconductor with intermediate or strong coupling.
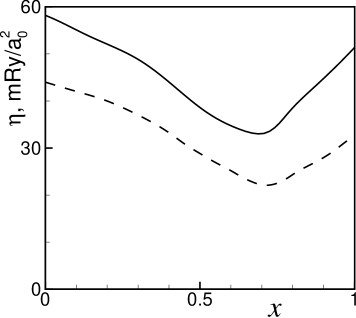
For the qualitative understanding below we use the simplest estimation (so-called rigid muffin-tin approximation) with the formalism of Ref. [45]. In this formalism the EPC constant is proportional to the Hopfield parameter [45]. To calculate one has to obtain the same complex off-diagonal density matrix at the Fermi level which enters the expressions for (see Section 3). In Fig. 10 we show the behavior of this parameter as a function of in Mg1-xAlxB2 in the rigid band approximation. Changes in are related to the changes in the electronic , and even neglecting the changes in the phonon frequencies the general behavior is consistent with the experimentally observed trend for in this alloy. The -point frequencies of the phonon mode obtained in our FLMTO calculation are 491 cm-1 in MgB2 and 956 cm-1 in AlB2. These frequencies are in reasonable agreement with other published data, as can be seen from Table 3. The biggest disagreement exists for the most sensitive and important mode where different calculations produced results ranging from 470 to 665 cm-1. The hardening of the mode with band filling should also contribute to the suppression of with Al doping. Still, in spite of the qualitative agreement with experiment and low anisotropy of in-plane and out-of-plane contributions to , the theoretical calculated in the rigid muffin-tin approximation is too low.
| Authors | E2g | B1g | A2u | E1u |
|---|---|---|---|---|
| Kortus [18] | 470 | 690 | 390 | 320 |
| Yildirim [9] | 486 | 702 | 402 | 328 |
| Kunc [46] | 535 | 695 | 400 | 333 |
| Present | 491 | 693 | 389 | 326 |
| Satta [20] | 665 | 679 | 419 | 328 |
| Kong [47] | 585 | 692 | 401 | 335 |
| Bohnen [48] | 536 | 692 | 394 | 322 |
It was suggested [26] that holes at the top of the B–B bonding bands may have strong coupling with the optical B-B bond-stretching mode. In Figs. 3c and 3d it is shown how these 2D cylindrical sheets of the Fermi surface breathe with such distortion (see also Ref. [25]). The displacements in Figs. 3c and 3d are (c) and (d) (positive displacement corresponds to boron atoms moving towards the centers of hexagons). The internal cylinder (green in Fig. 3a) falls below and is not seen. It is clearly seen that the bonding band also experiences strong interaction with the mode.
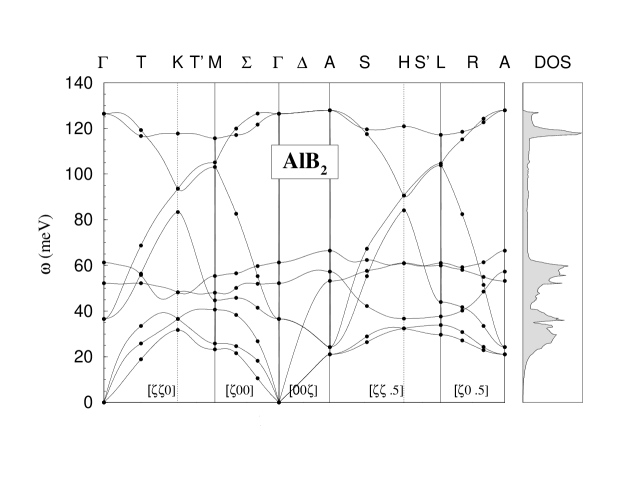
State-of-the-art calculation of linear response [47] produced , cm-1 and . The corresponding (from the solution of the Eliashberg equation on the real axis) is close to 40 K. The dominance of the – coupling via the optical bond-stretching mode was confirmed with the contributions from and bands to amounting to 0.62 and 0.25, respectively, and the estimated uncertainty of about 6%. The final conclusion is that the unusually high is due to the large caused by the presence of holes in the B–B bonding bands and by a relative softness of the mode. It was also concluded that MgB2 is a clear case of an intermediate-coupling -wave BCS superconductor. Other calculations [25, 9, 48] confirmed these conclusions. In Ref. [9] strong non-linearity of EPC was found and compared with the measured neutron data. To illustrate the difference between MgB2 and AlB2, in Fig. 11 we show the phonon spectra from Ref. [48] where and 0.43 were found for these systems.
In spite of the general agreement between the linear response and frozen phonon methods, it is unclear whether these perturbative techniques are adequate for such strong EPC. Unfortunately the detailed analysis of more sophisticated schemes of pairing [49, 10] lacks high accuracy of the linear response method even for this relatively simple material.

Experimental estimation of EPC is not always consistent with the picture above. If we assume that ‘bare’ LDA is essentially correct one can use several experiments to extract the strength of EPC. For instance, comparing from the specific heat measurements [50] with LDA ‘bare’ according to the relation one would obtain in the range of 0.53–0.62 (the LDA is [18-20, 26] (eVf.u.)-1). With such an unusually low parameter should be used to reproduce the experimentally observed . In addition, recent experiments [51] revealed no changes in the frequency of the phonon when the system goes through the SC transition. The analysis of the parameters and suggests [50] extremely weak coupling, and the thermoelectric power data [52] cannot be fit with the LDA . These controversies leave a question whether the electron pairing in MgB2 is phonon-mediated relatively open. We should stress that there is a large disagreement between different measurements. For example, the experimental data [43] for the specific heat range from 1.1 to 5.5 mJ mol-1 K-2. Analyzing extracted from NMR data (see Section 3) one can find that the LDA partial boron should be lowered by 10–15% to comply with the measurements. With such correction for the total the corrected can easily be equal to 0.8. Thus, a lower is required to make a satisfactory interpretation of these two experiments. At present the reasons for lowering of are unclear. In any case the application of many-body techniques (GW or others) to this material should be valuable.
5 Dielectric function and reflectivity
Since optical properties reflect the electronic structure of a system, it is of interest to interpret the main features of the optical spectra in terms of the electronic transitions in the studied materials. Here we are dealing with the optical properties as expressed by the frequency-dependent dielectric function associated with direct interband transitions.
The imaginary part in the random phase approximation (RPA) with the LMTO basis set is [53]:
where and are the eigenvalues for bands and , respectively, and is the occupation number at zero temperature. For AlB2 structure, there are two independent components for c and c.
The complex index of refraction is given by
and the normal incidence reflectivity if defined by the Fresnel equation
We calculated the optical response for both polarizations. The tetrahedron method was used for the Brillouin zone integrations using 512 irreducible points. The real part was obtained from by the Kramers-Kronig relation. The functions were calculated up to 25 eV, which is well above the main peak of . Also, both in MgB2 and AlB2 there are partially filled bands, and therefore, one should take into account the intraband, or Drude, term. The plasma frequency in the Drude term is calculated from the average square of the Fermi velocity (see Section 2), and the scattering rate was obtained from the experimental data on resistivity in the normal state. This procedure is quite standard and was used for different metals including high- superconductors [54, 55]. Since we have no accurate ellipsometric measurements of the dielectric function for these materials, our results should be considered as a prediction.
Fig. 12 shows the interband contributions to for eV for both materials and both polarizations. Also, we show the partial band-to-band contributions to the imaginary part of the dielectric tensor for all significant transitions.

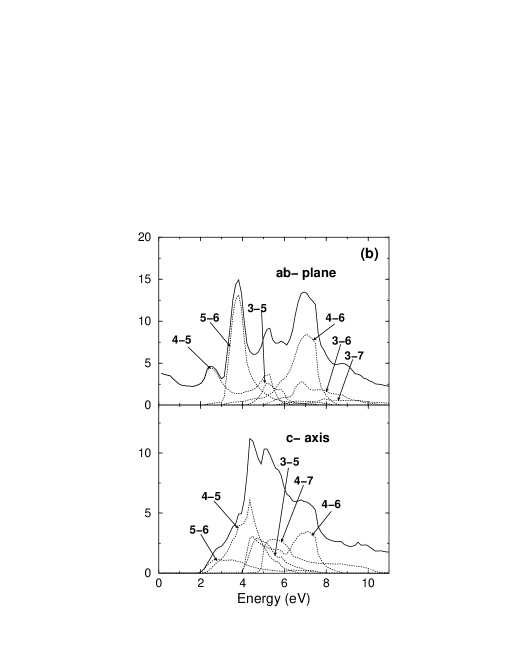
Both c and c components are very anisotropic and quite different for both materials. In MgB2, the function exhibits a structure with two broad peaks in c. The maximum at 2.5 eV corresponds to the transitions between the 4-th and 5-th bands mostly around the –M direction at the Brillouin zone (see Fig. 1). The second maximum at about 8 eV is related to the 46 transitions related to the H–A direction where these bands contain extended nearly parallel parts. For the polarization c there is only one broad hump with several fine features which can be easily identified using the band-to-band transition analysis (Fig. 12a). The sharp peak at 5 eV is related to the 45 transitions from narrow region around H–A direction where these bands are also nearly parallel.
In AlB2 (Fig. 12b) the two main peaks for the polarization are related to the 56 (3.8 eV peak) and 46 (7 eV peak) transitions, respectively. For the polarization there is (like in MgB2) a single broad hump with the maximum at about 4.2 eV and with several noticeable features that are easily identifiable.
There are two main differences between the MgB2 and AlB2 interband spectra. First, we notice that there is a low-energy peak (0.7 eV) in MgB2 which is absent in AlB2. This peak is related to the transitions between bands 3 and 4 in the H-A direction. The difference of energies for these two bands is very low in this direction. In MgB2 these bands cross the Fermi level while in AlB2 they are both below the Fermi energy, i.e., this peak does not appear.
Second, the absolute values of are higher in AlB2 compared to MgB2 in all the considered energy interval and for both polarizations. The analysis of the joint density of states (which is equal to when all matrix elements are set to unity) shows that it is related to larger matrix elements in AlB2. The reason for such behavior is unclear, and it is necessary to perform a detailed analysis of the wave functions for the bands surrounding the Fermi energy.
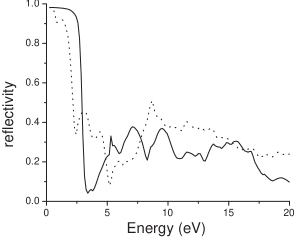
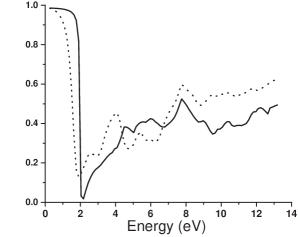
The reflectivity spectra for MgB2 and AlB2 are shown in Fig. 13. These spectra are anisotropic. For MgB2 the anisotropy of the plasma frequency is not very high (= 6.5 eV, =7.02 eV). However, the anisotropy of the reflectivity spectra is high even in the low-energy region due to interband transitions. For example, for the polarization there is a feature at eV corresponding to the peak of the interband part of at eV (Fig. 13). We believe that this structure can be observed in the reflectivity measurements. AlB2 does not have this low-energy peak, and therefore the behavior of the reflectivity at the energies below 2 eV is rather smooth.
The studies of the general dielectric function and analysis of collective charge excitations for MgB2 appeared recently in Ref. [56].
6 Conclusion
We showed that the electronic structure of Mg1-xAlxB2 has both similarity with and notable differences to GIC’s. Its peculiar features include holes at the top of the bands, coexistence of metallic and covalent bonding, and smooth disappearance of the 2D character in the electronic structure with Al doping. We emphasize how new NMR and optical experiments may provide a direct test of validity of these theoretical predictions. The presented results provide a basis both for further studies of normal and SC states of MgB2 and for the search of new SC compounds. Such studies are likely to be very complicated due to the fact that MgB2 seems to be a unique superconducting compound among the family of structurally similar materials with no or very low- SC. It is unlikely that an analog to the high- family of materials can be found in the case of MgB2. Nevertheless, the relative simplicity of this compound makes the development of new computational schemes with realistic electron-phonon coupling very attractive.
The authors acknowledge useful discussions with F. Borsa, S. Bud’ko, P. Canfield, I. Mazin and N. Zein. This work was carried out at the Ames Laboratory, which is operated for the U.S. Department of Energy by Iowa State University under Contract No. W-7405-82. This work was supported by the Director for Energy Research, Office of Basic Energy Sciences of the U.S. Department of Energy.
References
- [1] J. Nagamatsu, N. Nakagawa, T. Muranaka, Y. Zenitani and J. Akimitsu, Nature 410, 63, 2001.
- [2] J.S. Slusky et al., Nature 410, 343 (2001).
- [3] T. Takenobu et al., cond-mat/0103241; Y.G. Zao et al., cond-mat/0103077; S. Xu et al., cond-mat/0104534.
- [4] J.K. Burdett and G.J. Miller, Chem. Mater. 2, 12 (1989).
- [5] N.B. Brandt, S.M. Chudinov and Ya.G. Ponomarev, Modern problems in Condensed Matter Sciences, Vol. 20.1 (North-Holland, Netherlands, 1988).
- [6] I.T. Belash, A.D. Bronnikov, O.V. Zharikov and A.V. Pal’nichenko, Synth. Met. 36, 283 (1990).
- [7] H. Urayama, H. Yamochi, G. Saito, K. Nozawa, T. Sugan, M. Kinoshita, Chem. Lett. 1988, 55 (1988).
- [8] K. Tanigaki, T.W. Ebbesen, S. Saito, J. Muzuki, J.S. Tsai, Y.Kubo, and S.Kuroshima, Nature 352, 222 (1991).
- [9] T. Yildirim et al., cond-mat/0103469.
- [10] A.S. Alexandrov, cond-mat/0104413.
- [11] S. Lee, H. Mori, T. Masui, Yu. Eltsev, A. Yamamoto and S. Tajima, cond-mat/0105545.
- [12] I.I. Tupitsyn, Sov. Phys. Solid State 18, 1688 (1976).
- [13] D.R. Armstrong and P.G. Perkins, J.C.S. Faraday II, 75, 12 (1979).
- [14] D.R. Armstrong, A. Breeze and P.G. Perkins, J.C.S. Faraday II, 73, 952 (1977).
- [15] A.J. Freeman, A. Continenza, M. Posternak and S. Massidda, in Surface Properties of Layered Structures, ed. G. Benedek (Kluwer, Netherlands, 1992).
- [16] H.J.F. Jansen and A.J. Freeman, Phys. Rev. B 35, 8207 (1987).
- [17] A.I. Ivanovskii and N.I. Medvedeva, Russ. J. Inorg. Chem. 45, 1234 (2000).
- [18] J. Kortus, I.I. Mazin, K.D. Belashchenko, V.P. Antropov and L.L. Boyer, Phys. Rev. Lett. 86, 4656 (2001).
- [19] K.D. Belashchenko, M. van Schilfgaarde and V.P. Antropov, cond-mat/0102290.
- [20] G. Satta et al., cond-mat/0102358.
- [21] M. Methfessel, M. van Schilfgaarde and R.A. Casali, in: Electronic Structure and Physical Properties of Solids: The Uses of the LMTO Method, Lecture Notes in Physics, Vol. 535, ed. H. Dreysse (Springer-Verlag, Berlin, 2000).
- [22] O. Gunnarsson, Rev. Mod. Phys. 69, 575 (1997).
- [23] W.A. Harrison, Electronic Structure and the Properties of Solids (Freeman, San Francisco, 1980).
- [24] E. Nishibori, M. Takata, M. Sakata, H. Tanaka, T. Muranaka and J. Akimitsu, cond-mat/0105555.
- [25] A.Y. Liu et al., cond-mat/0103570.
- [26] J. An and W. Pickett, Phys. Rev. Lett. 86, 4366 (2001).
- [27] E. Sirtl and L.M. Woerner, J. Cryst. Growth 16, 215 (1972).
- [28] I.T. Belash, A.D. Bronnikov, O.V. Zharikov and A.V. Pal’nichenko, Solid State Comm. 69, 921 (1989).
- [29] M. Worle, R. Nesper, G. Mair, M. Schwarz and H.G. von Schnering, Z. Anorg. Allg. Chem. 621, 1153 (1995).
- [30] A. Catellani, M. Posternak, A. Baldereschi, H.J.F. Jansen and A.J. Freeman, Phys. Rev. B 32, 6997 (1985).
- [31] H. Kotegawa, K. Ishida, Y. Kitaoka, T. Muranaka, J. Akimitsu, cond-mat/0102334.
- [32] A. Gerashenko, K. Mikhalev, S. Verkhovskii, T. D’yachkova, A. Tyutyunnik, V. Zubkov, cond-mat/0102421.
- [33] J.K. Jung, S.H. Baek, F. Borsa, S.L. Bud’ko, G. Lapertot, P.C. Canfield, cond-mat/0103040.
- [34] K.D. Belashchenko, V.P. Antropov and S.N. Rashkeev, cond-mat/0105356.
- [35] Y. Obata, J. Phys. Soc. Japan 18, 1020 (1963); A. Narath, Phys. Rev. 162, 320 (1967); T. Asada and K. Terakura, J. Phys. F 12, 1387 (1982).
- [36] V.P. Antropov et al., Phys. Rev. B 47, 12373 (1993).
- [37] S. Fraga, K.M.S. Saxena and J. Karwowski, Handbook on atomic data (Elsevier, Amsterdam, 1976).
- [38] B.S. Shastry and E. Abrahams, Phys. Rev. Lett. 72, 1933 (1994).
- [39] E. Pavarini and I.I. Mazin., cond-mat/0105350.
- [40] S.L. Bud’ko, G. Lapertot, C. Petrovic, C. Cinningham, N. Anderson and P.C. Canfield, cond-mat/0101463.
- [41] A. Sharoni et al., cond-mat/0102325.
- [42] C.U. Jung et al., cond-mat/0102215; S.L.Bud’ko et al., cond-mat/0102413.
- [43] S. Bud’ko et al., Phys. Rev. Lett. 86, 1877 (2001); R.K. Kremer et al., cond-mat/0102432; C. Marcenat et al. (to be published); C. Walti et al., cond-mat/0102522.
- [44] T.J. Sato et al., cond-mat/0102468; R. Osborn et al., cond-mat/0103064.
- [45] I.V. Mazin, S.N. Rashkeev and S.V. Savrasov. Phys.Rev.B 42, 366 (1990).
- [46] K. Kunc et al., cond-mat/0105402.
- [47] Y.Kong et al. cond-mat/0102499.
- [48] K.-P. Bohnen et al., cond-mat/0103319.
- [49] J.E. Hirsch and F. Marsiglio, cond-mat/0102479.
- [50] F. Bouquet et al., cond-mat/0104206.
- [51] H. Martinho et al., cond-mat/0105204.
- [52] E.S. Choi et al., cond-mat/0104454.
- [53] M. Alouani, L. Brey, and N.E. Christensen, Phys. Rev. B 37, 1167 (1988), and references therein.
- [54] S.N. Rashkeev, Yu.A. Uspenski and I.I. Mazin., Sov.Phys. – JETP 61, 1004 (1985).
- [55] E.G. Maksimov, S.N. Rashkeev, S.Yu. Savrasov, Yu.A. Uspenski, Phys. Rev. Lett. 63, 1880 (1989).
- [56] W. Ku et al., cond-mat/0105389; V.P. Zhukov et al., cond-mat/0105461.