[
Ge-substitutional defects and the 33 transition in –Sn/Ge(111)
Abstract
The structure and energetics of Ge substitutional defects on the -Sn/Ge(111) surface are analyzed using Density Functional Theory (DFT) molecular dynamics (MD) simulations. An isolated Ge defect induces a very local distortion of the 33 reconstruction, confined to a significant downwards displacement (-0.31 Å) at the defect site and a modest upward displacement (0.05 Å) of the three Sn nearest neighbours with partially occupied dangling bonds. Dynamical fluctuations between the two degenerate ground states yield the six-fold symmetry observed around a defect in the experiments at room temperature. Defect-defect interactions are controlled by the energetics of the deformation of the 33 structure: They are negligible for defects on the honeycomb lattice and quite large for a third defect on the hexagonal lattice, explaining the low temperature defect ordering.
pacs:
PACS numbers: 73.20.-r, 73.20.At, 71.15.Nc, 71.15.Pd]
The driving force behind the T-induced reversible phase transition observed for 1/3-ML coverage of Sn or Pb on Ge(111) has been under intense debate since its discovery in Pb/Ge(111)[1]. After the early suggestions of surface Fermi wavevector nesting or electron correlations, leading to the formation of a Charge Density Wave [1, 2] at low T, recent theoretical work indicates that the softening of a 33 surface phonon[3], associated with the electronic energy gain due to the Sn dangling bond (DB) rehybridization, plays a major role on this transition. The dynamical fluctuations model[4] associated with this soft mode provides a consistent account of the main experimental facts, in particular the similarities and differences between the isovalent Sn/Ge and Sn/Si(111) systems[3].
DFT calculations for the –Sn/Ge(111) surface predict that the ground state is a 33 reconstruction in which 1/3 of the Sn adatoms are placed 0.3 Å higher than the other Sn adatoms [3, 4, 5, 6]. In other words, out of the three 33 sublattices that form the lattice [10], “up” Sn adatoms () occupy one of these sublattices (say ), forming a 33 hexagonal lattice, while sublattices are occupied by ‘down’ Sn adatoms () (forming a honeycomb pattern). These calculations also show that this reconstruction is correlated with a change in the surface electronic structure[5]: the –DB is now fully occupied while the other two –DBs share the remaining electron per 33 unit cell. STM experiments are naturally explained in terms of these different DB occupancies. At LT, below , filled-state STM images show the 33 phase : bright spots occupy the 33 sublattice associated with the –DBs, while the other two sublattices, associated with the –DBs, are occupied by darker spots[7]. At RT,however, dynamical fluctuations of the Sn adatom heights, fast with respect to the STM scan speed, induce a periodicity in the STM images.
While these models assume an ideal 1/3-ML Sn surface coverage, point defects, with an average concentration of 31 % [10], are always present. 90 % of these defects are Ge substitutionals (called Ge defects in the rest of the paper), while vacancies account for the other 10 %. STM, a real-space experimental technique, has been the method of choice to get non-averaged information on the structure and distribution of these defects on Sn/Ge(111)[8, 9, 10] across a wide temperature range, covering the transition temperature . Three are the main experimental results: (i) At RT Ge defects are imaged as dark spots in the lattice surrounded by six features (brighter than Sn adatoms away from defects) that correspond to the six nearest-neighbours (n.n.) Sn atoms. (ii) At LT most of the Ge defects occupy positions corresponding to the two honeycomb –sublattices , with equal probability, and are therefore surrounded by three bright and three darker Sn n.n. (iii) At RT Ge defects are randomly distributed over the three sublattices .
These results have been considered as supporting evidence for an interpretation of the 33 phase transition in terms of the interaction of the Ge defects[8, 9, 10]. One of the main ingredients in this argument is the six-fold symmetry assumed for the perturbation induced by an isolated defect. This six-fold symmetry (honeycomb, with one atom dark and two atoms bright in the three possible sublattices), suggested by the RT STM images, is, however, in contradiction with the hexagonal pattern (two atoms dark and one atom bright, with three-fold symmetry) observed in the filled-state images below . In order to explain the LT experimental results, a defect-defect interaction, with a temperature dependent decay length (e.g. 11 Å, 100 Å) has to be introduced. This long–range interaction would be responsible for the ordering of defects at LT on two of the three possible sublattices. Finally, the superposition of the perturbations induced by defects in these two sublattices would give rise to the 33 phase.
In this letter, we show that ab initio DFT-LDA MD simulations of Ge substitutional defects on the Sn/Ge(111) surface support a completely different point of view: Both the structure and the ordering of the Ge defects at LT are induced by the ground state 33 reconstruction. In particular, we have studied the atomic geometry, the electronic structure and the energetics of one and two Ge defects in a large 99 unit cell. In the case of two defects, we have considered three cases, corresponding to the defects on first, second and third n.n. positions. Our analysis shows that Ge defects at LT always create a three-fold distortion around them, the simulated STM filled-states image showing three bright and three darker spots on the n.n. Sn atoms. The distortion is very local, affecting only to the Sn atoms which are nearest neighbours of the defects. We have also performed first-principles MD simulations of a 33 unit cell with one Ge defect. Our MD simulations indicate that the six-fold pattern observed around Ge defects in the RT STM images should be understood in terms of the RT dynamical fluctuations of the six n.n. Sn adatoms. These dynamical effects contribute, together with structural and electronic effects, to the enhanced brightness of the Sn atoms around the defect.
In our approach we calculate different defects using a Sn/Ge(111)-99 unit cell with a slab of 4 Ge layers and a layer of H atoms saturating the dangling bonds of the deeper Ge layer (432 atoms in the unit cell). Both the H layer and the last Ge layer are kept fixed during the calculations to mimic the bulk continuation. In our calculations we have used an efficient MD technique, the Fireball96 code [12], that allows us to analyze the large 99 unit cell we have considered. We have checked that this code yields accurate surface geometries by comparing it with a plane wave code (CASTEP)[11] for the case of the Sn/Ge(111)-33 reconstruction[5] and for the case of one Ge defect on a 33 surface unit cell (see Table I). These results confirm the quality of the calculations provided by the Fireball96 code and justify the wide use we are going to make of it in the rest of the paper. STM images are calculated from the ab-initio electronic structure of the surface using the Keldysh-Green function formalism and considering a W tip (for details on the method and the application to the Sn/Ge(111)-33 system see ref. [7]).
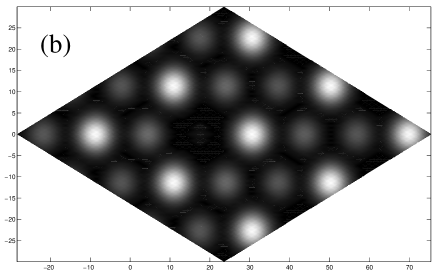
Figure 1a shows the relaxed geometry obtained in our calculations for the –Sn/Ge(111) surface with one Ge defect per 99 unit cell (3.7 % concentration). The surface presents the 33 reconstruction with the Ge adatom on one of the two 33–sublattices (say ) that form the honeycomb pattern associated with adatoms. Our simulations yield for the Ge substitutional a downwards displacement of 0.30 Å with respect to the original position. The perturbation induced by the Ge defect is well-localized, affecting only to the three n.n. adatoms ( sublattice). These adatoms are displaced upwards 0.05 Å due to the transfer of charge from the Ge defect: the Ge–DB is empty and each n.n. –DB gains 1/6 electrons. The occupancy of the n.n. –DBs ( sublattice) does not change (they are already fully occupied), and therefore their position is practically the same as in the 33 reconstruction free of defects. Figure 1b shows the calculated filled-state STM image for this geometry. Probably the most remarkable feature is the three-fold symmetry of the image around the defect (only three of the surrounding Sn atoms are imaged as protrusions), in contrast with the six-fold symmetry assumed for the perturbation induced by the defect from the experimental RT STM images.
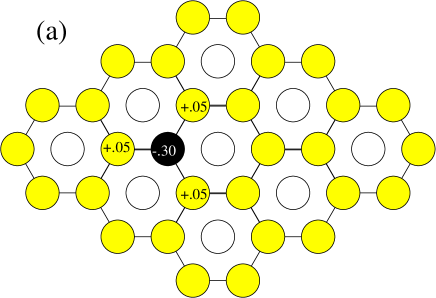
Notice that the solution shown in fig. 1 is two-fold degenerate: an equivalent solution is obtained applying a symmetry operation that exchanges the two sublattices occupied by the up and down Sn. This degeneracy will be important when discussing the effect of temperature on the surface geometry and its corresponding STM image.
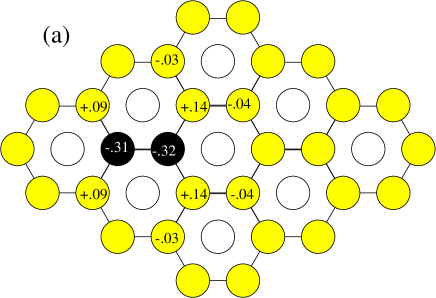
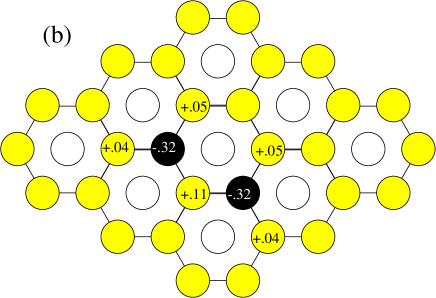
Figures 2a,b,c display the relaxed adatom positions we have obtained for the –Sn/Ge(111)–99 surface with two defects on first, second and third n.n. positions. In all the cases the 33 reconstruction adapts its particular geometry (out of a three-fold degenerate case) to the defect positions, in such a way that the two defects are placed on the two –sublattices forming a honeycomb pattern. When the Ge defects are second n.n. (fig. 2b) they are on the same sublattice (say ), and the ground state is two-fold degenerate: an exchange of the and sublattices gives a completely equivalent solution. In fig. 2a and 2c the Ge defects occupy different sublattices and the solution is non-degenerate. As in the case of an isolated defect, the perturbation induced by the defects is localized essentially on the Sn-adatoms n.n. to the defects. The total energy for the three cases shown in fig. 2 is, within the accuracy of these calculations ( meV/99 unit cell), the same, confirming the localized nature of the distortion induced by the Ge defects. It is remarkable that the sum of the upward displacements of all the neighbouring Sn-adatoms is, in the three cases, very similar to the sum of the displacements induced by two independent defects ( 0.30 Å, see fig. 1a). This result suggests a roughly linear relationship between the upwards displacement of a Sn adatom and the transfer of charge to its DB.
Coming back to the experimental STM data for the Ge defects on the Sn/Ge(111) surface, we first notice that our solution for a single defect (fig, 1b) has a three-fold and not a six-fold symmetry, with the Sn atoms around the defect presenting two different types of displacements perpendicular to the surface.This apparent contradiction with the experimental data at RT can be resolved, however, considering the dynamics of the atoms around the defect. To this end, we have considered a 33 unit cell with a single substitutional and performed MD simulations at two different temperatures, T= 180 K and T= 270 K. The initial conditions correspond to the positions of the relaxed structure of the defect (see Table I) and random velocities following a Maxwell-Boltzmann distribution. Then we follow the time evolution of the system integrating the equations of motion with the forces obtained from the DFT-LDA calculations. Figure 3 shows the time evolution of the -coordinate of the three upper atoms (two Sn atoms and the Ge susbstitutional). These results show that Ge remains around its equilibrium site, while the two Sn atoms tend to exchange heights, very much in similarity with what we found for the structure [4]. Therefore, the RT STM images of the six Sn–adatoms n.n. to a Ge defect must represent a 50 % average of and (displaced upwards 0.05 Å w.r.t. normal –adatoms, and containing 1/6 electrons more), while the RT STM images of Sn–adatoms away from defects represent a 1/3 + 2/3 average. This dynamical (plus charge transfer) effect explains in a simple way the different pattern observed at RT and LT on the STM images around a Ge defect (six-fold vs. three-fold symmetry) and also explains why Sn–adatoms n.n. to a Ge defect appear on the RT STM images brighter than Sn–adatoms in regions free of defects.

We finally address the following question: why do Ge defects at LT occupy preferentially two 33–sublattices, with equal probability, and not the three of them or only one?. Our results show that, on the –Sn/Ge(111) surface, Ge substitutional defects transfer their DB charge to neighbouring Sn-adatoms DBs and do not participate in the up/down dynamical fluctuations of the Sn–adatoms at RT. Our results also show that at LT, when these fluctuations are supressed, the stable configuration of the surface is a 33 reconstruction in which Ge defects occupy positions; the defect-defect interaction is negligible (as long as they stay on sublattices) and Ge defects occupy with equal probability any of the two sublattices.


A third Ge defect initially located in the other sublattice (hexagonal) should be forced, when the temperature is lowered, either to present an upward displacement (contrary to what it does when it is isolated) or to deform dramatically its environment in order to move downwards. Any of these solutions would imply a significant energy cost (160 meV for the defect in an upper position according to our calculations), that the system prefers not to pay, locking in all the substitutionals in a honeycomb lattice. We conclude that the ordering of Ge defects at LT is induced by the ground state 33 reconstruction and not the other way around: Ge substitutional defects are not the driving force of the 33 transition in the –Sn/Ge(111) surface.
In conclusion, our DFT-LDA total-energy and MD calculations show that the ground state geometry around a Ge substitutional defect corresponds to a very local distortion of the 33 reconstruction of the defect-free surface, confined to the defect site and the Sn nearest neighbours. The lattice deformation can be characterized by a downwards displacement of the Ge defect and upward displacement of the neighbouring Sn atoms with partially occupied DBs, with respect to the ideal 33 structure. This structural effect is correlated with the charge transfer from the defect DB to the DBs of these Sn atoms. This ground state configuration provides, at LT, an STM image with a three-fold symmetry, while at high T, the dynamical fluctuations between the two degenerate states (with different Sn atoms in the upper positions) would yield the six-fold symmetry observed in the experiments. These dynamical effects, together with the upward displacement and the increased DB occupancy, are responsible of the enhanced brightness of the Sn atoms around the defect. Finally, the ordering of Ge defects at LT is naturally explained as an effect of the 33 reconstruction.
This work has been partly funded by the spanish CICYT under contract No.PB-97-0028. Part of the calculations have been performed in the CCC-UAM.
REFERENCES
- [1] J.M. Carpinelli et al., Nature 381, 398 (1996).
- [2] J.M. Carpinelli et al., Phys. Rev. Lett. 79 , 2859 (1997).
- [3] R. Pérez, J. Ortega and F. Flores, Phys. Rev. Lett. 86, 4891 (2001).
- [4] J. Avila et al., Phys. Rev. Lett. 82, 442 (1999).
- [5] J. Ortega, R. Pérez and F. Flores, J. Phys.: Condens. Matter 12, L21 (2000).
- [6] S. de Gironcoli et al., Surf.Sci. 454-456, 172 (2000)
- [7] L.Jurczyszyn, J.Ortega, R. Pérez, and F. Flores. Surf. Sci. 482-5, 1350 (2001).
- [8] A. Melechko et al., Phys. Rev. Lett. 83, 999 (1999).
- [9] H.H. Weitering et al., Science 285, 2107 (1999).
- [10] A. Melechko et al., Phys. Rev. B 61, 2235 (2000).
- [11] L.J. Clarke, I. Stich and M.C. Payne, Comp. Phys. Comm. 72, 14 (1992).
- [12] A. A. Demkov J. Ortega, O.F. Sankey and M.P. Grumbach, Phys. Rev. B 52, 1618 (1995); O.F. Sankey and D.J. Niklewski, Phys. Rev. B 40, 3979 (1989).