[
Electrical Conductivity of Lithium at Mbar Pressures
Abstract
We report measurements of the electrical conductivity of a liquid alkali metal - lithium - at pressures up to 1.8 Mbar and 4-fold compression, achieved through shock compression experiments. We find that the results are consistent with a departure of the electronic properties of lithium from the nearly free electron approximation at high pressures.
pacs:
PACS numbers: 72.15.-v, 62.50.+p, 71.22.+i] At one atmosphere lithium is the archetype of a “simple” metal, i.e. one in which the electronic valence states are well separated energetically from the tightly bound core states. It has been known for a long time that its electronic properties at these ambient conditions are well described within the nearly free electron picture [2], which is a cornerstone of the theory of simple metals. While it has been generally assumed that increased pressure would only improve the accuracy of this description, in recent years theoretical calculations suggested that the opposite may be true [3]. This has culminated very recently with the striking prediction that lithium, long viewed as the simplest of all metals, exhibits at Mbar pressures a paired ground state with a semiconducting or insulating character [4]. The ensuing experimental work has provided results on the decrease of optical reflectivity upon compression [5, 6], on the increase of the electrical resistivity [7] with pressure up to 0.6 Mbar, and on the existence of symmetry-breaking structural transitions around 0.5 Mbar [8], all in broad agreement with this prediction. It is perhaps worth noting that even before the nearly free electron model was proposed, Bridgman’s high pressure experimental work showed that the resistivity of lithium increases with pressure, both in the solid and in the liquid [9]. Here we report measurements of the electrical resistivity of lithium at pressures up to 1.8 Mbar, achieved through shock compression experiments. The results are consistent with a departure of the electronic properties of lithium from the nearly free electron approximation at high pressures, and with ionic pairing correlations in the Mbar regime ().
We measured the electrical resistance of high purity lithium samples quasi-isentropically compressed starting from the solid with density at room temperature and . The quasi-isentropic compression was achieved through multiple reflections of a shock wave [10] between two sapphire single-crystals which encapsulate the lithium sample. The initial shock wave was generated by the impact of Al or Cu projectiles moving at to onto the experimental cell (target) containing the samples. The targets were specifically designed to create and maintain steady state conditions at the final pressure for time durations exceeding , during which the measurements were taken.
Due to the extreme reactivity of lithium, the experimental cells were assembled inside an Ar atmosphere glove-box, and designed to be hermetically sealed after assembly. Pre-shock sample resistances were within of the ideal room temperature values and were monitored continuously after the targets were removed from the controlled environment to ensure that the sample quality did not degrade. In order to increase the electrical resistance and better control current flow, we used parallelipipedic samples with dimensions and thicknesses varying between and . The and bigger aspect ratios used insured that lateral rarefaction effects were minimal.
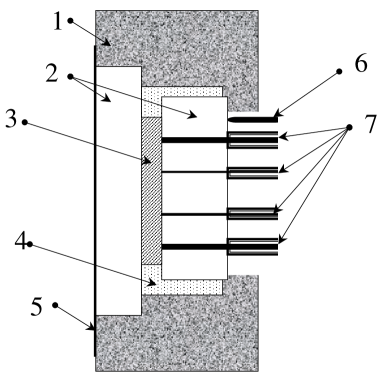
The electrical resistance of the lithium samples was measured using a four probe technique, which virtually eliminates the need for the contact resistance correction. The electrodes were gold-plated, oxygen-free Cu wires, inserted through the back sapphire anvil, see Fig.1. The diameter and positioning of the outer electrodes were optimized in order to provide uniform current injection into the lithium sample, and to minimize the contact resistance and distortions of the pressure profile in the measurement region. The voltage probes - inner electrodes - were very thin and placed apart as needed to maximize the sample resistance and the accuracy of the voltage measurements. Special attention was given to the soldering process and shielding of the electrodes in order to improve the signal-to-noise ratios. Triggering of the data acquisition system was provided by time-of-arrival shock sensors placed outside the sample space in order to eliminate any interference with the measurements. The details of the electronic circuitry used in these experiments are similar with the ones described in [11].
The sample pressures at final, steady-state conditions were determined with accuracy from the measured projectile velocity using the shock impedance matching technique [12]. The time dependence of the pressure during compression was calculated using a one-dimensional hydrodynamic code in which the projectile and shock-anvils were modeled by Mie-Gruneisen equations of state (EOS) [13]. The EOS for the lithium sample was obtained by least-squares fits of a ratio of polynomials to tabular data based on extensive shockwave and static compression experimental results [14]. We note that all the conductivity results reported in this paper are in the liquid region of the phase diagram. The densities and temperatures attained in the experiments range approximately from 2 to 4 times the normal density, and from to .
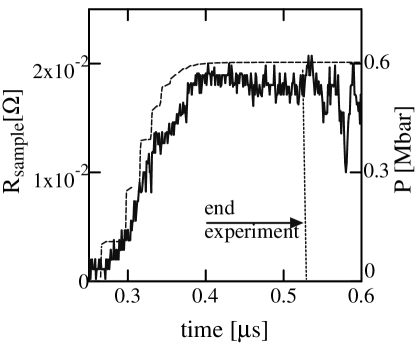
In the experiment we monitored the voltage drop across the lithium sample as the pressure increased and a known constant current was passed through, see Fig. 2. The accuracy in the current and voltage measurements was higher than and , respectively. The lithium electrical resistivity was determined from the sample resistance using , where the distance between the voltage probes was measured to precision. The cross-section of the sample, , was determined by the known width and calculated thickness , with a conservatively estimated precision of arising mainly from density uncertainties.

The measured electrical resistivity exhibits three main regimes as a function of pressure, see Fig. 3. Up to approximately and compression the electrical conductivity of lithium decreases steeply from its value at normal pressure to about at , which is consistent with increased scattering of the charge carriers in the compressed material. This regime is followed by a much slower variation of the conductivity with pressure, which extends to and almost compression. At even higher pressures, although the error bars overlap, the electrical conductivity appears to depart from the previous slow varying behavior.
In order to interpret the results we turn to the general framework provided by the electron-ion pseudopotential formalism and the Ziman conductivity theory [15]. The pseudopotential concept takes into account the near cancellation of the Coulombic interaction between the valence electrons and ions inside the core, due to orthogonality and exclusion effects. While generally non-local and energy dependent, in its most intuitive representation it is just a local potential [16]. Under the assumption of a weak pseudopotential the linear response theory applied to the uniform electron gas yields the total energy of the system and defines effective ion-ion and electron-ion interactions [17, 18].
The effective ion-ion pair potential is the sum of a direct Coulombic interaction, and an indirect contribution due to the polarization of the electrons,
| (1) |
| (2) |
| (3) |
and the screened electron-ion potential is,
| (4) |
| (5) |
where is the number of valence electrons per atom, is the static response function, is the bare electron-ion pseudopotential, is the Lindhard polarizability, is the static dielectric function and is the local field factor of the electron gas, accounting for the exchange and correlation effects between the electrons [18].
The electrical resistivity follows from the assumption of a degenerate electron gas and weak electron-ion scattering, yielding the Ziman formula [18, 19, 20]:
| (6) |
The deviations of the electronic density of states from the free electron values, due to the pseudopotential, are accounted for through the effective mass [21, 22, 23]; is the liquid-structure factor, , is the Fermi wavevector and is the Bohr radius.
As remarked in [4] the strongly non-local character of the pseudopotential generates significant deviations of the electronic structure from the free electron form at high densities, reflected in part in the decrease of the occupied bandwidth, i.e. increase of the effective mass. We note that, under suitable assumptions, Eq. 6 allows us to estimate the effective mass , by comparing with the measured experimental results. For the sake of simplicity and to gain additional insight (see below), we use the local empty core potential of Ashcroft [16], for and above . However, we do not expect that the use of a non-local potential for the calculation of the scattering integral will qualitatively alter the results [22]. Values of typical for lithium range from [19] to [24], depending on the local field correction employed. We use the homogeneous electron gas local field factor determined by diffusion Monte Carlo simulations [25], and find that reproduces the experimental values of the conductivity of liquid lithium close to its triple point [26] with an effective mass only slightly bigger than unity [22]. We also note that the normal pressure effective ion-ion potential so obtained compares favorably with other potentials that have been used to model liquid lithium [24]. The liquid-structure factor of liquid metals has been usually assumed to be well reproduced by the hard-sphere model with some appropriate packing fraction [17]. Here we determine numerically based on the effective ion-ion interaction , using the perturbative hypernetted-chain equation (PHNC) [27]. PHNC has been successfully applied to various model systems, including liquid metals [28], and should be particularly appropriate at high densities. We note here that the temperature dependence of the scattering integral is embedded in . We calculate for example that a increase in temperature yields a decrease in the scattering integral at 2-fold compression, and only about at 4-fold compression. This is due to the fact that at high densities the liquid structure is determined mainly by the ion-ion repulsions [29], whose role only increases with increased compression.
The results of the effective mass calculations based on the Ziman theory with are summarized in Fig. 4. We note that the initial steep decrease in conductivity with pressure corresponds to an increase of to values similar with the ones found in [4], as lithium becomes less free-electron like upon compression. In this pressure range the reduction in conductivity is driven mostly by increased scattering due to decreased interatomic spacing, although the core electronic states appear to already come into play as evidenced by changes

in the effective mass. In the next regime the slow variation of the conductivity, see Fig. 3, is accompanied by a decrease of the Ziman estimated effective mass, Fig. 4. It is very likely in fact that the actual effective mass [23] increases monotonically under compression past the predicted pairing instability [4]. This is the behavior observed in LDA calculations of a dense lithium monolayer, which is believed to behave similarly with bulk lithium [30]. We note therefore that the slow variation of the conductivity, along with the decrease of the Ziman estimated effective mass, point to a shrinking ionic core, which balances the increase in scattering due to increased density. In the final regime, as the conductivity appears to drop, the effective mass increases again. In the framework of an empty core model this suggests that the exclusionary effects of the ions on the scattering of the valence electrons become dominant over the density driven core decrease. To make these observations more quantitative, we extrapolate the lower density effective mass to the high density value reported in [4], and determine the core radius that reproduces this trend - see inset to Fig. 4.
As discussed in [4, 31] in connection to several alkali metals, the importance of the core electronic states increases at high pressures, and along with it the magnitude of the pseudopotential. As a result, in the solid, symmetry-breaking distortions leading to ionic pairing may become energetically favorable [4]. In the liquid, a rising pseudopotential, i.e. a decreasing effective ionic core, see Fig. 4, should also mediate a strengthening of pairing correlations. Due to the strong exclusionary effects of the ions on the valence electrons at high densities, such correlations maximize in turn the spaces available for the electrons in the interstitial regions, away from the areas of strong core overlap in-between the ions, with beneficial effects on the energy. This exclusion of the valence electrons by the ions seems to be consistent with the behavior of the conductivity at high compressions. Given the expected small effect of the temperature on the conductivity at high densities, the apparent conductivity drop and the behavior of the ionic core at the highest pressures could be interpreted as a decrease of the overall volume available for the electrons.
It may be interesting to see if the exclusionary effects mentioned above, that lead to a very non-uniform distribution of the valence electrons, translate into the analog of classical depletion forces [32], enhancing the ionic pairing correlations in a mixture, e.g. LiH. Higher temperatures would ultimately destroy pairing correlations in the liquid. Estimates of the temperatures required should be possible, but need to rely on more detailed calculations, that could be tested against the experimental results presented here.
We thank N. Ashcroft, J. Neaton, G. Galli and R. Cauble for useful discussions, and D. Young for the lithium EOS table. M.B. warmly thanks A. Mitchell for sharing his life-long experience on shockwave experiments. We gratefully acknowledge the LDRD office for financial support. We also thank S. Caldwell, W.P. Hall, N.Hinsey, K. Stickle, L. Raper and T. Uphaus for assistance at the gas-gun facility, and L. Walkley for help with the set-up of the glove-box. This work was performed under the auspices of the U. S. Department of Energy by University of California Lawrence Livermore National Laboratory under Contract No. W-7405-Eng-48.
REFERENCES
- [1] To whom correspondence should be addresed: bastea1@llnl.gov
- [2] F. Seitz, Phys. Rev. 47, 400 (1935).
- [3] J.C. Boettger, S.B. Trickey, Phys. Rev. B 32, 3391 (1985).
- [4] J.B. Neaton, N.W. Ashcroft, Nature 400, 141 (1999).
- [5] Y. Mori, C.-S. Zha, A. Ruoff, in Science and Technology of High Pressure, Proceedings of AIRAPT-17, edited by M.H. Manghnani, W.J. Nellis and M.F. Nicol, p. 421, Universities Press, Hyderabad, India (2000).
- [6] V.V. Struzhkin, R.J. Hemley, H.K. Mao, Bull. Am. Phys. Soc. 44, 1489 (1999).
- [7] V.E. Fortov, V.V. Yakushev, K.L. Kagan, I.V. Lomonosov, V.I. Postnov, T.I. Yakusheva, JETP Lett. 70, 628 (1999).
- [8] M. Hanfland, K. Syassen, N.E. Christensen, D.L. Novikov, Nature 408, 174 (2000).
- [9] P.W. Bridgman, Phys. Rev. 17, 161 (1921).
- [10] M. Bastea, A.C. Mitchell, W.J. Nellis, Phys. Rev. Lett. 86, 3108 (2001).
- [11] A.C. Mitchell, R.N. Keeler, Rev. Sci. Instr. 39, 513 (1968).
- [12] A.C. Mitchell, W.J. Nellis, Rev. Sci. Instr. 52, 347 (1981).
- [13] S.P.Marsh, LASL Shock Hugoniot Data, University of California Press, Berkeley (1980).
- [14] D.A. Young, Phase Diagram of the Elements, University of California Press, Berkeley (1991), and references therein.
- [15] J.M. Ziman, Phil. Mag. 6, 1013 (1961).
- [16] N.W. Ashcroft, Phys. Lett. 23, 48 (1966).
- [17] N.W. Ashcroft, D.C. Langreth, Phys. Rev. 159, 500 (1967).
- [18] M. Shimoji, Liquid Metals, Academic Press, London (1977).
- [19] N.W. Ashcroft, J. Phys. C 1, 232 (1968).
- [20] D.J. Stevenson, N.W. Ashcroft, Phys. Rev. A 9, 782 (1974).
- [21] M. Itoh, M. Watabe, J. Phys. F: Met. Phys. 14, L9 (1984).
- [22] A.B. Van Oosten, W. Geertsma, Physica 133B, 55 (1985).
- [23] T. Chan, L.E. Ballentine, Can. J. Phys. 50, 813 (1972).
- [24] M. Canales, J.A. Padró, Phys. Rev. E 56, 1759 (1997).
- [25] S. Moroni, D.M. Ceperley, G. Senatore, Phys. Rev. Lett. 75, 689 (1995).
- [26] T.C. Chi, J. Phys. Chem. Ref. Data 8, 339 (1979).
- [27] H.S. Kang, F.H. Ree, J. Chem. Phys. 103, 3629 (1995).
- [28] H.S. Kang, Phys. Rev. B 60, 6362 (1999).
- [29] N.W. Ashcroft, J. Lekner, Phys. Rev. 145, 83 (1966).
- [30] A. Bergara, J.B. Neaton, N.W. Ashcroft, Phys. Rev. B 62, 8494 (2000).
- [31] J.B. Neaton, N.W. Ashcroft, Phys. Rev. Lett. 86, 2830 (2001).
- [32] see, for example, V. Vlachy, Langmuir 12, 2881 (1996).