Low temperature resistance minimum in non-superconducting 3R-Nb1+xS2 and 3R-GaxNbS2
Abstract
We report the structural and electron transport properties of 3R-Nb1+xS2 () and 3R-GaxNbS2 () prepared as polycrystalline pellets as well as single crystals grown by vapour transport. We observe a resistance minimum in these compounds between 20–60 K, with the proportional to . The resistance scales as between for different phases with whose resistivity differs by an order of magnitude. Powder X-ray diffraction (XRD) also shows progressively increasing intensity of superlattice lines with cation concentration. The thermopower changes sign around the resistance minimum. The explanation of the resistance minimum and the simultaneous rapid suppression of superconductivity is sought in - scattering effects in the presence of cation disorder in these narrow band anisotropic materials.
PACS numbers:
72.80.Ga – Transition metal compounds.
71.45.Lr – Charge density wave systems.
74.62.Bf – Effects of material synthesis, crystal structure, and
chemical composition.
Running Head: Low temperature resistance minimum, etc.
1 Introduction
The layered transition metal dichalcogenides (LTMDs) MX2 of the Group V metals (M = V, Nb, Ta; X = S, Se) and their intercalation compounds have been the subject of numerous studies on the inter-relationship between superconductivity and charge density waves (CDW), both of which arise from the strong electron-phonon (-) coupling within the layers [1, 2]. Parameters such as stoichiometry, polymorphism, disorder and intercalation have been extensively used to study the physical properties of these low dimensional compounds. There is however, no satisfactory explanation for their effect on the above transitions.
Amongst the binary compounds, all di-Selenides (V, Nb, Ta) and all polymorphs of TaS2 show CDW transitions, while the 2H and 4H Nb and Ta compounds are also superconducting. 2H-NbS2 and 1T-VS2 are unusual – In the former, any CDW is suppressed below the superconducting 6.2 K due to - interactions in the narrow unhybridised Nb bands. 1T-VS2 is structurally metastable, supposedly due to reduced covalency which destabilizes the layered structure in its stoichiometric composition. The effects of - interactions are also significant in 1T-VSe2 in which the normal to incommensurate CDW transition temperature increases from 110 K under pressure induced broadening of the narrow V bands. It also shows a small Curie-like contribution in from a small excess of V between the layers. 2H-NbSe2 ( 33 K), 2H-TaS(Se)2 ( 75(122) K) and 4Hb-TaS(Se)2 ( 22(75) K) also exhibit 7.2 K, .6 K and 1 K respectively. High pressure lowers and raises towards its ‘undistorted’ values ([2] and references therein). Lattice-dynamics calculations suggest that in these materials, - renormalisation effects on phonon frequencies are crucial in causing lattice instability, as well as raising [3]. The above transitions are absent in di-Tellurides in which strong intermetallic bonding and metal atom clustering leads to more stable but distorted structures.
Stoichiometry, intercalation and disorder significantly affect the CDW and superconductivity in these compounds. In 1T-TaS2 a mere 50 ppm of isoelectronic Nb impurities were observed to destroy the long range phase coherence of the commensurate CDW and completely suppress the associated metal-insulator (MI) transition [4]. On intercalation, the in Ta compounds increases from 1 K upto 5 K while it is lowered for Nb [5]–[9]. In self-intercalated 2H-Nb1.05Se2 the was suppressed below 2.2 K [5], while 2H-NbSe2(EDA)1/4 showed no superconductivity but a resistance minimum at 25 K [7]. Post-transition metal intercalated 2H-NbS2 also did not show superconductivity [8]. ‘Kondolike’ resistance minima at 20 K along with a CDW were observed for 2H-Fe.05Nb(Ta)Se2 [10]. LixNbS2 () has a complex dependence of on due to interplay of polymorphic changes (2H–3R) and electron transfer effects upon intercalation [11]. In fact, comparable disorder induced resistance minima at low temperatures are also seen in structurally similar Graphite intercalation compounds, and explained using weak localisation and - interactions [12].
A less studied polymorph of NbS2 is the 3R phase (space group ). While the inherently stoichiometric 2H-NbS2 forms at high temperatures (∘C) under high S vapour pressure, any excess Nb (at low S vapour pressure) results in the metal-rich 3R phase [13]. The stoichiometry limit for single phase 3R-Nb1+xS2 depends on the preparation temperature, and a minimum of has been reported at 650∘C [14]. Samples prepared at high temperature and reported closer to stoichiometry are essentially a 2H–3R mixture with properties correspondingly in between. The 3R phase can thus be considered a self-intercalated phase with the excess Nb in octahedral interlayer vacancy sites [15]. While no superconductivity has been observed in 3R-Nb1+xS2 down to 1.7 K, there is also no evidence of a CDW which could depress the same. Conduction in LTMDs is essentially intralayer. Hence the role of even small amounts of interlayer metal in suppressing superconductivity between different polymorphs needs to be investigated to understand better the effects of polymorphism, stoichiometry, disorder and dimensionality on the properties of these compounds.
We have prepared 2H-NbS2, 3R-Nb1+xS2 () and 3R-GaxNbS2 (). 2H-NbS2 has 6.2 K, as expected. The metal-rich 3R-Nb1+xS2 shows no superconductivity; rather, a resistance minimum 20 K. Non-magnetic Ga-intercalated 3R phases exhibit similar low temperature resistance minima (20 K 60 K). Thermopower also shows anomalies around . We observe a clear correspondence of and extent of localisation to the cation-to-anion ratio and the preparation temperature, i.e., to the extent of structural distortion from the ideal layered host.
2 Experimental Details
2.1 Preparation and characterisation
The compounds were prepared by heating stoichiometric mixtures of the pure elements (Ga 99.999%, Nb 99.7%, S 99.999% pure, CERAC) in evacuated quartz ampoules. 2H-NbS2 was obtained using 10% excess Sulfur. Chemical analysis by ICP-AES and EDX techniques gave Fe 240 ppm, Mn 15 ppm and Cr 10 ppm. Pressed polycrystalline pellets were sintered at different temperatures – 950∘C for the binary compound, and 850∘C (LT phase) & 1100∘C (HT phase) for Ga-intercalated compounds – and quenched to room temperature. Single crystal flakes were obtained by vapour transport (950 900∘C) for 2H-NbS2 and 3R-Ga.1NbS2. Some Sulfur rejection was observed at high temperature in all cases, indicating a metal rich composition.
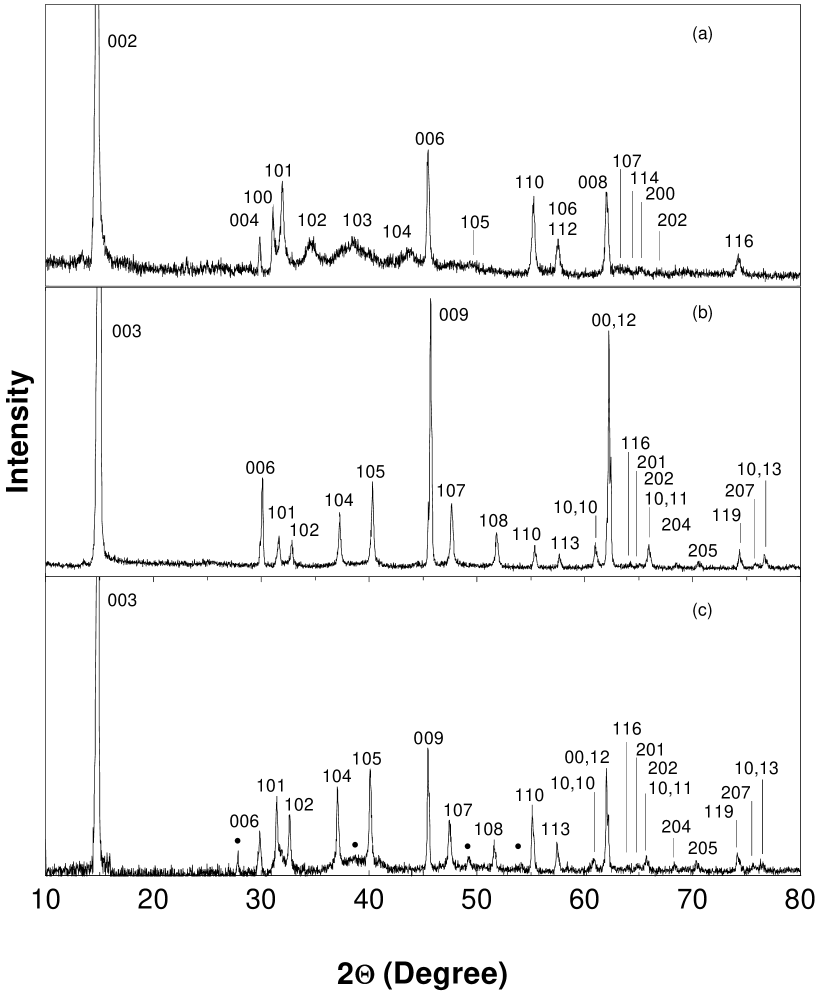
The compounds were characterised by room temperature powder XRD. We compare the XRD patterns of 2H-NbS2, 3R-Nb1+xS2 and 3R-Ga.1NbS2(LT) in Fig. 1. The 2H phase ( = 3.32 Å, = 11.97 Å) had broad () lines indicating well known disorder in the stacking of the weakly coupled antiparallel layers [16]. The metal rich 3R phases on the other hand had sharp lines, the HT phases more ordered than the LT ones. The excess metal (Nb / Ga) occupying the octahedral interlayer vacancies [8, 15] pins the layers together and prevents stacking faults. 3R-Nb1+xS2 ( = 3.32 Å, = 17.88 Å) and 3R-GaxNbS2 ( = .1, .25, .33(LT phase)) ( = 3.335 Å, = 17.905 Å) have similar lattice parameters. However, the Ga-intercalated phases exhibit superlattice reflections proportional in number and intensity to Ga content and the preparation temperature, indicating progressive distortion. The .33 Ga (HT) phase ( = 7.19 Å, = 17.30 Å) is structurally very different, with about 10% reduction in volume and a doubling of the -axis. The superlattice lines order into a doubled -axis and show much lower . Thus with increasing cation concentration and preparation temperature, the trigonal prismatic close-packed layers transform towards a distorted octahedral coordination of Nb by staggered Sulfur layers. Progressive metal clustering and vacancy formation within the Nb layers finally leads to a well ordered phase with a different structure. This is similar to cation-rich Nb2Se3, Nb3S4, Cu.33NbS2, etc. which have strong Nb-Nb bonds giving rise to zig-zag chains / clusters. These changes are also reflected in the electronic properties. The exact nature of the Nb atom clustering in our compounds would require a more detailed structural study.
2.2 Electronic properties
The electronic properties were studied by 4-probe d.c.-resistance (4.2–300 K), thermopower () (14–300 K) and magnetic susceptibility ()(80–300 K) measurements. The d.c.-resistance of pellets as well as single crystal flakes was measured in van der Pauw geometry [17] using Ag-paste contacts. The of pellets pressed between Cu stubs was measured in the differential mode. Absolute was determined by calibrating with Pb [18], and correcting for the Cu leads. The was measured on compacted powders under a 9.7 kOe field in a vibrating sample magnetometer (VSM) [19]. The results are summarised in Table 1.
The samples showing resistance minimum obviously do not follow Mattheissen’s rule for scattering from dilute impurities under the quasi-free electron approximation. Therefore, we consider the as characteristic of the residual resistance, and in subsequent discussions the residual resistance ratio (RRR) is defined by ; while, for the superconducting samples the RRR = , where is the value of the resistivity at .
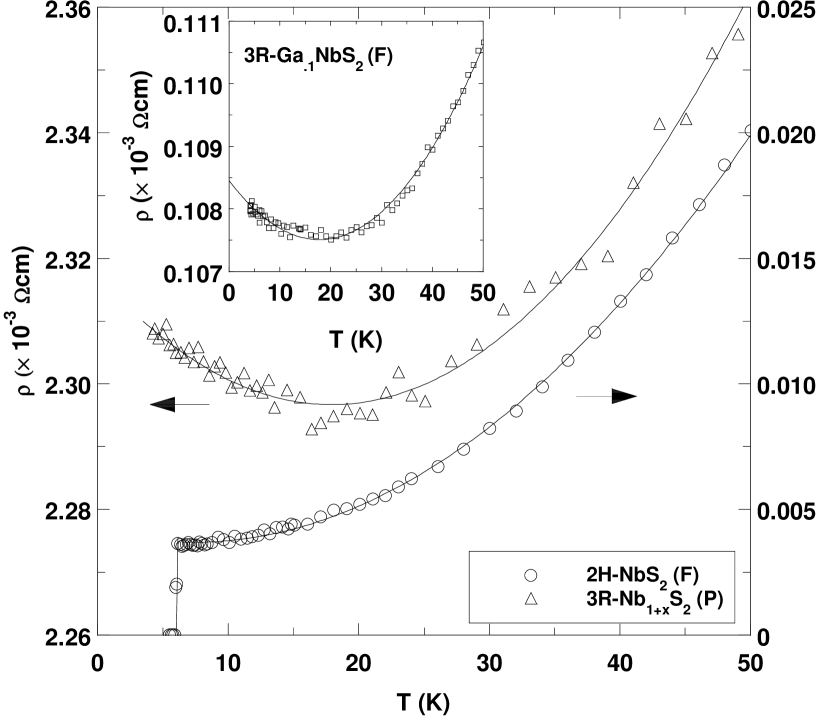
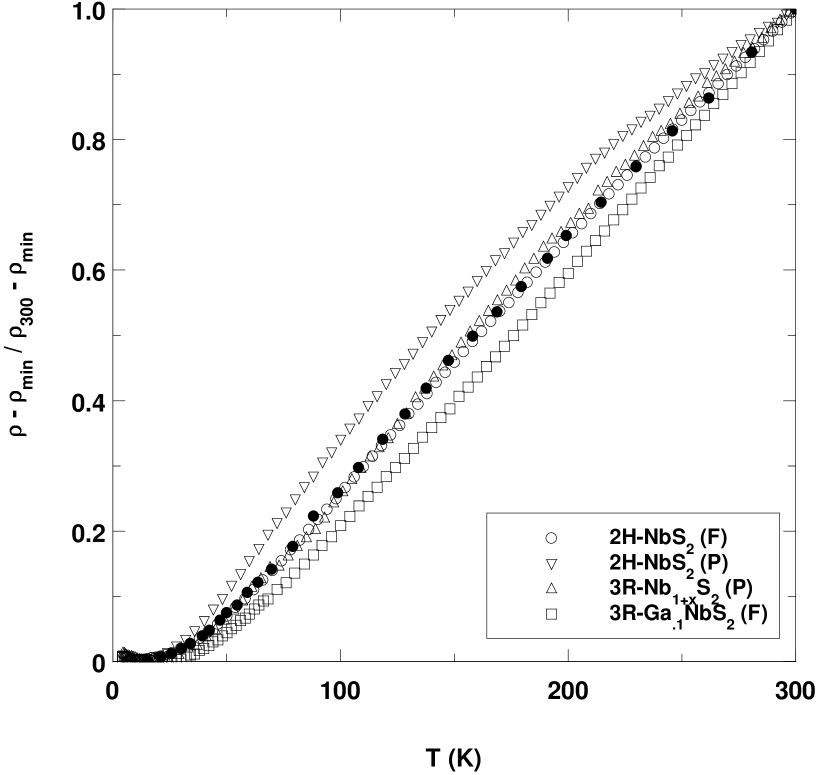
The resistivity results on single crystal flakes and polycrystalline pellets of both 2H and 3R polymorphs are shown in Fig. 2 and 3. Grain boundary scattering in the pellets and the anisotropy of conduction in flakes would prevent their inter-comparison. Figure 3 therefore shows the normalised resistance behaviour after subtracting low temperature residual resistances. The 2H phase K and its large RRR of for in-plane conduction in the flakes compare well with earlier studies [20, 21]. Thus inspite of a considerable degree of stacking disorder, the essentially in-plane conduction and also the superconductivity is not affected in 2H polymorphs. The 3R phases on the other hand have no stacking disorder as inferred from their sharp XRD pattern, but gave a resistance minimum around and above 20 K. The temperature and extent of the minimum increases with the amount of intercalate atoms.
The overall conduction behaviour of the 3R phases showing a resistance minimum is also significantly different. Firstly, we notice a large increase in residual resistance upon intercalation (Table 1). For example, the .1 Ga crystal flake measured along the plane has a RRR of only 1.65, although its resistivity is actually much lower than superconducting 2H-NbS2 (RRR 69). The scattering of electrons at higher temperatures is also significantly different. We observe in the 3R phases a comparatively faster drop in resistance of flakes as well as pellets and also a larger contribution of T2 - term above their resistance minimum (Fig. 3). The reduction in saturation effects in the high temperature conduction of the polycrystalline 3R-Nb1+xS2 phase probably indicates an increase in its isotropy of conduction. A proper explanation of this difference would require a detailed investigation of the effects of non-stoichiometry and polymorphic changes on the band structure and - interaction effects. The observed differences, however, cannot be simply related to doping of carriers since extra Nb or Ga atoms have similar effects. We presently conclude that in the intrinsically non-stoichiometric 3R-Nb1+xS2 phases the intralayer scattering potentials are significantly increased, leading to large residual resistance, increased - scattering effects, and consequently low temperature localisation of carriers.
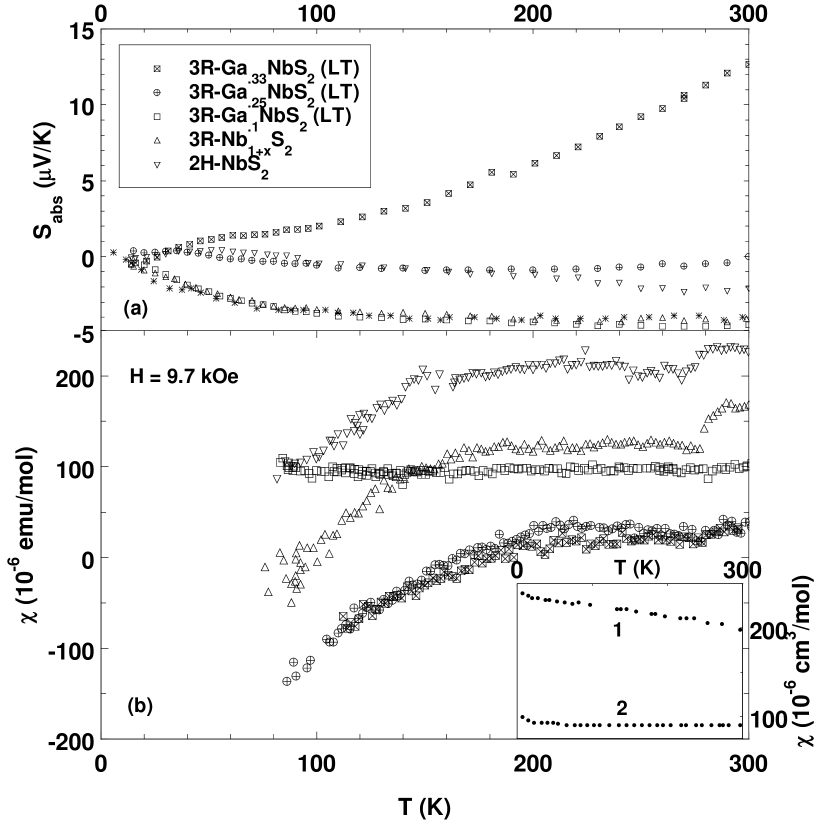
The and results on polycrystalline 2H and 3R phases are shown in Fig. 4. The of 3R phases of self intercalated and .1 Ga intercalated phase are very similar but differ markedly from that of 2H-NbS2. For the former a large, fairly constant, negative at high temperature changing rapidly towards positive below 100 K can be seen. For we have subtracted a small saturated contribution which was observed in the behaviour at low fields ( kOe). Our data differ from previous studies, as we observe a continuous reduction in instead of a slight increase on cooling [13]. These are the typical dependences observed in compounds showing CDW instabilities.
3 Discussion
We have earlier mentioned that group V TMD compounds of other than the present studies, i.e., layered 1T-VSe2, 2H-NbSe2 and various polymorphs of TaS(Se)2, show varying degrees of CDW formation. The associated anomalies in their transport and magnetic properties are much weaker than in 1D CDW structures such as NbS3, TaS3 etc. For example, except for 1T-TaS2 which has a CDW lead MI transition, the usual increase in resistance at , is barely observable and only a steep increase in its slope is observed below . Recent optical studies on 2H-TaSe2 confirm the absence of any abrupt formation of a charge-excitation gap at [23]. The steep increase in the resistance slope below is found to be a consequence of freezing-out of scattering channels since the Drude scattering peak in ( 0) becomes narrower below . In the light of the above observations, we cannot rule out CDW-correlations in our 3R phases, more so since superstructural distortions are clearly observed in intercalated phases. The thermopower and magnetic susceptibility variation also suggest some non-magnetic electronic correlations developing on cooling. A careful structural study of the 3R polymorphs of NbS2 at low temperature is therefore required to ascertain the relation of the superlattice with the observed transport and magnetic properties.
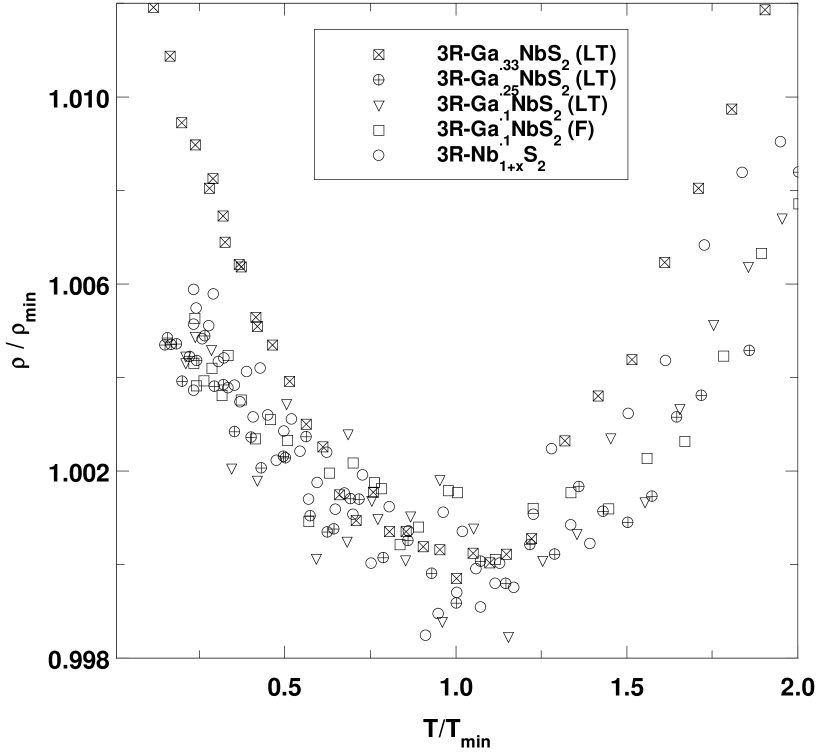
In Fig. 5 we show a scaled plot of resistance behaviour with temperature for the compounds of our study between . There is seen to be a close similarity for the crystal flakes and pellets of compounds having different intercalate (Ga/Nb) concentration and showing vastly different resistivity values. It clearly indicates the role of defects in these compounds since and show a systematic increase with the intercalate concentration.
The resistance minimum may be sought to be explained by Kondo scattering from dilute magnetic impurities such as Fe or Mn [24, 25, 26]. However, as stated earlier, the maximum concentration of such impurities in our compounds ( ppm) is too low for significant spin-flip scattering contribution. Neither do we observe the expected logarithmic dependence of resistivity upon temperature for . The temperature of the Kondo minimum plotted as vs is in fact only weakly dependent upon the extrinsic impurity concentration. Instead, we find a strong dependence of on intercalate concentration which scales as shown in Fig. 5. Moreover, our is smoothly varying in the temperature range of resistance minimum instead of the broad, large maxima expected in Kondo systems. The Pauli like of our compounds at high temperature is also in contrast to the Curie-Weiss like behaviour of Kondo systems for . Thus Kondo scattering cannot be invoked to explain the observed behaviour of our compounds.
On the other hand, disorder and Coulomb interaction effects on the scattering of electrons in a narrow anisotropic band of these compounds are expected to be quite important. For , ( – Fermi momentum, – elastic mean free path), the quasi-classical treatment of elastic scattering leading to Mattheissen’s rule in dilute alloys breaks down. The rise in resistance on cooling can be understood in terms of either increasing interference corrections for the elastically scattered waves from the static disorder or subtle changes in the excitation spectrum at the Fermi level caused by - interaction effects in the presence of ionic disorder, as first suggested by Altshuler and Aronov [27]. The relative importance of these quantum correlations and their temperature dependence depends on dimensionality and the details of band structure of the conduction electrons.
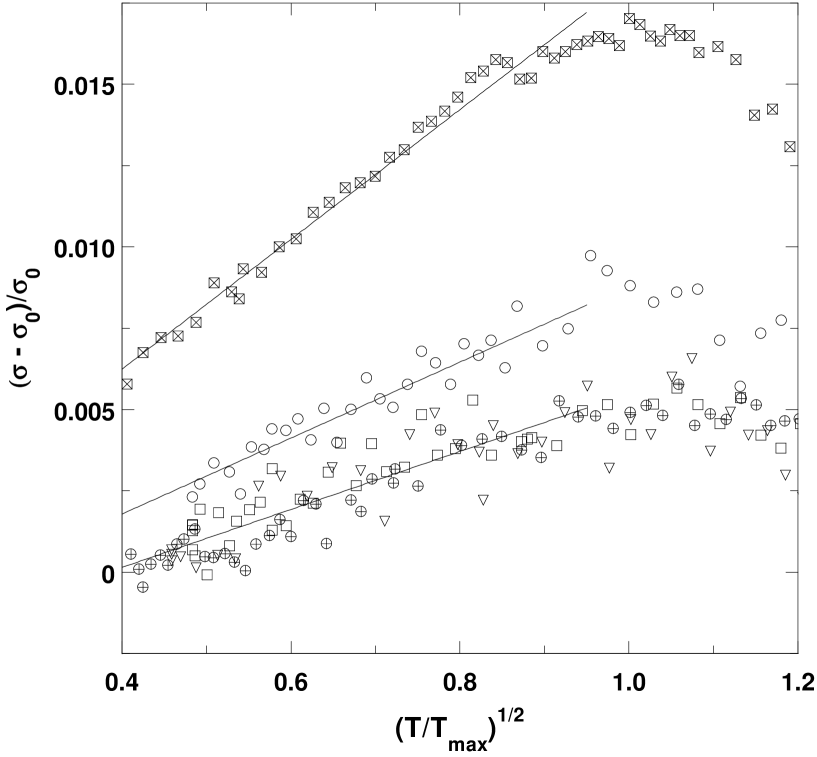
The plots of at low temperature are shown in Fig. 6, where is the value of conductivity at 0 K obtained by extrapolating below 4.2 K. Our preliminary results show a nearly dependence of the conductivity far below its maximum, the coefficient of the term depending upon the stoichiometry and structural details. The observed behaviour suggests quantum corrections to the DOS due to long range Coulomb interactions between conduction electrons [27]. The metal rich .33 Ga (HT) phase also exhibits similar behaviour, though with a much larger slope. Here the localisation effects are dramatically increased due to the clustered nature of the metallic lattice.
We mention here an interesting possibility which may increase the long range Coulomb interaction effects between charge carriers. The theory of Altshuler and Aronov gives a depression in DOS() [27]. The present compounds are prone to CDW correlations which also reduce DOS(). However, for CDW the - interactions are very special since they require - coupling across a nesting wave vector. Therefore, the role of incipient CDW fluctuations in the presence of disorder to give the observed resistance minimum behaviour in these compounds should be seriously explored.
To summarise, we have observed low temperature resistance minima in non-superconducting metal-rich NbS2 derivatives – non-stoichiometric 3R-Nb1+xS2 ( 20 K) as well as 3R-GaxNbS2 (20 K 60 K). A common physical origin of these minima is evident in the scaling of resistance as between for different phases whose resistivity differs by an order of magnitude. The low temperature behaviour of these non-magnetic compounds cannot be explained by Kondo scattering effects. Instead, we find that the conductivity varies as below its maximum (i.e., below ()). We, therefore, propose that a possible cause for the observed behaviour in these narrow band anisotropic systems is a correction to the DOS() due to - interaction effects in the presence of ionic disorder.
Acknowledgements: We are grateful to Prof. Deepak Kumar for illuminating discussions. AN thanks CSIR, New Delhi for financial support during his doctoral work.
References
- [1] Wilson J.A., Di Salvo F.J. and Mahajan S., Adv. Phys., 24 (1975) 117.
- [2] Friend R.H. and Yoffe A.D., Adv. Phys., 36 (1987) 1.
- [3] Nishio Y., et al, J. Phys. Soc. Japan, 63 (1994) 156; Nishio Y., J. Phys. Soc. Japan, 63 (1994) 223.
- [4] Zwick F., et al, Phys. Rev. Lett., 81 (1998) 1058.
- [5] Revelinski E., Spiering G.A. and Beernstein D.J., J. Phys. Chem. Solids, 26 (1965) 1029.
- [6] Di Salvo F.J., et al, J. Chem. Phys., 59 (1973) 1922.
- [7] Meyer S.F., et al, J. Chem. Phys., 62 (1975) 4411.
- [8] Karnezos N., Welsh L.B. and Shafer M.W., Phys. Rev. B, 11 (1974) 1808.
- [9] Gamble F.R. and Geballe T.H., Treatise on Solid State Chemistry, Inclusion Compounds, 3 Plenum, New York (1976) Ch. 3.
- [10] Dai Z., et al, Phys. Rev. B, 48 (1993) 14543.
- [11] McEwen C.S. and Sienko M.J., Rev. de Chim. Min., 19 (1982) 309.
- [12] Piraux L., et al, Solid State Commun., 82 (1992) 371.
- [13] Fisher W.G. and Sienko M.J., Inorg. Chem., 19 (1980) 39.
- [14] Tatsuki K., Wakihara M. and Taniguchi M., J. Less Common Metals, 68 (1979) 183.
- [15] Powell D.R. and Jacobson R.A., J. Solid State Chem., 37 (1981) 140.
- [16] Jellinek F., Arkiv Kemi, 20 1963 447.
- [17] van der Pauw L.J., Phillips Res. Repts., 13 (1958) 1.
- [18] Roberts R.B., Phil. Mag., 36 (1977) 91.
- [19] Niazi A., Poddar P. and Rastogi A.K., Current Science, 79 (2000) 99.
- [20] Naito M. and Tanaka S., J. Phys. Soc. Japan, 51 (1982) 219, 228.
- [21] Hamaue Y. and Aoki R., J. Phys. Soc. Japan, 55 (1986) 1327.
- [22] Bowmeester H.J.M., et al, Phys. Rev. B, 43 (1991) 9431.
- [23] Vescoli V., et al, Phys. Rev. Lett., 81 (1998) 453.
- [24] Kondo J., Solid State Physics, 23, ed. F. Seitz, D. Turnbull and H. Ehrenresch, Academic Press, New York (1969) 183.
- [25] Heeger A.J., Solid State Physics, 23, ed. F. Seitz, D. Turnbull and H. Ehrenresch, Academic Press, New York (1969) 283.
- [26] Maple M.B., DeLong L.E. and Sales B.C., Handbook on the Physics and Chemistry of Rare Earths ed. K.A. Gschneider, Jr. and L. Eyring, North Holland Publishing Co. (1978) 797.
- [27] Altshuler B.L. and Aronov A.G., Electron-Electron Interactions in Disordered Systems, ed. A.L. Efros and M. Pollak, Elsevier Science Publishers B.V., Amsterdam (1985) 1.
| Sample | D.C. Resistivity | |||||
| Tmin | R.R.R. | (V / K) | ( | |||
| (-cm) | (K) | () | emu/mole) | |||
| 2H-NbS2 | 0.241 | 0.0035 | – | 68.83 | – | – |
| 2H-NbS2 | 2.02 | 0.80 | – | 2.52 | 2.092 | 200 |
| 3R-Nb1+xS2 | 3.23 | 2.296 | 20 | 1.408 | 4.114 | 100 |
| Ga.1NbS2 | 0.178 | 0.1075 | 20 | 1.656 | – | – |
| Ga.1NbS2 (LT) | 1.96 | 1.380 | 20 | 1.420 | 4.501 | 100 |
| Ga.25NbS2 (LT) | 2.29 | 1.874 | 28 | 1.222 | 0.199 | 30 |
| Ga.25NbS2 (HT) | 4.32 | 3.575 | 32 | 1.207 | 1.305 | 35 |
| Ga.33NbS2 (LT) | 4.74 | 3.950 | 41 | 1.200 | 12.667 | 30 |
| Ga.33NbS2 (HT) | 12.00 | 10.60 | 58 | 1.128 | 3.012 | 140 |