From Mott insulator to overdoped superconductor:
Evolution of
the electronic structure of cuprates studied by ARPES
Abstract
We review our angle-resolved photoemission spectroscopy (ARPES) results on different layered oxide superconductors, and on their insulating parent compounds. The low energy excitations are discussed with emphasis on some of the most recent issues, such as the Fermi surface and remnant Fermi surface, the pseudogap and -wave-like dispersion, and lastly the signatures in the ARPES spectra of multiple electronic components, many body effects, and the superfluid density. We will focus on systematic changes in the electronic structure which may be relevant to the development of a comprehensive picture for the evolution from Mott insulators to overdoped superconductors.
keywords:
Photoemission; ARPES; Electronic structure; Cuprates; Mott insulators; High temperature superconductors, ,
1 Introduction
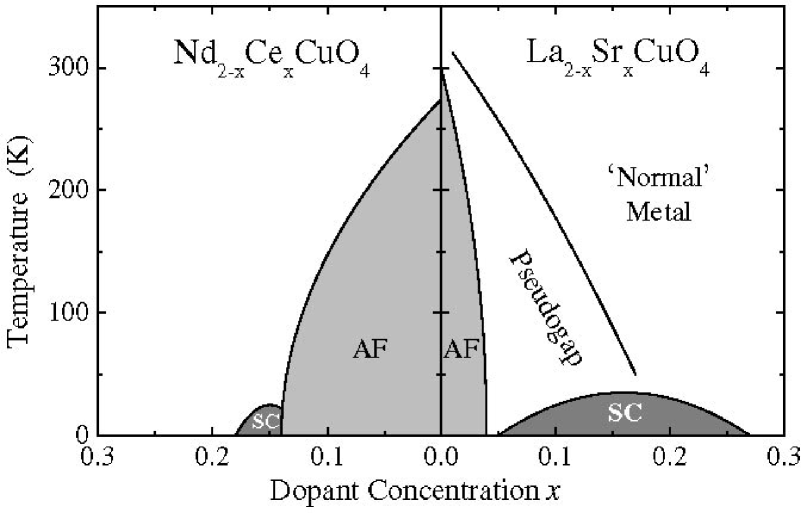
Following their remarkable discovery in 1986 [1, 2], high-temperature superconductors (HTSCs) have attracted great interest due to their scientific significance and enormous potential for applications. The latter is obviously related to the high transition temperature shown by these compounds ( can be as high as 134 K in HgBa2Ca2Cu3O8-δ at atmospheric pressure [3]). Their scientific importance stems from the fact that the HTSCs highlight a major intellectual crisis in the quantum-theory of solids which, in the form of one-electron band theory, has been very successful in describing good metals and semiconductors (like Cu and Si, respectively) but has proven to be inadequate for strongly correlated electron systems. The failure of the single-particle picture and the main conceptual issues involved in the study of HTSCs can be best illustrated starting from the phenomenological phase diagram of n and p-type HTSCs [represented by Nd2-xCexCuO4 (NCCO) and La2-xSrxCuO4 (LSCO), respectively, in Fig. 1].
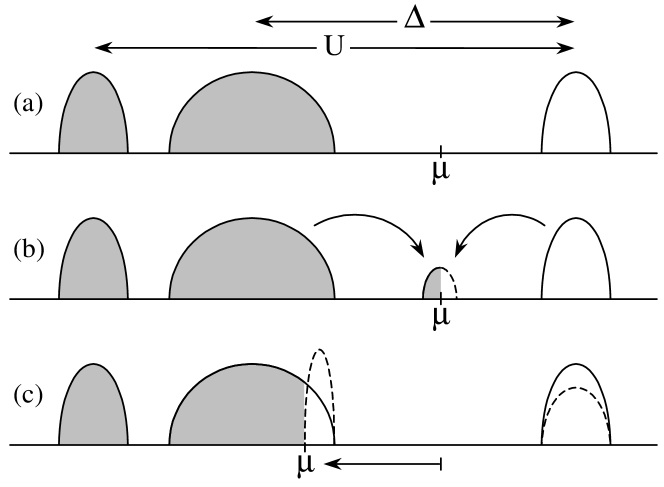
The dependence of the resistivity observed in the overdoped metallic regime is taken as evidence for Fermi liquid (FL) behavior. On the other hand, the applicability of FL theory (which describes electronic excitations in terms of a weakly interacting gas of quasiparticles) to the ‘normal’ metallic state of HTSCs is questionable, because many properties do not follow canonical FL behavior. Most dramatic becomes the breakdown of FL theory and of the single particle picture upon approaching the undoped line of the phase diagram (), where we find the antiferromagnetic (AF) Mott insulator. Mott-Hubbard insulators, because of the odd number of electrons per unit cell, are systems erroneously predicted by band theory to be paramagnetic metals (with a partially filled d-band in the case of transition metal oxides) [4, 5, 6]. The reason for this failure lies in the on-site electron-electron repulsion which is much larger than the bandwidth . As a consequence, charge fluctuations are suppressed and these compounds are rather good insulators at all temperatures, with an optical gap of a few eV between the lower and upper Hubbard bands (LHB and UHB). As a matter of fact, in the cuprates the Cu-O charge-transfer energy is smaller than the on-site Coulomb repulsion (see Fig. 7a), which characterizes these compounds more precisely as charge-transfer insulators [7]. However, because the first electron-removal state corresponds to the O-derived Zhang-Rice singlet band (ZRB), the cuprates are thought to be equivalent to an effective Mott-Hubbard system with the ZRB playing the role of the LHB, and an in-plane Cu-derived band as the UHB [8]. These states are separated by an effective Mott gap .
Therefore, many aspects of the physics of the cuprates are believed to be captured by the single-band Hubbard model [9]. This contains a kinetic-energy term proportional to the nearest neighbor (nn) hopping amplitude , and an ad hoc Hubbard term which accounts for electronic correlations: large Coulomb repulsion favors electron localization and results in ‘frustration’ of the kinetic energy. In the strong coupling limit () at half filling (, i.e., one electron per Cu site), the AF state [10] results from the fact that, when spins are antiparallel to each other, the electrons gain kinetic energy by undergoing virtual hopping to the neighboring sites (because of the Pauli principle hopping is forbidden for parallel spins). By projecting out the doubly occupied states at large [11], the low-lying excitations of the 1/2-filled Hubbard model are described by the - Hamiltonian (). Away from half filling, the - model describes the so called ‘doped AF’, i.e., a system of interacting spins and mobile holes. The latter acquire a ‘magnetic dressing’ because they are perturbing the correlations of the spin background that they move through.
The challenge in the investigation of the electronic properties of the cuprates is to sort out the basic phenomenology that can test the relevance of many-body models in describing the low lying excitations, in both the insulator and the doped metal. At the same time, it is also prudent to consider the influence of other degrees of freedom on the physical properties of these complex materials. For instance, phonon modes and lattice distortion can play a very important role, in particular when they couple to potential instabilities of the charge and/or spin degrees of freedom. Nevertheless, in order to address the scope of the current approach in the quantum theory of solids and the validity of the proposed models, a detailed comparison with experiments that probe the electronic properties and the nature of the elementary excitations is required. In this context, ARPES has played a major role because it is the most direct method of studying the electronic structure of solids [12].
In this paper, we review our recent ARPES results on the cuprates. As the doping evolution allows a critical comparison between theory and experiment, we will discuss ARPES data on the HTSCs and their insulating parent compounds, focusing on systematic changes in the electronic structure that may be relevant to the development of a comprehensive picture for the evolution from Mott insulators to overdoped superconductors.
2 State-of-the-art ARPES
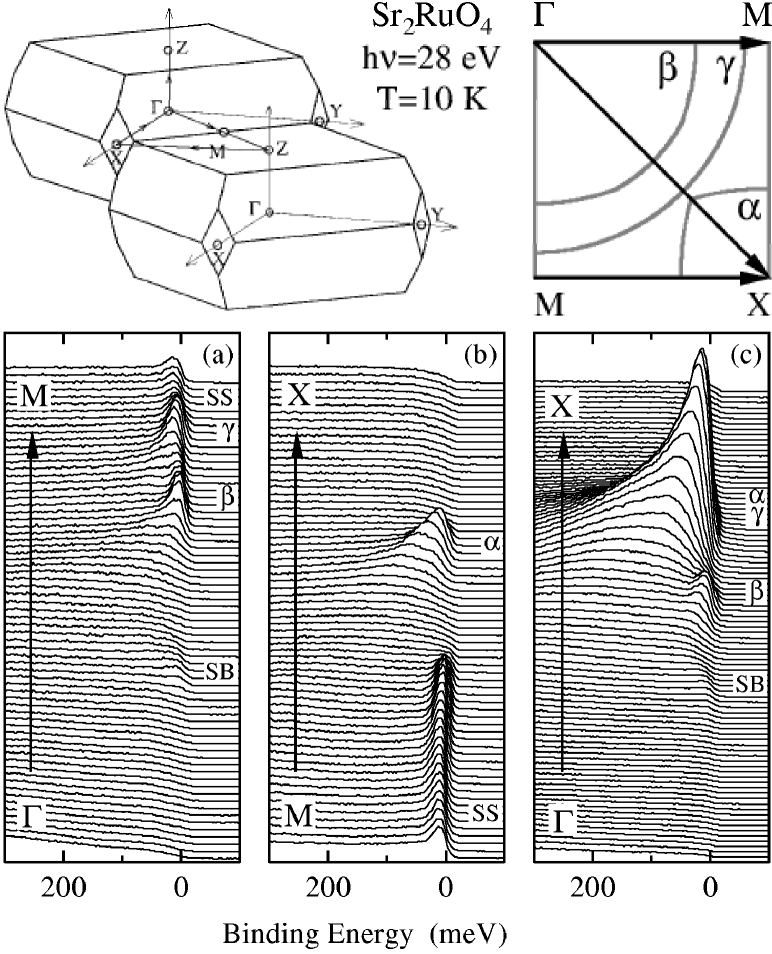
In the early stages of the HTSC field, ARPES proved to be very successful in measuring the normal state Fermi surface (FS), the superconducting gap, and the symmetry of the order parameter [12]. During the past decade, a great deal of effort has been invested in further improving this technique which now allows for energy and momentum resolution of, respectively, a few meV and % of the typical Brillouin zone (BZ) of HTSCs, thus ushering in a new era in electron spectroscopy and allowing a very detailed comparison between theory and experiment. To illustrate the capability of state-of-the-art ARPES, the novel superconductor Sr2RuO4 is a particularly good example because of its complex electronic structure and especially because controversy has plagued the investigation of its FS topology. In addition, contrary to the cuprate HTSCs, this material can also be investigated with other techniques, like de Haas-van Alphen (dHvA) experiments, thus providing a direct comparison with the ARPES results.
Whereas dHvA experiments [13], in agreement with LDA band-structure calculations [14], indicate two electron-like FSs and centered at the point, and a hole pocket at the X point (as sketched in 1/4 of the projected zone in Fig. 2), early ARPES measurements suggested a different picture: one electron-like FS at the point and two hole pockets at the X point [15]. The difference comes from the detection by ARPES of an intense, weakly dispersive feature at the M point just below , that was interpreted as an extended van Hove singularity (evHs). Although the evHs was questioned in a later ARPES study [16], in which the feature detected at the M point was suggested to be a surface state (SS), a conclusive picture and a final agreement between ARPES data, and dHvA and LDA results was reached only with the ‘new-generation’ of high-resolution photoemission data.
Fig. 2 presents energy distribution curves (EDCs), along the high-symmetry directions of Sr2RuO4, recently reported by Damascelli et al. [17]. Owing to the high momentum and energy resolution (1.5% of the BZ and 14 meV), we can now clearly identify several dispersive features crossing precisely where the , , and sheets of the FS are expected on the basis of LDA calculations and dHvA experiments (all detected features in Fig. 2 are labeled following their assignment). Around the M point we can also observe the sharp peak (labeled SS) that was initially associated with a hole-like sheet of FS centered at X [15].
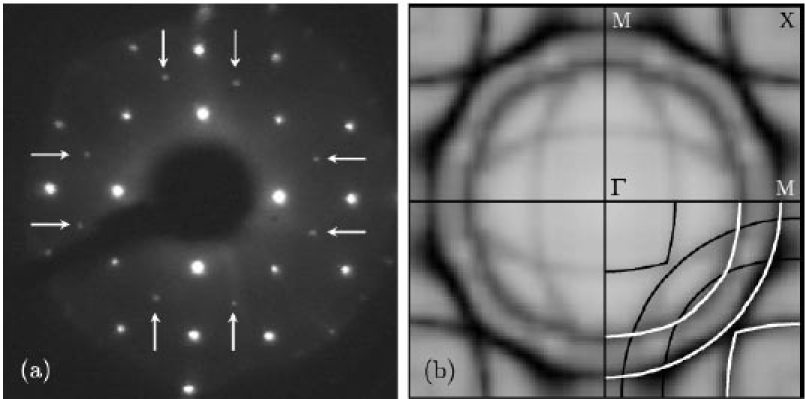
A Fermi energy intensity map can be obtained by integrating the EDCs over a narrow energy window about ( meV). As the spectral function multiplied by the Fermi function reaches its maximum at when a band crosses the Fermi energy, the FS is identified by the local maxima of the intensity map. Following this method, the , , and sheets of FS are clearly resolved, and are marked by white lines in Fig. 3b. In addition, we find some unexpected features: weak, yet well defined profiles marked by black lines. They can be recognized as a replica of the primary FS, and are related to the weak ‘shadow bands’ (SB) which show dispersion opposite to the primary peaks along -M and -X (see Fig. 2). The origin of the shadow bands as well as of the SS, can be identified with the intrinsic instability of the cleaved surface of Sr2RuO4: inspection with LEED reveals superlattice reflections corresponding to a surface reconstruction (Fig. 3a), which is responsible for the folding of the primary electronic structure with respect to the M-M direction [17, 18]. In light of these findings, the bulk FS determined by ARPES is consistent with the LDA and dHvA results. In addition, ARPES provides essential information on the detailed shape of the , , and sheets of FS [17].
3 The Mott insulator
The - model, briefly discussed in the introduction, is of particular relevance to the low-energy features detected in ARPES on the cuprates. In fact, in ARPES experiments performed on the insulating parent compounds of the HTSCs, one photo-hole is injected in the CuO2 plane as a result of the photoemission process. Therefore, this experiment is the practical realization of a ‘single hole’ in the AF insulator, and the comparison of ARPES data and calculations based on the - model is particularly meaningful because the single-hole calculation is free from complications such as charge ordering, which is difficult for small-cluster calculations to deal with.
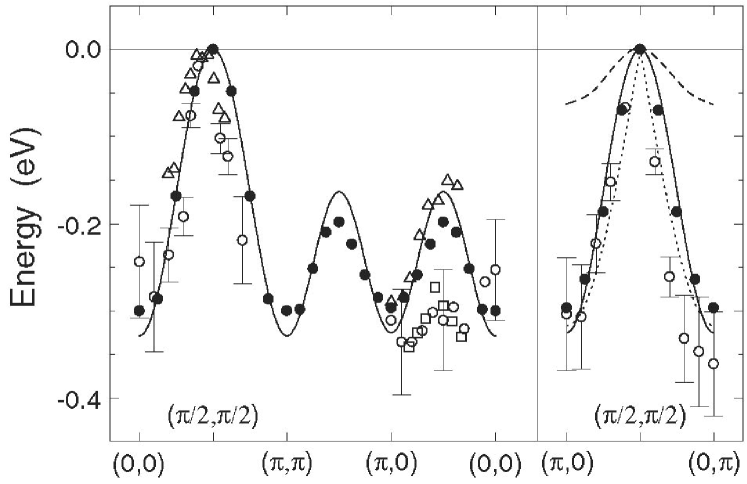
Experimental data taken from Ref. [19, 20, 21] for the energy dispersion of the quasiparticle (QP) peak in insulating Sr2CuO2Cl2 (SCOC) are shown in Fig. 4 (open symbols). Note that in the course of the paper we will use terms like QP in a loose sense for convenience, even though in most cases FL theory does not apply and well defined QP peaks cannot be identified in the ARPES spectra. The dispersion along the (0,0)-(,) direction is characterized by a bandwidth eV. As pointed out in the first ARPES investigation on this compound [19], this result is in very good agreement with - model calculations [22] which show that, independent of the value of , the dressing of the hole moving in the AF background reduces the QP bandwidth from ( eV for a free hole) to 2.2 (with meV in SCOC, as independently deduced from neutron scattering studies [23]). On the other hand, the - model also predicts a relatively flat dispersion [22] along the (,0)-(0,) direction (dashed line in Fig. 4), in contradiction to the more isotropic dispersion observed in ARPES around (/2,/2), with eV independent of the direction. Also the poorly defined lineshape and the spectral weight suppression observed at (,0), which indicate the lack of integrity of the QP at those momenta, cannot be reproduced within the simple - model [21].
Better agreement between the experimental dispersion and the calculations (solid circles and solid line in Fig. 4) is obtained by adding second and third nn hopping ( and , respectively) to the - Hamiltonian [21, 24, 25, 26, 27, 28, 29, 30, 31, 32, 33]. In fact, as and describe hopping within the same magnetic sublattice, they do not alter the AF properties of the model at half filling; at the same time, they are not strongly renormalized by the AF correlations but contribute directly to the coherent motion of the hole and, therefore, have a substantial impact on the QP dispersion. The inclusion of these terms also helps in reproducing the suppression, as compared to (/2,/2), of the QP peak observed in ARPES at (,0). However, nothing can be said about the line shape because the broadening is artificially introduced in the theory, which is a major limitation of this kind of approach. Most importantly, it can be shown that the suppression of the QP peak at (,0) reflects a reduction of AF spin correlations: the additional hopping possibilities represented by and induce a spin-liquid state around the photo-hole with momentum (,0) [33]. As a consequence, one may expect to find in the ARPES results some signatures of spin-charge separation [9]. Within this context, it is interesting to note that the full QP dispersion observed for SCOC can be very well reproduced also by the spinon dispersion given in [34] [the dotted line in Fig. 4 shows the result along (,0)-(0,)]. In this case Laughlin argues in favor of the decay of the photo-hole injected in the 2D AF CuO2 plane into a spinon-holon pair [34], which is reminiscent of the flux phase physics [35, 36, 37, 38, 39, 40], an extension of the early resonating valence bond (RVB) conjecture [9].
The discussion of the ARPES result on insulating SCOC emphasizes a fundamental problem in the theoretical description of the doped 2D AF: the Heisenberg model is so strongly perturbed by the addition of mobile holes that, above a certain doping level, some form of spin liquid may be a better ansatz than the long range ordered Néel state. This point is centrally important to high- superconductivity because HTSCs, which are poor conductors in the normal state, may be better regarded as doped AFs, whose behavior differs fundamentally from the FL paradigm. For this reason, the Bardeen-Cooper-Schrieffer (BCS) theory [41] which was developed for Fermi-liquid metals (i.e., weak electron correlations), and has been so successful in describing conventional superconductors, does not have the appropriate foundation for HTSCs. A new approach may therefore be needed, and a necessary requirement for any theory aiming to capture the essential physics of high- superconductivity must be the inclusion of the essential physics of the doped AF: the competition between AF and Coulomb interactions (which induce localization), and zero point kinetic energy (which favors delocalization). Along this direction, the most radical models seem to be those based on: (i) the RVB state and the related spin-charge separation picture [9, 34, 35, 36, 37, 38, 39, 40, 42, 43, 44, 45], (ii) stripes [46, 47, 48, 49, 50, 51, 52, 53, 54, 55, 56, 57], and (iii) quantum criticality [58, 59, 60, 61, 62, 63]. Independent of their details, these different theoretical approaches have one important common denominator: superconductivity is not caused by the pairing of two QPs, as in the BCS case, rather it is the process in which the QP itself forms. Furthermore, in the first two cases the driving mechanism for the superconducting phase transition is identified with the gain in kinetic energy, contrary to the standard theories of solids where any phase transition into a long-range ordered state is driven by the gain in potential energy. In the stripe or RVB models the hopping of pairs of holes perturbs the AF spin background less than individual holes. However, it is only when charge fluctuations become phase coherent that the frustration of the kinetic energy is released, and superconductivity sets in.
3.1 Remnant FS and -wave-like dispersion
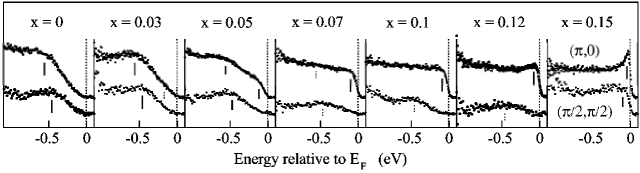
We mentioned above that both the relatively isotropic dispersion at (/2,/2), and the suppression of QP weight at (,0), observed from ARPES on SCOC and Ca2CuO2Cl2 (CCOC, similar in many respects to SCOC [64]), cannot be explained with the nn hopping - model. Better agreement with the experiment is obtained by including longer range hopping terms in the model. In this way, it is possible to also reproduce the doping dependence of the QP band structure and, in particular, of the (,0) ARPES spectra [28]. These are shown for optimally doped Bi2Sr2CaCu2O8 (Bi2212), Dy-Bi2212 and CCOC [64] in Fig. 5b. Note that for CCOC the zero in energy does not correspond to but to the peak position at (/2,/2) which, because of the Mott gap, is located meV below the chemical potential and corresponds to the top of the valence band.
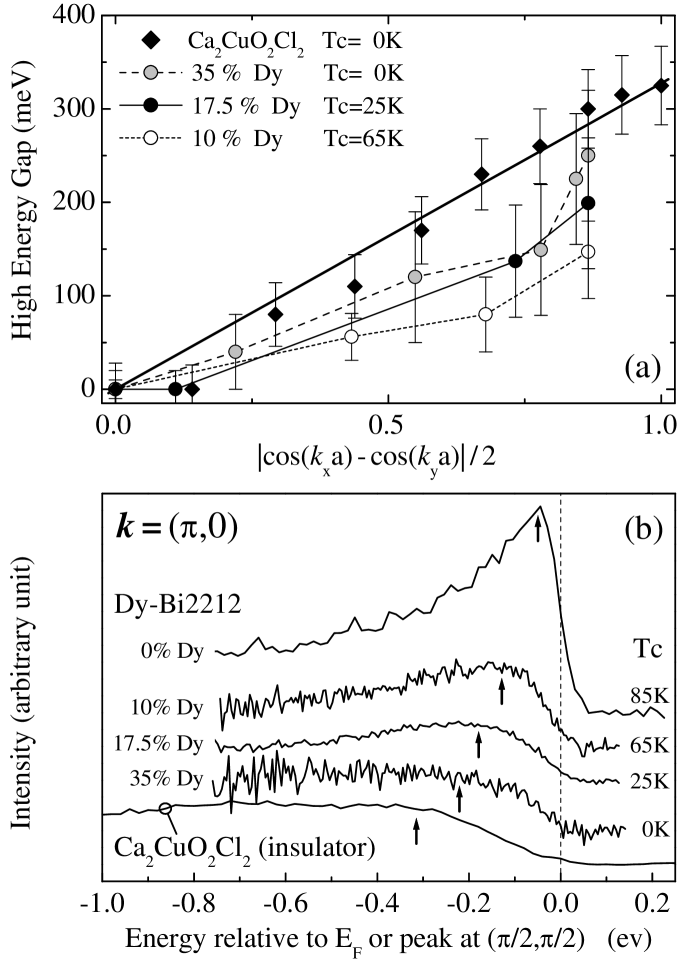
In underdoped samples the QP peak at (,0) loses coherence and shifts to higher BE, while at (/2,/2) spectral weight still reaches the Fermi level. The lack of a FS crossing along the (,0)-(,) cut in the normal state of the underdoped regime indicates the opening of a pseudogap [64, 65, 66, 67], which appears to be characterized by the same -wave symmetry found for the superconducting gap [68]. Because the maximum size of the pseudogap is found at the crossing along the (,0)-(,) direction, and the dispersion around (,0) is very weak, the doping dependence of the pseudogap magnitude can be deduced from the energy position of the QP peak at (,0), as shown in Fig. 5b.
However, the - model, even in its more extended form, cannot completely account for the strong momentum dependence of the ARPES spectra from the undoped insulator [69]. In particular, even though a drop of intensity of the lowest energy peak along (0,0)-(,), after the AF BZ boundary, is predicted by the - model [69, 70], it is not as sharp as experimentally observed in SCOC and CCOC [19, 64]. This limitation of the - model comes from having projected out the doubly occupied states originally contained in the Hubbard model: whereas the momentum occupation number is a strongly varying function of in the intermediate- Hubbard model at half filling, it is trivially equal to 1/2 in the - model which, therefore, cannot describe the anomalous distribution of spectral weight in the single particle spectral function. This effect is accounted for by the complete large U-limit of the Hubbard model (i.e., without neglecting certain terms in the large perturbation theory), as shown by Eskes and Eder [69]. For the spectra of large-U-Hubbard and - model will coincide, and ; however, the convergence in is very slow. On the basis of finite size cluster calculations within the full strong coupling model, Eskes and Eder reproduced the sharp drop of intensity observed in the ARPES spectra from SCOC at the AF BZ boundary (referred to, by the same authors, as a ‘pseudo-FS’ [69]).
A detailed experimental characterization of the -dependence of the ARPES spectral weight for the undoped insulator has been presented by Ronning et al. [64], on the basis of mapping obtained by integrating the EDCs from CCOC over an energy window larger than the bandwidth. From the location of the steepest drops in , which successfully gives the FS for overdoped Bi2212, they could define a ‘remnant-FS’ (RFS) for CCOC (Fig. 6a and 6b, bottom), which closely follows the AF BZ boundary. Note that matrix element effects also influence the -dependence of the intensity and alter the profile of the RFS [71]; however the sharp drop at the AF BZ boundary observed at different photon energies, in the experiment, and in the numerical results appears to be a robust feature, despite minor uncertainties related to the photon energy dependence of the photoionization cross section [72, 73].
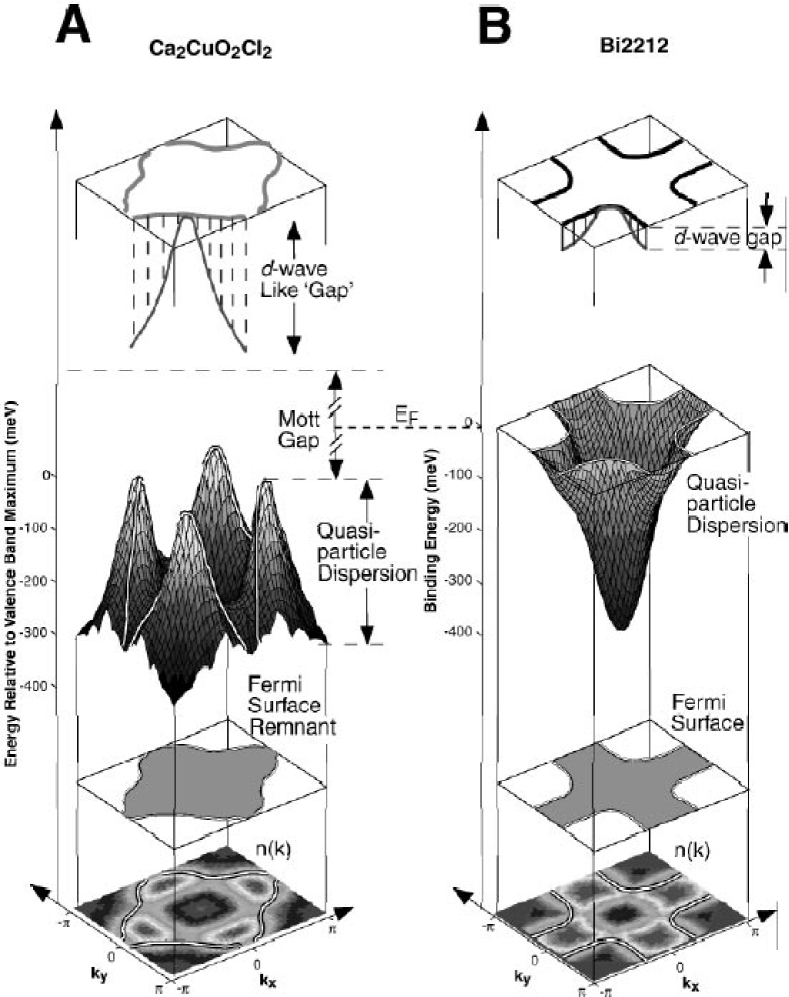
It is important to realize that the RFS is not a real FS (the system has a Mott gap) but identifies the same locus of rapid intensity drop referred to as a pseudo-FS by Eskes and Eder [69]. In addition, it does not even correspond to an isoenergetic contour in the QP dispersion (Fig. 6), similarly to the FS determined in the underdoped regime. The relevance of this approach is that, once a RFS has been determined, it is also possible to identify a ‘gap’ along its contour (in addition to the Mott gap), and try to compare it to the high energy pseudogap of the underdoped systems. As reported by Ronning et al. [64], the ‘high energy’ pseudogap (given by the position of the broad peak indicated by arrows in Fig. 5b) shows -wave symmetry not only in the underdoped systems but also in the undoped insulator. This is shown in Fig. 5a where the dispersion of the high energy pseudogap along the FS (RFS for CCOC) is plotted against the -wave functional form (a fit for CCOC is also shown, whereas the other lines are only guides to the eye). Although their sizes vary, the superconducting gap, the pseudogap of the underdoped system, and the gap of the insulator have the same nontrivial -wave form, suggesting a common origin [74]. This is consistent with the idea of one underlying symmetry principle [i.e., SO(5)] that unifies the AF insulating state and the -wave superconducting state [75].
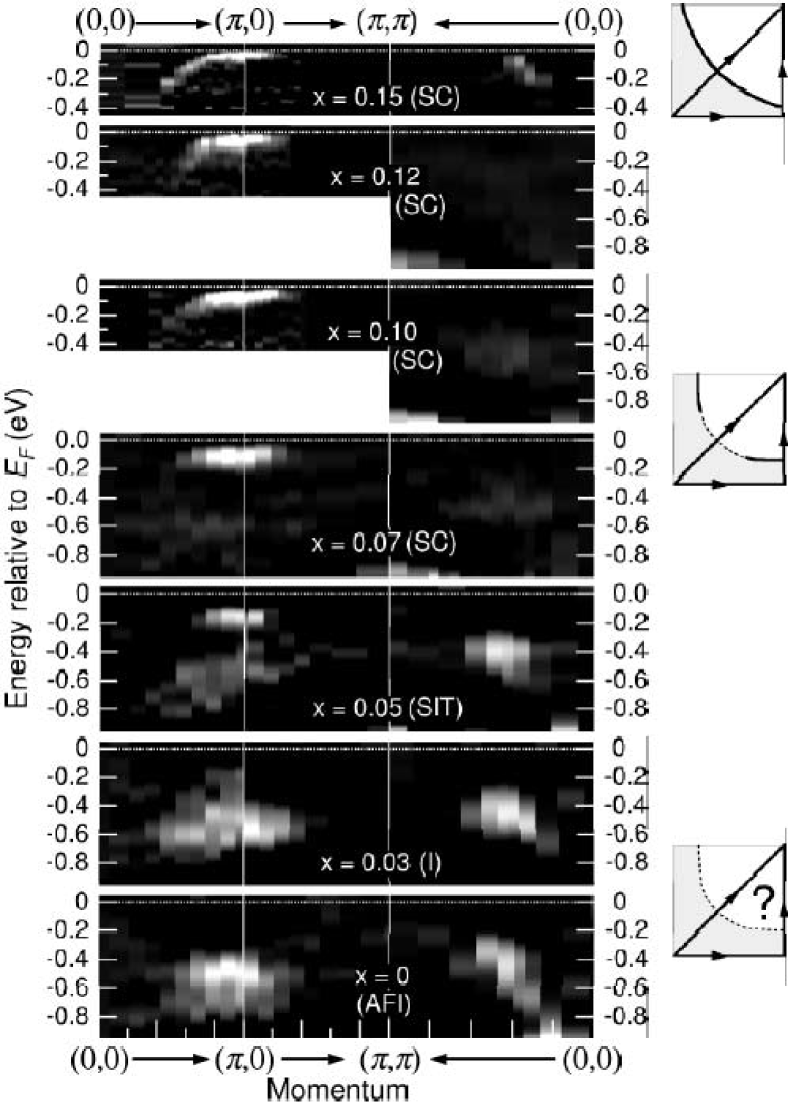
4 Evolution of the electronic structure
The work on the undoped insulator provides a starting point to understand the doping evolution of the electronic structure of the cuprates. Upon doping the system, AF correlations are reduced and a metallic state appears. Eventually (i.e., in the optimum and overdoped regime), the AF state is destroyed and a large LDA-like FS appears [12], with a volume which scales as (), counting electrons ( is the concentration of doped holes for p-type HTSCs), as expected within the FL approach. In this context, the first important question to answer concerns the way the low energy states emerge in the underdoped regime. For , two alternative scenarios have been proposed (see Fig. 7 for hole doping): (i) the chemical potential is pinned inside the charge-transfer gap , as ‘in-gap states’ are created [76] (Fig. 7b); (ii) the chemical potential moves downwards into the top of the valence band and states are transferred from the UHB to the LHB because of correlations [77] (Fig. 7c). Another relevant question is how the low-lying states evolve from underdoped to overdoped regime, where FL behavior seems to recover [12]. To better organize the discussion, let us layout some relevant theoretical models. They can be classified as: (i) those that preserve the underlying crystalline symmetry; (ii) those that break this symmetry. Note that also those scenarios based on a dynamical breaking of symmetry should be taken into account because ARPES is sensitive to the latter, due to the relatively high excitation energy.
The first models to be mentioned among (i) are the FL and band structure perspectives [78, 79], which sever the connection to the undoped AF insulator by assuming that the screening in the doped metal is strong enough for the FL formalism to recover; in this case a well defined FS is expected (Fig. 8a), with a volume proportional to (). An alternative scenario considers the breakdown of FL theory due to umklapp scattering [80]. As a consequence, in the underdoped region of the phase diagram, the FS is truncated near the saddle points at (,0) and (0,) because of the opening of spin and charge gaps. This results in four disconnected arcs of FS centered at (/2,/2), as shown in Fig. 8b. In agreement with a generalized form of Luttinger’s theorem, the area defined by the four arcs and by the umklapp gapped FS (dashed lines in Fig. 8b) encloses the full electron density.
Among the broken-symmetry models, we find the RVB/flux-phase approach [35, 36, 37, 38, 39, 40] that predicts a FS given by four hole-pockets close to (/2,/2), as in Fig. 8c, which continuously evolve into a large FS upon increasing the hole concentration. This is in a very similar spirit to that of the spin-density wave picture which also assumes a dynamical breaking of symmetry [81]. Another model belonging to (ii) is the stripe picture [48], which yields a momentum-space distribution of low-lying excitations. These are represented by the black patches in Fig. 8d, where the results obtained for an equal number of vertical and horizontal domains of disordered stripes are qualitatively sketched (in this case the physics, together with the superposition of domains, conspires to give the appearance of a large LDA-like FS).
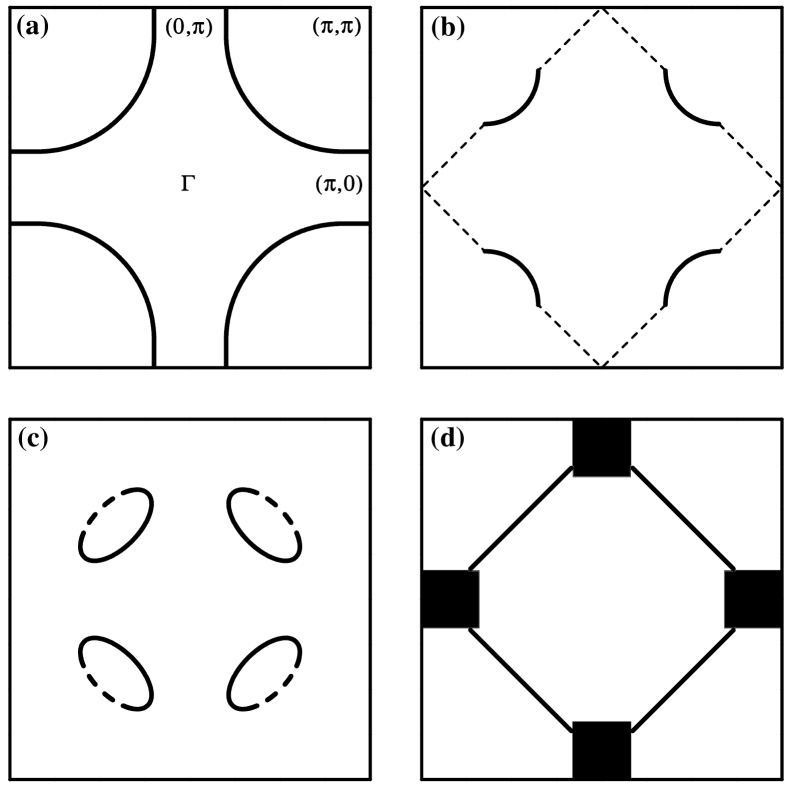
There is actually another meaningful way to differentiate the four models discussed above: those depicted in Fig. 8a, 8b, and 8c assume that the system is spatially uniform (as far as Fig. 8b is concerned, one could talk about phase separation between insulating spin-liquid and metallic regions, but only in momentum space [80]). To the contrary, the model in Fig. 8d assumes that the system is spatially non-uniform: the formation of stripes is defined as the segregation of charge carriers into 1D domain walls which separate AF spin domains in antiphase with each other, and here, in particular, disordered stripes are considered [48, 82].
Each of the above discussed pictures captures some aspects of the experimental reality. In the course of the paper, we will try to compare ARPES data from various systems with the results of these models, aiming to identify the scenario that has the best overlap with experimental observations. This will also help us to answer the question whether different materials would favor different scenarios, and to address the relevance of degrees of freedom other than the electronic ones (e.g., lattice degrees of freedom in the case of the stripe instability).
4.1 La2-xSrxCuO4
In order to study the doping evolution of the low-energy electronic properties over the full doping range, in particular in the vicinity of the metal-insulator transition (MIT), the most suitable system is LSCO. The hole concentration in the CuO2 plane can be controlled and determined by the Sr content , from the undoped insulator () to the heavily overdoped metal (). In addition, LSCO has a simple crystal structure with a single CuO2 layer, and no complications due to superstructure and shadow bands, as in the case of Bi2212 [12]. Another interesting aspect is the suppression of at which, together with the incommensurate AF long-range order observed in inelastic neutron scattering [83], has been discussed as evidence for fluctuating stripes in LSCO (similar AF order accompanied by charge ordering has been interpreted as a realization of ‘static stripes’ in La1.48Nd0.4Sr0.12CuO4 [82]).
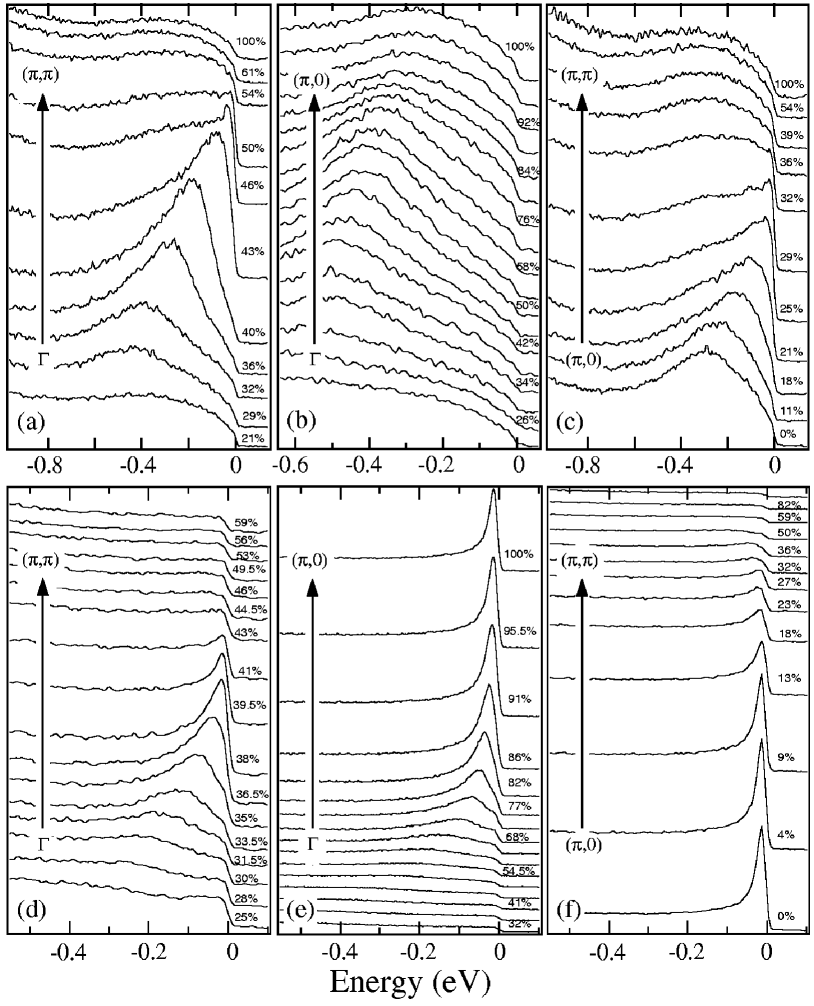
Let us start from the low doping region, near the MIT boundary. Fig. 9 presents the ARPES spectra at (,0) and (/2,/2) as a function of doping, reported by Ino et al. [84]. The data was recorded under identical experimental geometry so that the photoionization matrix elements are the same. For the insulating samples (), the data is characterized by a high binding energy (BE) feature [ eV at (,), and eV at (,0)], and is consistent with what we have discussed in the last section for insulating SCOC [19, 21], albeit the features are now broader. The remarkable result is that for two features can be identified in the EDC at (,0): in addition to the high BE one, reminiscent of the ZR singlet band of the AF insulator, a second shoulder is observable close to . Upon further doping the system with holes, a systematic transfer of spectral weight from the high-BE to the low-BE feature takes place, and a well-defined QP peak develops near optimal doping. On the other hand, the results obtained at (,) are very different: first of all, the data shows an overall suppression of weight as compared to (,0) [the EDCs plotted in Fig. 9 for (,) have been multiplied by a factor of 2]; second, in the nodal region [i.e., along (0,0)-(,)], a QP peak is observable only for [84]. As we will discuss later, with different experimental geometries more spectral weight is detected in the nodal region, but the overall trend of the doping dependence of the electronic structure is robust.
The overall dispersion of the spectral features seen in LSCO and their doping dependence is summarized by the plot of the second derivative (taken with respect to the energy) of the ARPES spectra presented in Fig. 10. Upon increasing the doping level, we can clearly observe the building of near- weight first at (,0), and then at (/2,/2). Furthermore, the second derivative emphasizes the presence of the high-BE feature in the heavily underdoped samples (coexisting with the low BE one, at least for ), which has a meV lower BE at (/2,/2) than at (,0), in agreement with what is observed on the undoped insulator SCOC [19].
The ARPES results from LSCO, in particular the presence of two electronic components and the fact that the low BE feature emerges first at (,0) and then at (/2,/2), suggest that the effects of doping on the electronic structure of the correlated insulator cannot be accounted for by a simple shift of the Fermi level in a rigid band model [84]. In fact, in the latter case the lowest excitations would first appear at (/2,/2). This argument is in agreement with another observation by Ino et al. [85]: from the analysis of direct and inverse angle-integrated photoemission spectra, they concluded that the chemical potential is pinned inside the charge-transfer gap for , and starts shifting downwards only for . All the above results seem to indicate that in-gap states are created upon doping the insulator (Fig. 7b).
Ino et al. argued that the ARPES results from LSCO may be understood within the stripe picture [84]. This would explain the pinning of the chemical potential for as a consequence of the segregation of doped holes into metallic domain walls, which corresponds to the appearance of in-gap states. Furthermore, the suppression of nodal intensity at would be a direct consequence of the vertical and horizontal orientation of the metallic stripes (domains are expected for this microscopic phase separation) [51]. Here the conjecture is that charge fluctuations would be suppressed along directions crossing the stripes, and is supported by finite-size cluster calculations [51]. The sudden increase of weight for in the nodal region may indicate that above this doping level the holes overflow from the saturated stripes.
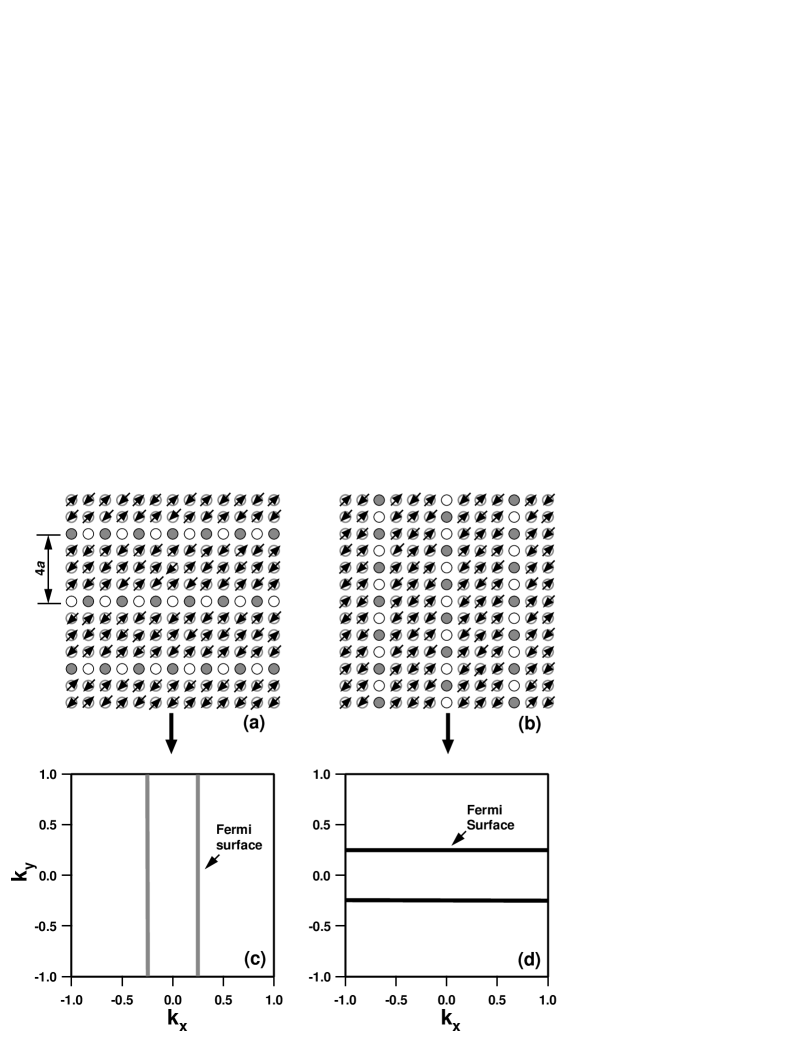
Concerning the relevancy of the stripe scenario to the ARPES data from HTSCs, more insights could come from the investigation of Nd-LSCO, a model compound for which the evidence of spin and charge stripe-ordering is the strongest [82]. High momentum resolution ARPES data on La1.28Nd0.6Sr0.12CuO4 were recently reported by Zhou et al. [86], and are shown in Fig. 11, where spectral weight maps obtained by integrating the EDCs over 100 and 500 meV energy windows below are presented (Fig. 11a and 11b, respectively). The data was symmetrized in accordance with the four fold symmetry of the BZ [note that the symmetry with respect to the (0,0)-(,) line is directly observed in the raw data taken, in the same experimental geometry, over a whole quadrant of the BZ]. The low-energy spectral weight is mostly concentrated in a narrow region along the (0,0)-(,0) direction, which is confined between lines crossing the axes at [86].
The high intensity area of the BZ in Fig. 11b, which is suggestive of almost perfectly nested 1D FS segments, is consistent with the 1/8 doping level of the system. Zhou et al. [86] interpret these results as a signature of a 1D electronic structure related to the presence of static stripes. As indicated by neutron and x-ray experiments [82], at 1/8 doping the 1/4-filled charge stripes are separated by AF domains with a periodicity of 4 (Fig. 12), where is the lattice parameter. This picture is also consistent with various theoretical calculations [50, 53, 55]. In particular, the preponderance of low lying excitations at (,0), which is observable in Fig. 11a, is consistent with calculations for disordered stripes like, e.g., those summarized in Fig. 8d [48, 56]. Concerning the macroscopic orientation of the stripes, two orthogonal domains are expected, as shown in Fig. 12a and 12b. For each domain the FS consists of straight lines perpendicular to the direction of the charge stripe itself, and intersecting the axes of the BZ at (Fig. 12c and 12d). The intensity distribution observed in Fig. 11b, would then result from the superposition of two perpendicular FSs reflecting the presence of orthogonal domains.
The above interpretation of the ARPES data on Nd-LSCO would also provide a possible explanation for the origin of the two components seen in the ARPES spectra of LSCO near the MIT boundary (Fig. 9). In the static picture discussed above, the signal from the AF insulating regions would be pushed to high BE because of the Mott gap, whereas the charge stripes would be responsible for the component near . In this sense, the stripe interpretation is rather appealing. On the other hand, the picture discussed in [86] is based on the assumption of an extreme charge disproportionation which is usually not found in charge ordering transitions, even in lower symmetry systems such as ladders [87]. Nevertheless, the qualitative picture presented in Fig. 12 may capture the relevant physics even for a less extreme case of charge disproportionation.
There are also some results which cannot be satisfactorily explained within the framework of static stripes. For example, in both LSCO (Fig. 10) and Nd-LSCO [86], the QP band along the (0,0)-(,0) direction is characterized by a considerably fast dispersion, contrary to what is expected for an ideal 1D system which typically does not exhibit any dispersion perpendicularly to its main axis. Furthermore, matrix element effects have to be cautiously considered when interpreting ARPES data, especially in dealing with the integrated spectral weight. In fact, although the integration of the EDCs over a large energy window gives an estimate for the momentum-dependent occupation number , the latter quantity is weighted by the photoionization cross section and thus may contain extrinsic artifacts [88].
In order to gain more insight into this issue, in particular in relation to the straight segments of FS observed in Nd-LSCO and to the suppression of the nodal state, Zhou et al. [89] extended the measurements to the second zone, and varied polarization and orientation of the incoming electric field to enhance the spectral intensity in the (/2,/2) region. As a result, the presence of the nested segments of FS near (,0) and (0,) was confirmed. On the other hand, appreciable spectral weight at the Fermi level was found in the nodal region [89], which appears to become more intense upon increasing the Sr concentration in both Nd-LSCO and LSCO, and is stronger in Nd-free LSCO for a given Sr content [89]. A possible way of understanding these results within the stripe context, as suggested by Zhou et al. [89], is that the nodal state and the dispersion along (0,0)-(,0) may arise from disorder or fluctuation of the stripes, where the holes leak into the AF regions [48]. As a matter of fact, the detected FS [89], which is composed by straight patches at (,0) and (0,) connected by ‘nodal segments’, closely resembles the one depicted in Fig. 8d. Alternatively, this experimental FS may result from the coexistence of site-centered and bond-centered stripes [56]. Both of these scenarios suggest that the charge disproportionation is not extreme, as also indicated by dynamical mean-field calculations [54].
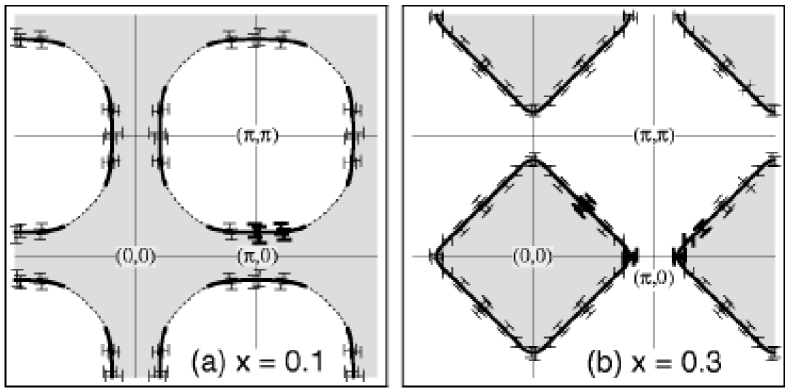
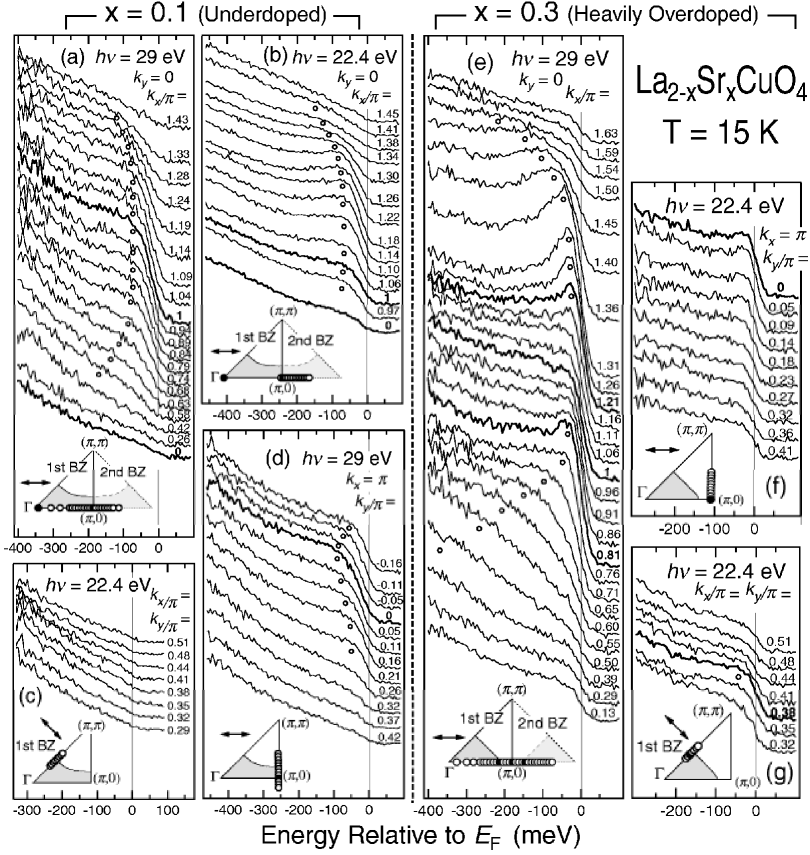
Lastly, it was noted that this composite FS has the appearance of a large LDA-like FS [89], like the one depicted in Fig. 8a. Because of disorder and the fact that the charge disproportionation is less than in the idealized stripe model of Fig. 12, one may still talk about the FS as the locus of low-lying excitations in -space. This is particularly true for highly doped cases as the stripe effect should disappear. This existence of a FS in a striped system is found to be true in both cluster perturbation theory [56] and dynamical mean-filed type of calculations [48]. It is then meaningful to discuss the doping evolution of this LDA-like FS. ARPES spectra for underdoped () and overdoped () LSCO, reported by Ino et al. [90], are shown in Fig. 13. Note that the spectral features tend to be broad, which may be related to charge inhomogeneity. Nevertheless, some Fermi crossings are still observable in part of the BZ, especially in overdoped samples. For , along the direction (0,0)-(,0)-(2,0) at 29 eV photon energy (Fig. 13a), a broad QP peak emerges from the background, disperses towards without crossing it, and then pulls back in the second BZ. Similar results are obtained at 22.4 eV (Fig. 13b), the only difference being a decrease of intensity in the first BZ due to matrix element effects specific to this photon energy [90]. Along (,0)-(,) the QP peak (Fig. 13d), with maximum binding energy (BE) at (,0), disperses almost up to , loses intensity, and disappears. The leading-edge midpoint never reaches because of the superconducting gap ( meV) opening along the FS at this temperature. In this case, the underlying FS is identified by the locus of the minimum gap [91], located here at (,0.2). Along the nodal direction no clear peak can be identified (Fig. 13c), as discussed above. However, having detected a band below at (,0), the authors conclude that for the FS of LSCO is hole-like in character and centered at (,), as shown in Fig. 14a [90].
By comparing the EDCs from heavily overdoped and underdoped LSCO (Fig. 13e and 13a, respectively), we see a striking difference: for the QP peak present along this cut has almost disappeared at (,0). The decrease of intensity, together with a leading-edge midpoint now located above , provides evidence for the QP peak crossing just before (,0). The FS thus determined for heavily overdoped LSCO (Fig. 14b) is electron-like in character and is centered at (0,0). Furthermore, careful investigations by Ino et al. [92] and Zhou et al. [89] show that the FS changes from hole-like to electron-like for - 0.2.
In summary, what has emerged from the study of the LSCO system is a very complex and intriguing picture, characterized by some contrasting aspects: neither a simple stripe model, nor any of other models proposed in Fig. 8 can provide a satisfactory explanation for the complete body of available data. As we have discussed, the stripe picture, when disorder/fluctuations and more realistic charge disproportion are considered, has the advantage of qualitatively explaining the data over the entire doping range, including the presence of two electronic components, the straight FS segments, and the lack of a chemical potential shift in the very underdoped regime. On the other hand, on a more quantitative level, there are still many open questions. On the experimental side, two issues should be carefully considered. The first one is the role of matrix element effects. In fact, ab initio calculations of matrix elements are still unavailable for LSCO, and the tight binding fits do not reproduce the results to a satisfactory degree. Therefore, the most robust information at present may come from the analysis of the systematic changes observed in data recorded under identical experimental conditions (e.g, as the doping dependence studies discussed in this section). Second, the system may consists of metallic stripes aligned along both [1,0] and [1,1], and characterized by smaller and larger charge disproportionation, respectively. If, on the one hand, this scenario might explain the photoemission data, on the other hand the coexistence of two phases is observed only near 5% doping. On the theoretical side, it is unclear how the quasi-1D electronic structure of the stripe phase can be smoothly connected to the 2D electronic behavior of the overdoped regime. Although more effort has to be invested in the study of the electronic properties of charge-ordered systems and, in particular, in investigating the role of the electron-lattice interaction, encouraging numerical studies were recently reported [54, 56], which suggest that the spectral properties of this materials show a non trivial superposition of 2D AF and 1D metallic behavior. In particular, the dispersion observed in ARPES perpendicular to the stripe direction would stem from the AF domains [54, 56].
4.2 Bi2Sr2CaCu2O8+δ
In proceeding with the comparative study of the cuprates, let us now turn our attention to Bi2212 which is the HTSC system most intensively investigated by ARPES (thanks to the presence of a natural cleavage plane between the BiO layers). Due to sample quality issues, most of the Bi2212 experiments were carried out near optimal doping, and there is almost no information on the electronic structure near the MIT boundary. Here we concentrate on cases with a doping of 10% or higher. Therefore, we cannot answer the question whether the two-component electronic structure observed in the LSCO system with a doping of 5-7% is also present in Bi2212 cases. It is still an open question as to how the metallic state emerges in this system.
Bi2212 can also be considered as the most debated HTSC system as far as ARPES is concerned, because of the complexity of the electronic structure near (,0). These complications arise from the detection of additional features besides those related to the primary electronic structure: ‘shadow bands’ (possibly reflecting AF correlations [93] or the presence of two formula units per unit cell [12]), and ‘umklapp bands’ (due to the diffraction of the photoelectrons from the superstructure present in the BiO layers [94]). As a result, around (,0) two main bands, two shadow bands, and four umklapp bands cross the Fermi level. One additional problem with Bi2212 is that there are no reliable band calculations: all theoretical results predicted a BiO FS that has never been observed [12]. In the following, we will discuss the current understanding of these and other more recent issues of the investigation of Bi2212 and its electronic properties.
4.2.1 Fermi surface
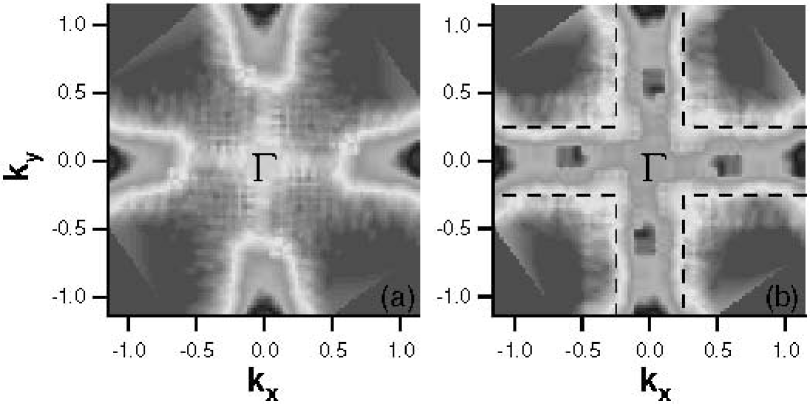
After an initial debate, a consensus has been reached concerning the absence of the BiO pocket, which was predicted for Bi2212 by band structure calculations. Furthermore, the general consensus is in favor of a hole-like FS centered at (,), with a volume consistent with the electron density in accordance with the Luttinger theorem [12, 93, 94]. In contrast to an earlier study that suggested the presence of an electron-like FS due to bilayer splitting [95], it was argued that there is no conclusive evidence for this effect [94]. For a period of time, the hole-like FS was believed to be the only FS feature in Bi2212 [96, 97, 98, 99] over the doping range going from underdoped to overdoped samples (15 K and 67 K, respectively). These conclusions seem to be in contrast with the case of LSCO, where a crossover from a hole to electron-like FS is clearly evident near optimal doping [90, 92]. Recently, other reports questioned this picture, arguing that one simple hole-like FS may not be a complete characterization of the low-lying excitations in Bi2212 [100, 101, 102]. These studies suggested an electron-like FS centered at the -point [101, 102] or, possibly, two co-existing electronic components, resulting in electron and hole-like FSs [100]. These suggestions were opposed by other groups which claimed that only one hole-like FS is supported by the ARPES data once the effects of the photon energy dependence of the matrix elements in the (,0) region are taken into account [103, 104, 105, 106].
To better illustrate the problems discussed above, we show in Fig. 15a the FS of optimally doped Bi2212 determined by integrating over a 7 meV window about the EDCs taken with unpolarized HeI radiation (from [107]). The data have been measured on a whole quadrant of the BZ to verify the symmetry between (,0) and (0,), and then have been symmetrized with respect to the (0,0)-(,) line to compensate for the different data sampling along horizontal and vertical directions. Inspection of the EDCs shows a Fermi crossing in going from (,0) to (,), although the band is very flat [95], and from (0,0) to (,), in agreement with the picture of a hole-like FS centered at (,). The latter is observable in the intensity map of Fig. 15a together with the two ghost FSs due to the umklapp bands and located on each side of the primary FS. In Fig. 15a we can also observe a considerable amount of weight around (,0). Because of the complexity of the EDCs in this region and the absence of a clear drop in intensity along (0,0)-(,0), one cannot make strong statements concerning an electron-like FS.
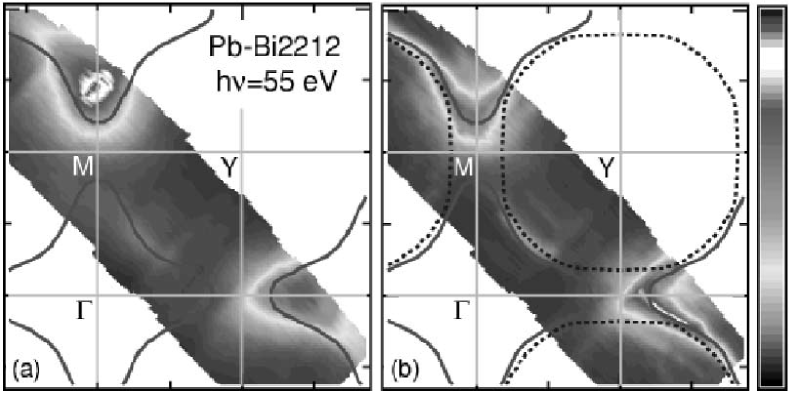
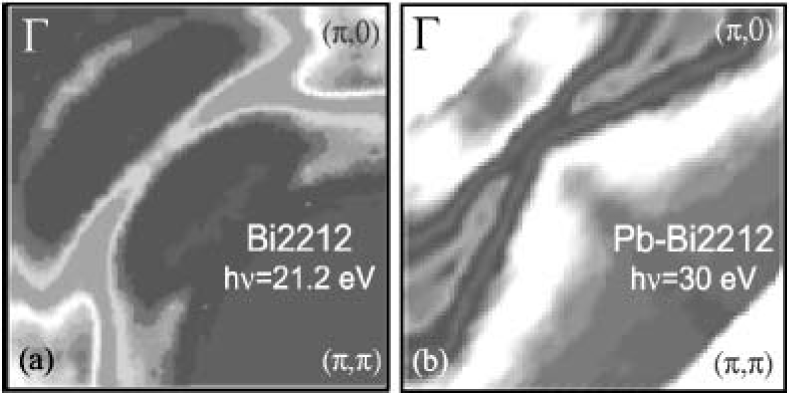
In relation to a possible electron-like topology of the Bi2212 FS in the overdoped regime, interesting results have been very recently reported by Bogdanov et al. [108, 109]. The authors performed a detailed study of the FS topology in slightly overdoped Pb-Bi2212 (=82.5 K). The advantage of working on Pb-doped Bi2212 is that Pb substitutes into the BiO planes, suppressing the superstructure and therefore the complications related to the umklapp bands at (,0). As shown by the mapping presented in Fig. 15b [108], this system represents a strong case for an electron-like FS: in going from (0,0) to (,0), a decrease of intensity, corresponding to a Fermi crossing, is now clearly observed near (,0). However, as earlier data on the Pb-doped system by Borisenko et al. [104] were interpreted as evidence for a hole-like FS in Pb-Bi2212 also, and for the universality of the hole-like FS topology in Bi2212, one must examine these results in greater detail. Bogdanov et al. [109], used different methods and photon energies to determine the FS in different BZs (Fig. 16). More than 4000 EDC were collected and normalized by the integrated intensity from a 100 meV window above (i.e., energy and -independent background), to compensate for variation of the photon flux and for the non-uniform response of the detector. The first indication for an electron-like FS was obtained from the analysis of the leading-edge midpoint in the EDCs. The results (independent of the zone) are plotted as solid red lines in Fig. 16. This topology is confirmed by the plot and intensity map (Fig. 16a and 16b, respectively): both the maxima in the map and the steepest intensity drops in the plot overlap with the EDC-derived FS (red lines). Note that the intensity is strongly suppressed in the first zone because of matrix element effects. However, inspection of the EDCs shows that all the features detected in the second BZ are present also in the first, although significantly weaker.
As Pb doping does not modify the CuO2 layer, the FS measured on Bi2212 and Pb-Bi2212 is indicative of the electronic structure of the same CuO2 plane, and should show similar dependence upon hole doping. While the results reported by Bogdanov et al. [108, 109] do not rule out the coexistence of a hole-like FS sheet, which may be apparent under different experimental conditions [103, 104, 105, 106] as shown, for example, in Fig. 15a [107], they suggest that the scenario of a hole-like FS in Bi2212 over the whole doping range is incomplete, and identify a possible similarity between LSCO and Bi2212 along these lines.
Due to the limited doping range investigated, the ARPES results from Bi2212 are insufficient to conclude in favor of any of the four scenarios summarized in Fig. 8. While the FS of optimally doped Bi2212 resembles the one reported in Fig. 8a and 8d, in the underdoped region, due to the opening of the pseudogap along the underlying FS (see next section), the data is reminiscent of the models depicted in Fig. 8b and 8c. The distinction between Fig. 8a and 8d has to be determined on the basis of the behavior near (,0). This issue is probably relevant to the controversy over the FS in the same -space region, and is important in connection to the possible signature of the superfluid density in the ARPES data, as we will elaborate later. The distinction between the models described in Fig. 8b and 8c lies in the detection of the ‘shadow FS’ given by the dashed line in Fig. 8c. Although it has been argued that the case of Fig. 8c does not apply to Bi2212 [96], in contrast to an earlier report [93], no consensus has been reached because, first, the shadow FS may be simply too weak to be seen and, second, this momentum region is complicated by the presence of shadow and umklapp bands.
4.2.2 Pseudogap
Despite the controversy over the topology of the FS, many of the ARPES results are still reliable and the same holds for the qualitative descriptions that were developed on the basis of those results. This is particularly true with regard to a doping dependent study performed under identical experimental conditions. One of these important results is the normal state excitation gap or pseudogap [65, 66, 67]. This feature was first recognized in the photoemission spectra in attempting to connect the Bi2212 data to that from the insulator [110, 65, 66]. An example of the detection of the pseudogap in ARPES spectra is presented in Fig. 5b where, following the idea of Laughlin [34], we compare the data at (,0) as a function of Dy concentration. As the Dy content is increased and the system enters the underdoped regime, the ‘hump’ shifts to high BE, reflecting the opening of a normal state gap. As the size of the pseudogap is rather large and the band dispersion near (,0) is weak, the detection of the pseudogap is relatively insensitive to the FS topology: either FS topology will lead to qualitatively similar conclusions. Hence, the normal state gap and its doping dependence are robust features in the ARPES spectra.
The main characteristics of the pseudogap can be summarized as follows [111]: (i) the effect is strong in underdoped samples, persists to optimal doping, and disappears in overdoped samples [65, 66, 67]. (ii) The gap has two energy scales, with the low energy one being identified by the location of the leading-edge midpoint, and the higher energy one by the position of the hump. The lower energy scale has a -wave like momentum dependence, similar to the one of the superconducting gap, but with a gapless arc near the nodal region. The doping dependence of the two energy scales track each other [66, 97, 98, 112, 113]. (iii) Upon decreasing the hole concentration, the size of the leading-edge pseudogap increases, in contrast to the decreasing of . This provides an important piece of evidence for non-BCS behavior of the superconducting transition in the underdoped regime.
4.2.3 Signature of superfluid density
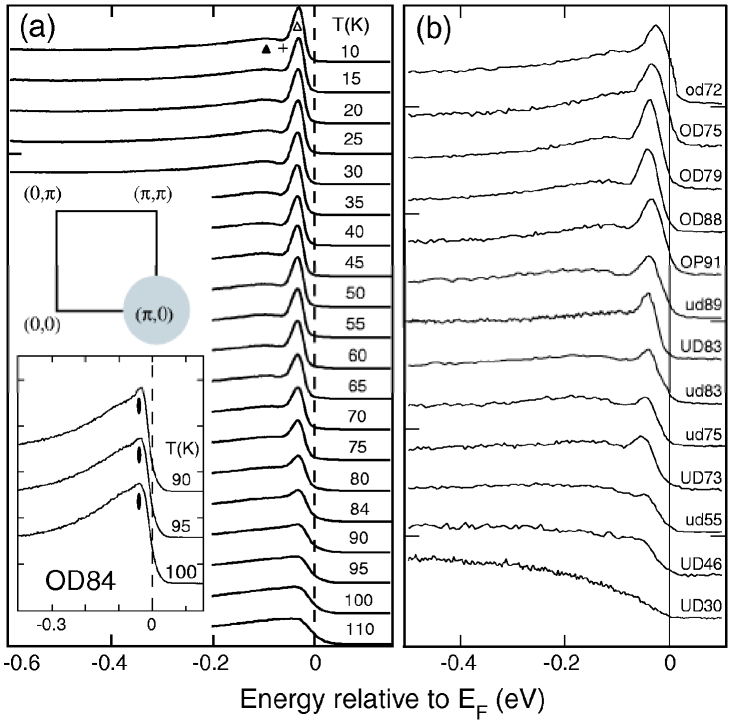
We will now turn our attention to the well-known peak-dip-hump feature [12, 113, 114, 115, 116] detected below in Bi2212, in the region around (,0). In particular, we will discuss the detailed investigation of doping and temperature dependence of this feature, which has been very recently reported by Feng et al. [117]. ARPES spectra from Bi2212 were collected at many different temperatures in the region around (,0), as sketched in Fig. 17a. Note that this average in momentum space, which results in a considerably improved signal-to-noise ratio, does not appreciably alter the -information because the QP dispersion is weak in this region. In Fig. 17a, where EDCs from overdoped Bi2212 with =84 K (thus labeled as OD84) are displayed, we can see the typical peak-dip-hump structure (open triangle, cross, closed triangle, in Fig. 17a). It becomes more pronounced upon reducing the temperature below but it is still visible slightly above , as shown in the inset of Fig. 17a. The results obtained at low temperatures ( K) for different doping levels are displayed in Fig. 17b (UD for underdoped, OP for optimally doped, and OD for overdoped). The peak, not observed in the very underdoped samples, grows with doping and decreases again slightly after optimal doping.
Feng et al. [117], through a phenomenological fitting procedure, were able to quantify the evolution of the peak intensity. In order to extract meaningful and reliable information (i.e., independent of artifacts due to -dependence of matrix elements and/or different experimental conditions for the different samples), the authors focused on the ratio between the relative intensity of the peak and the total spectrum intensity (integrated from -0.5 to 0.1eV). The temperature and doping dependence of this quantity, referred to as the ‘superconducting peak ratio’ (SPR), are presented in Fig. 18a and 18d. From the comparison (Fig. 18) with many superfluid-related quantities measured in Bi2212, YBa2Cu3O7-δ, and LSCO, two major conclusions can be drawn: (i) the remarkable similarity of the data presented in Fig. 18 strongly suggests a universality in the superconducting properties of the cuprates; (ii) ARPES, which mainly probes single-particle excitations of the condensate and therefore directly measures the strength of the pairing (i.e., superconducting gap), can also provide information on the phase coherence of the superconducting state (usually inferred from those techniques which directly probe the collective motion of the condensate).
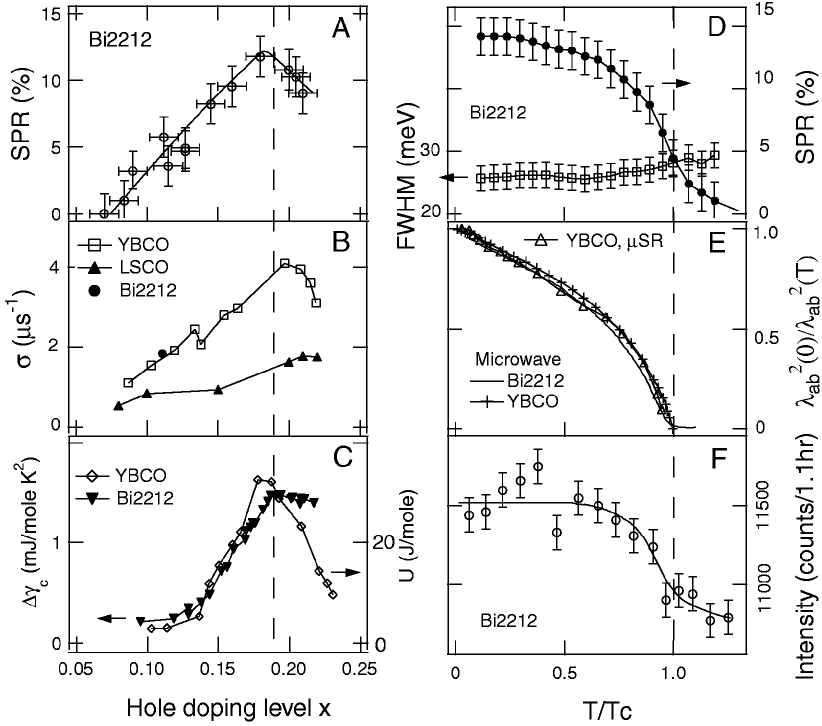
This latter point is shown, as a function of hole concentration, by the remarkable resemblance of the SPR to the superfluid density () measured by SR (Fig. 18b), the condensation energy from the specific heat, and the jump in the specific heat coefficient (Fig. 18c). In addition, upon increasing temperature the SPR decreases in a way similar to , as measured by microwave and SR spectroscopy (Fig. 18d and 18e), with an abrupt drop near (disappearance of the phase coherence), rather than at (opening of the pseudo-gap in the underdoped regime).
As emphasized by Feng et al. [117], the sensitivity of ARPES as well as of neutron experiments to the superconducting condensate fraction [125], and the dependence of the SPR and additional quantities in Fig. 18, provide direct evidence for the need of an approach beyond FL and BCS theory. For instance, in treating the cuprates within the FL-BCS framework, the coherence factor dictates that the QP spectral weight depends on the magnitude of the energy-gap opened on the normal-state FS, and the gap magnitude, as experimentally determined by ARPES, scales as (). To the contrary, the SPR grows with in the underdoped region, and only in the overdoped regime does the SPR scale as (), possibly indicating a crossover to a more conventional FL behavior.
As discussed by Feng et al. [117], there is no unique interpretation for the observed phenomena. A possible explanation for the -dependence of the SPR can be provided by the stripe model, similarly to what was discussed for LSCO. A calculation [126] within this approach well reproduces the observed T-dependence of the superfluid density, and identifies in the weight of the superconducting peak a measure of the phase coherence established in the 1D-2D crossover that, in the stripe picture, accompanies the superconducting transition. Alternatively, the nonmonotonic doping dependence of the SPR could be a manifestation of a composite QP within the RVB approach [9, 34, 35, 36, 37, 38, 39, 40, 42, 43, 44, 45], or of competing orders nearby a quantum critical point, where at a quantum phase transition occurs, driven by quantum rather than thermal fluctuations.
4.2.4 Quasiparticle self energy
Recently, detailed ARPES studies of the single particle self energy have been reported [127, 128, 129, 130]. These investigations are extremely relevant because ARPES can measure both the real (renormalized QP energy) and imaginary (inverse QP lifetime) parts of , providing information on the many-body character of the electronic excitations [127]. In the following, we will in particular focus on the results obtained for Bi2212 in the nodal region, where Valla et al. [128] found that the QP peak width shows a linear T-dependence (independent of , at small BE), and a linear -dependence (independent of T, at large BE). No change in this behavior was found across (as may be expected on the basis of DC resistivity), which excludes scattering-mediated decay for the QP, contrary to the FL case. Valla et al. [128] argue that the observed scaling behavior is suggestive of a nearby quantum critical point.
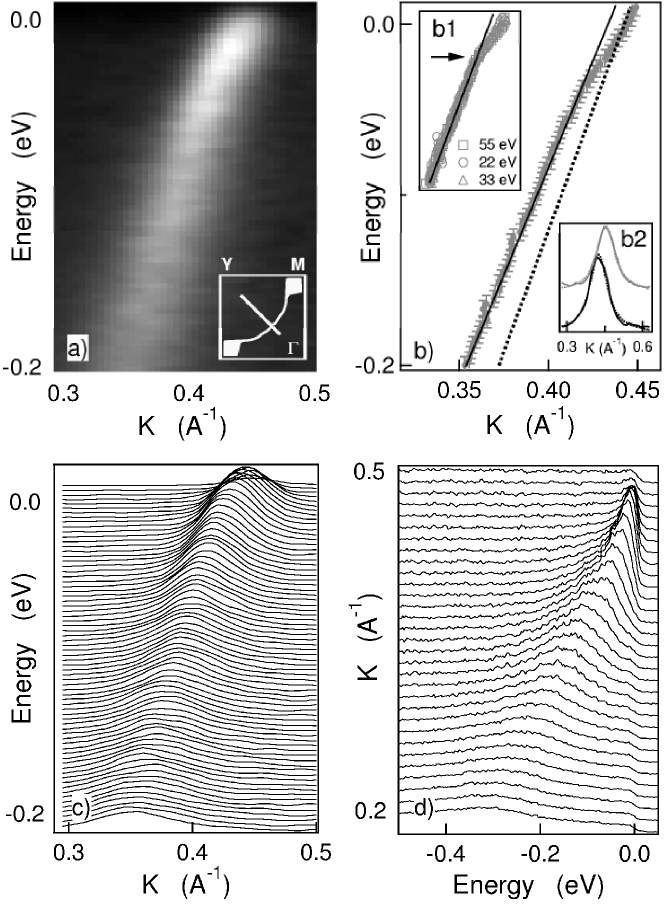
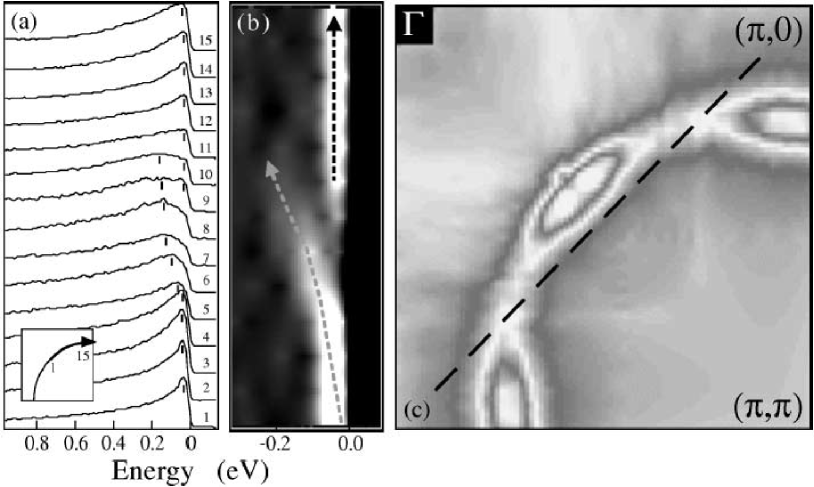
However, evidence for an additional energy scale in the QP self energy was later reported by two other groups [129, 130]. In particular, from the analysis of energy and momentum distribution curves (MDCs), Bogdanov et al. [129] found a kink at meV in the QP dispersion (Fig. 19), contrary to the linear dispersion predicted by LDA calculations. The kink appears to be at the same BE along all directions in the BZ, and more pronounced at low temperatures (with only a weak residual effect above ). In addition, a drop in the low-energy scattering rate (related to the kink) was found from the BE-dependence of the inverse QP lifetime. Explanations proposed for this effect are electron-phonon coupling, coupling to the neutron (,) mode, and stripes [129, 130, 131]. Among them the phonon scenario, which is the most straightforward interpretation, might also be the most plausible one. In fact, similar data has been obtained on systems characterized by strong electron-phonon coupling [132, 133].
At this stage no consensus has been reached on the above results which have nonetheless opened a very promising direction in the study of HTSCs. The information one can gain from the study of the self energy (in particular, the presence or absence of extraneous energy scales in the electronic self energy) is essential in addressing the recent claim that the HTSCs are the realization of a system where many-body correlations are so strong that the electronic properties are not affected by conventional sources of scattering (e.g., defects, impurities and thermal fluctuations) which can only perturb the dynamics of individual particles [43, 134].
4.3 Nd2-xCexCuO4
As the final section of this discussion on the doping evolution of the low energy electronic properties of the cuprates, we will focus on the n-type superconductor NCCO. The relevance of a comparative study of n and p-type HTSCs is that of a verification of the symmetry, or lack thereof, between doping the AF insulator with electrons or holes. This issue has important theoretical implications because most models which are thought to capture the essence of high- superconductivity implicitly assume electron-hole symmetry [135].
High energy and momentum resolution ARPES data on Nd1.85Ce0.15CuO4 has been recently reported by Armitage et al. [135, 136]. EDCs measured on NCCO along the high symmetry lines in the BZ are shown in Fig. 20 (top panels) together with, for comparison purposes, analogous spectra from single-plane slightly-overdoped Bi1.7Pb0.3Sr2CuO6+δ (Pb-Bi2201), whose behavior is generic to the p-type compounds (bottom panels). Along the (0,0)-(,) direction, NCCO and Pb-Bi2201 show a dispersion which is ubiquitous among the cuprates, with a QP peak dispersing quickly towards and crossing it at about (/2,/2). The exact crossing position varies with the band filling, as shown also by the data in Fig. 20a and 20d. Along (0,0)-(,0), however, the two systems show a clear difference: while the low energy feature in Pb-Bi2201 disperses close to and around (,0) forms a flat band just below , in NCCO the flat band is located at 300 meV below (Fig. 20b and 20e).
Along (,0)-(,), the peak disperses to without the same pronounced sharpening that occurs along the zone diagonal. Moreover, in all spectra from momentum space points well above the FS, a relatively large non-dispersive background characterized by a broad maximum near 300 meV is observed.
In Fig. 21c, the intensity map obtained by integrating the EDCs in a 30 meV window about is shown [135, 136]. The location of the intensity maxima defines a rounded piece of FS centered at (,), and characterized by a volume greater than 1/2 (counting electrons) which is consistent with Luttinger’s theorem. For NCCO there is no signature of the Fermi ‘patches’ observed on the Bi-systems at (,0) which are related to the presence of the large flat band very close to (see, e.g., Fig. 15a which is representative for both the 2212 and 2201 systems). On the other hand, for NCCO distinct regions of reduced intensity are identified along the FS contour near (0.65,0.35) and (0.35,0.65).
The EDCs from along the FS [with the background defined as the signal at (,) subtracted] and their second derivative are presented in Fig. 21a and b, respectively [136]. These spectra cannot be adequately explained by a simple sharp peak at along the entire FS contour. At first glance, they might appear to be describable in terms of two separate features in the low energy electronic structure (marked with ticks in Fig. 21a and arrows in Fig. 21b). The feature at at () appears to pull back towards higher binding energies as one moves around the FS towards (,). As it moves to higher energy it broadens becoming totally incoherent. Closer to () a second feature seems to appear at low energy while the feature at high energy loses spectral weight and disappears. The second derivative of the EDCs (Fig. 21b) highlights a discontinuity in intensity at those Fermi momenta where no sharp QP peak is observed at in the EDCs. Armitage et al. [136] concluded in favor of an alternative description for the lineshape of the EDCs in Fig. 21a: a single feature at which becomes incoherent at the intermediate position. The spectral intensity is suppressed close to because much of the spectral weight is pushed to higher energies [136]. This would be the case, for instance, in the scenario described in Fig. 8b, where the breakdown of FL theory due to umklapp scattering is considered [80], with the difference that in the case of NCCO the FS touches the umklapp surface (dashed line in Fig. 21a) at (0.65,0.35) and (0.35,0.65), instead of (,0) and (0,) as in Fig. 8b. This point of view that the two features are part of a single spectral function is supported by the fact that only a single FS with the expected Luttinger’s volume is observed.
The results obtained on NCCO by Armitage et al. [135, 136] seem to contrast with those from the p-type HTSCs. The differences found in the spectral function of the n and p-type materials seem to indicate that the electron-hole symmetry usually assumed in the theoretical models describing the low-energy properties of the CuO2 plane, might be an oversimplification. In particular, the local character of the electronic states [doped electrons (holes) are thought to occupy Cu (O) sites] which are eliminated by reducing the three bands of the CuO2 plane to one in the single-band Hubbard model, may have to be reconsidered.
5 Discussion and conclusions
To date, the most complete ARPES studies are those on LSCO and Bi2212, because these materials can be investigated over a wide doping range. The LSCO system has been extensively interpreted in the stripe scenario because it provides a possible explanation for many of the experimentally observed features: (i) the two-component electronic structure seen in the very underdoped regime that is suggestive of the creation of new electronic states inside the Mott gap; (ii) the lack of chemical potential shift in the underdoped regime; (iii) the straight FS segments observed under certain experimental geometries that are indicative of 1D electronic behavior and cannot be reconciled with the band-like FS (Fig. 8a). What is also interesting is that the LSCO results seem to suggest a ‘dual nature’ for the low-lying electronic excitations [89]: on the one hand, the data shows the effect of charge ordering as mentioned above. On the other hand, possibly as a consequence of fluctuations, disorder, or incomplete charge disproportionation, it exhibits features that deviate from the simple rigid stripe picture, such as the nodal QP weight and the QP dispersion along directions perpendicular to the stripes. Furthermore,the FS becomes better defined upon increasing doping, and changes from hole-like to electron-like near optimal doping. In Nd-LSCO for a given doping, it also becomes better defined upon decreasing the Nd concentration whose main role is to pin stripe fluctuation. All these observations seem to suggest that, as doping is increased, LSCO becomes more of a band-like system with an LDA-like FS, and the signatures of stripes weaken; near optimal doping, the distinction between the pictures reported in Fig. 8a and 8d would become blurred. As shown recently by Mizokawa et al. [137], the dual electronic structure would also indicate that the electronic properties of a system in the stripe phase are different from those of a truly 1D-chain system, in that the transverse motion is allowed in the stripe case but not in the 1D-chain case.
For the Bi2212 system, on the other hand, there is no extensive and reliable data in the underdoped regime and, in particular, near the MIT boundary. Therefore, those features which have been discussed as possible signatures of a charge ordered state in extremely underdoped LSCO, have not been confirmed so far in the case of Bi2212. However, many other features seen on Bi2212 are very similar to those of LSCO. These include the doping dependence of the (,0) pseudogap, with the leading-edge gap being smaller in LSCO; possibly, the evolution of the FS from hole-like to electron-like with doping [although the results obtained around the more complicated (,0) region are still controversial]; the kink in the dispersion of the QP, which has recently been observed in LSCO and Nd-LSCO as well [89]. In the case of Bi2212, it seems that all the models summarized in Fig. 8 are capable of providing a self-consistent, albeit not unique interpretation. Although the normal state spectra of this material in the underdoped and optimally doped cases are very broad, one can still define a FS that becomes better defined at higher doping levels (see Fig. 8a or Fig. 8b, respectively, for optimally and underdoped regime). On the other hand, the doping dependence of the superconducting peak near (,0), where the SPR scales as contrary to what is expected within the FL approach, favors the models depicted in Fig. 8c and 8d, which include the essential ingredients of the physics of the doped Mott insulator.
At this stage of the research in the HTSCs and their undoped parent compounds, it does not seem possible to firmly conclude in favor of one particular comprehensive theoretical model, in spite of the considerable progress made in recent years. This situation is exemplified by the longstanding puzzle concerning a fundamental question, i.e., how does the doping of a Mott insulator take place (Fig. 7). On the one hand, very recent experimental results [138, 139] favor a scenario based on the shift of the chemical potential to the top of the LHB (or to the bottom of the UHB for the n-type systems). This is in agreement with the results from the --- model for SCOC, which reproduce the substantial deformation of the QP band structure upon doping, and suggest a unifying point of view for both the undoped insulator and the HTSC [28]. On the other hand, in the case of LSCO, the lack of chemical potential shift observed in the underdoped regime [85] and the detection of multiple electronic components [84] support the formation of in-gap states upon doping the system and, consequently, the need for a completely new approach. In order to establish whether the evolution from the Mott insulator to the HTSC is truly accounted for by one of the existing models, or whether a completely different approach is required, these points need to be further clarified.
The results discussed in the course of this review demonstrate that the cuprates are complex materials characterized by many competing degrees of freedom, which lead to different peculiar physical properties coexisting with -wave superconductivity. The signatures of many-body effects seen in the behavior of the superconducting peak detected on Bi2212 at (,0), and the kink in the QP dispersion observed in both Bi2212 and LSCO are providing new experimental clues, whose theoretical importance will likely emerge in the time to come.
6 Acknowledgements
We acknowledge N.P. Armitage, P. Bogdanov, D.L. Feng, Z. Hussain, S.A. Kellar, C. Kim, A. Lanzara, F. Ronning, K.M. Shen, T. Yoshida, and X.J. Zhou for discussions and many useful comments. SSRL is operated by the DOE office of Basic Energy Research, Division of Chemical Sciences. The office’s division of Material Science provided support for this research. The Stanford work is also supported by NSF grant DMR9705210 and ONR grant N00014-98-1-0195.
References
- [1] J.G. Bednorz, K.A. Müller, Z. Phys. B 64 (1986) 189.
- [2] M.K. Wu et al., Phys. Rev. Lett. 58 (1987) 908.
- [3] A. Schilling et al., Nature 363 (1993) 56.
- [4] N.F. Mott, Proc. Phys. Soc. London A 62 (1949) 416; Metal Insulator Transition, Taylor and Francis, London, 1974.
- [5] J. Hubbard, Proc. R. Soc. London A 277 (1964) 237; ibid. A 281 (1964) 401.
- [6] P.W. Anderson, Phys. Rev 115 (1959) 2.
- [7] J. Zaanen, G.A. Sawatzky, J.W. Allen, Phys. Rev. Lett. 55 (1985) 418.
- [8] F.C. Zhang, T.M. Rice, Phys. Rev. B 37 (1988) 3759.
- [9] P.W. Anderson, Science 235 (1987) 1196.
- [10] P.W. Anderson, Phys. Rev 79 (1950) 350.
- [11] E. Dagotto, Rev. Mod. Phys. 66 (1994) 763.
- [12] Z.-X. Shen, D.S. Dessau, Phys. Rep. 253 (1995) 1.
- [13] A.P. Mackenzie et al., Phys. Rev. Lett. 76 (1996) 3786; C. Bergemann et al., Phys. Rev. Lett. 84 (2000) 2662.
- [14] T. Oguchi, Phys. Rev. B 51 (1995) 1385; D.J. Singh, Phys. Rev. B 52 (1995) 1358.
- [15] D.H. Lu et al., Phys. Rev. Lett. 76 (1996) 4845; T. Yokoya et al., Phys. Rev. B 54 (1996) 13 311.
- [16] A.V. Puchkov et al., Phys. Rev. B 58 (1998) R13 322.
- [17] A. Damascelli et al., Phys. Rev. Lett. 85 (2000) 5194; ibid., J. Electron Spectr. Relat. Phenom, in press.
- [18] R. Matzdorf et al., Science 289 (2000) 746.
- [19] B.O. Wells et al., Phys. Rev. Lett. 74 (1995) 964.
- [20] S. LaRosa et al., Phys. Rev. B 56 (1997) R525.
- [21] C. Kim et al., Phys. Rev. Lett. 80 (1998) 4245.
- [22] Z. Liu, E. Manousakis, Phys. Rev. B 45 (1992) 2425.
- [23] M. Greven et al., Phys. Rev. Lett. 72 (1994) 1096.
- [24] A. Nazarenko et al., Phys. Rev. B 51 (1995) 8676.
- [25] B. Kyung, R.A. Ferrel, Phys. Rev. B 54 (1996) 10125.
- [26] T. Xiang, J.M. Wheatley, Phys. Rev. B 54 (1996) R12 653.
- [27] V.I. Belinicher, A.L. Chernyshev, V.A. Shubin, Phys. Rev. B 54 (1996) 14 914.
- [28] R. Eder, Y. Otha, G.A. Sawatzky, Phys. Rev. B 55 (1997) R3414.
- [29] T.K. Lee, C.T. Shih, Phys. Rev. B 55 (1997) 5983.
- [30] F. Lema, A.A. Aligia, Phys. Rev. B 55 (1997) 14092.
- [31] P.W. Leung, B.O. Wells, R.J. Gooding, Phys. Rev. B 56 (1997) 6320.
- [32] O.P. Sushkov et al., Phys. Rev. B 56 (1997) 11769.
- [33] T. Tohyama et al., J. Phys. Soc. Jpn. 69 (2000) 9; ibid., Supercond. Sci. Tech. 13 (2000) R17.
- [34] R.B. Laughlin, Phys. Rev. Lett. 79 (1997) 1726.
- [35] I. Affleck, J.B. Marston, Phys. Rev. B 37 (1988) 3774.
- [36] X.-G. Wen, P.A. Lee, Phys. Rev. Lett. 76 (1996) 503.
- [37] S. Chakravarty et al., cond-mat/0005443.
- [38] S. Maekawa et al., Physica C 152 (1988) 133.
- [39] Y. Suzumura, Y. Hasegawa, H. Fukuyama, J. Phys. Soc. Jpn. 57 (1988) 2768.
- [40] G. Kotliar, J. Liu, Phys. Rev. Lett. 61 (1988) 1784.
- [41] J. Bardeen, L.N. Cooper, J.R. Schrieffer, Phys. Rev. 108 (1957) 1175.
- [42] L.B. Ioffe, A.J. Millis, Phys. Rev. B 54 (1996) 3645.
- [43] P.W. Anderson, cond-mat/0007185 and 0007287.
- [44] L. Balents M.P.A. Fisher, C. Nayak, Int. J. Mod. Phys. B 12 (1998) 1033; ibid., Phys. Rev. B 60 (1999) 1654; ibid., 61 (2000) 6307.
- [45] D.-H. Lee, Phys. Rev. Lett. 84 (2000) 2694.
- [46] J. Zaanen, Science 286 (1999) 251.
- [47] V.J. Emery, S.A. Kivelson, J.M. Tranquada, Proc. Natl. Acad. Sci. U.S.A. 96 (1999) 8814.
- [48] M.I. Salkola, V.J. Emery, S.A. Kivelson, Phys. Rev. Lett. 77 (1996) 155.
- [49] A. Bianconi et al., Phys. Rev. Lett. 76 (1996) 3412.
- [50] M. Ichioka, K. Machida, J Phys. Soc. Jpn. 68 (1999) 4020.
- [51] T. Tohyama et al., Phys. Rev. Lett. 82 (1999) 4910.
- [52] S.R. White, D.J. Scalapino, Phys. Rev. B 61 (2000) 6320.
- [53] R.S. Markiewicz, Phys. Rev. B 62 (2000) 1252.
- [54] M. Fleck et al., Phys. Rev. Lett. 84 (2000) 4962.
- [55] A.L. Chernyshev, A.H.C. Neto, A.R. Bishop, Phys. Rev. Lett. 84 (2000) 4922.
- [56] M.G. Zacher et al., Phys. Rev. Lett. 85 (2000) 2585.
- [57] J.H. Han, Q.-H. Wang, D.-H. Lee, cond-mat/0006046.
- [58] S. Chakravarty, B.I. Halperin, D.R. Nelson, Phys. Rev. B 39 (1989) 2344.
- [59] S. Sachdev, J. Ye, Phys. Rev. Lett. 69 (1992) 2411.
- [60] A. Sokol, D. Pines, Phys. Rev. Lett. 71 (1993) 2813.
- [61] V. J. Emery, S. A. Kivelson, Phys. Rev. Lett. 71 (1993) 3701.
- [62] C. Castellani, C. Di Castro, M. Grilli, Phys. Rev. Lett. 75 (1995) 4650.
- [63] C.M. Varma et al., Phys. Rev. Lett. 63 (1989) 1996; P.B. Littlewood, C.M. Varma, J. Appl. Phys. 69 (1991) 4979; C.M. Varma, Phys. Rev. B 55 (1997) 14 554.
- [64] F. Ronning et al., Science 282 (1998) 2067.
- [65] A.G. Loeser et al., Science 273 (1996) 325;
- [66] D.S. Marshall et al., Phys. Rev. Lett. 76 (1996) 4841;
- [67] H. Ding et al., Nature 382 (1996) 51.
- [68] Z.-X Shen et al., Phys. Rev. Lett. 70 (1993) 1553.
- [69] H. Eskes, R. Eder, Phys. Rev. B 54 (1996) R14 226.
- [70] N. Bulut, D.J. Scalapino, S.R. White, Phys. Rev. Lett. 73 (1994) 748.
- [71] S. Haffner et al., cond-mat/0006366.
- [72] F. Ronning et al., cond-mat/0007252.
- [73] C. Dürr et al., cond-mat/0007283.
- [74] M.G. Zacher et al., Phys. Rev. Lett. 85 (2000) 824.
- [75] S.C. Zhang, Science 275 (1997) 1089.
- [76] J.W. Allen et al., Phys. Rev. Lett. 64 (1990) 595.
- [77] M.A. van Veenendal, G.A. Sawatzky, W.A. Groen, Phys. Rev. B 49 (1994) 1407.
- [78] D. Pines, P. Nozires, The Theory of Quantum Fluids, vol. 1, Addison-Wesley, New York, 1966.
- [79] W.E. Pickett, Rev. Mod. Phys. 61 (1989) 433.
- [80] N. Furukawa, T.M. Rice, M. Salmhofer, Phys. Rev. Lett. 81 (1998) 3195; N. Furukawa, T.M. Rice, J. Phys. Cond. Matt. 10 (1998) L381; C. Honerkamp et al., Phys. Rev. B 63 (2001) 035109.
- [81] A. Kampf, J.R. Schrieffer, Phys. Rev. B 41 (1990) 6399; ibid. 42 (1990) 7967.
- [82] J.M. Tranquada et al., Nature 375 (1995) 561.
- [83] T. Suzuki et al., Phys. Rev. B 57 (1998) R3229.
- [84] A. Ino et al., Phys. Rev. B 62 (2000) 4137.
- [85] A. Ino et al., Phys. Rev. Lett. 79 (1997) 2101.
- [86] X.J. Zhou et al., Science 286 (1999) 268.
- [87] A. Damascelli et al., Phys. Rev. B 61 (2000) 2535; C. Presura et al., Phys. Rev. B 61 (2000) 15 762.
- [88] S. Hüfner, Photoelecron Spectroscopy, Springer-Verlag, Berlin 1995.
- [89] X. J. Zhou et al., cond-mat/0009002.
- [90] A. Ino et al., J. Phys. Soc. Jpn. 68 (1999) 1496.
- [91] J.C. Campuzano et al., Phys. Rev. B 53 (1996) R14 737.
- [92] A. Ino et al., cond-mat/0005370.
- [93] P. Aebi et al., Phys. Rev. Lett. 72 (1994) 2757.
- [94] H. Ding et al., Phys. Rev. Lett. 76 (1996) 1533.
- [95] D.S. Dessau et al., Phys. Rev. Lett. 71 (1993) 2781.
- [96] H. Ding et al., Phys. Rev. Lett. 78 (1997) 2628.
- [97] M.R. Norman et al., Nature 392 (1998) 157.
- [98] P.J. White et al., Phys. Rev. B 54 (1996) R15 669.
- [99] J. Ma et al., Phys. Rev. B 51 (1995) 9271.
- [100] D.L. Feng et al., cond-mat/9908056.
- [101] Y.-D. Chuang et al., Phys. Rev. Lett. 83 (2000) 3717.
- [102] A.D. Gromko et al., cond-mat/0003017.
- [103] H.M. Fretwell et al., Phys. Rev. Lett. 84 (2000) 4449.
- [104] S.V. Borisenko et al., Phys. Rev. Lett. 84 (2000) 4453.
- [105] J. Mesot et al., cond-mat/9910430.
- [106] A. Bansil, M. Lindroos, Phys. Rev. Lett. 83 (1999) 5154.
- [107] D.L. Feng et al., unpublished.
- [108] P.V. Bogdanov et al., unpublished.
- [109] P.V. Bogdanov et al., cond-mat/0005394.
- [110] D.M. King et al., J. Phys. Chem. Sol. 56 (1995) 1865.
- [111] Z.X. Shen, J.M. Harris, A.G. Loeser, Hyperfine Interactions 105 (1997) 13.
- [112] J.M. Harris et al., Phys. Rev. B 54 (1996) R15 665.
- [113] J.C. Campuzano et al., Phys. Rev. Lett. 83 (1999) 3709.
- [114] D.S. Dessau et al., Phys. Rev. Lett. 66 (1991) 2160.
- [115] Y. Hwu et al., Phys. Rev. Lett. 67 (1991) 2573.
- [116] M.R. Norman et al., Phys. Rev. Lett. 79 (1997) 3506.
- [117] D.L. Feng et al., Science 289 (2000) 277.
- [118] J.L. Tallon et al., Phys. Stat. Sol. B 215 (1999) 531.
- [119] Y.J. Uemura et al., Phys. Rev. Lett. 66 (1991) 2665.
- [120] J.L. Tallon, G.V.M. Williams, J. W. Loram, Physica C 338 (2000) 9.
- [121] T. Jacobs et al., Phys. Rev. Lett. 75 (1995) 4516.
- [122] J.E. Sonier et al., Phys. Rev. Lett. 83 (1999) 4156.
- [123] D.A. Bonn et al., Phys. Rev. B 50 (1994) 4051.
- [124] H. He et al., cond-mat/0002013.
- [125] S. Chakravarty, H.-Y. Kee, Phys. Rev. B 61 (2000) 14 821.
- [126] E.W. Carlson et al., Phys. Rev. Lett. 83 (1999) 612.
- [127] M.R. Norman et al., Phys. Rev. B 57 (1998) R11 089; ibid. R11 093; ibid. 60 (1999) 7585.
- [128] T. Valla et al., Science 285 (1999) 2110; ibid., Phys. Rev. Lett. 85 (2000) 828.
- [129] P.V. Bogdanov et al., Phys. Rev. Lett. 85 (2000) 2581.
- [130] A. Kaminski et al., Phys. Rev. Lett. 84 (2000) 1788; ibid., cond-mat/0004482.
- [131] M.R. Norman et al., Phys. Rev. B 61 (2000) 14 742.
- [132] M. Hengsberger et al., Phys. Rev. Lett. 83 (1999) 592; ibid., Phys. Rev. B 60 (1999) 10 796.
- [133] T. Valla et al., Phys. Rev. Lett. 83 (1999) 2085.
- [134] R.B. Laughlin, D. Pines, P. Natl. Acad. Sci. USA 97 (2000) 28.
- [135] N.P. Armitage et al., Physica C 341-348 (2000) 2083.
- [136] N.P. Armitage et al., unpublished.
- [137] T. Mizokawa et al., Phys. Rev. B 60 (1999) 12 335.
- [138] G.A. Sawatzky, private communication.
- [139] F. Ronning, private communication.