Chemical bonding, elasticity, and valence force field models: a case study for -Pt2Si and PtSi
Abstract
We have carried out a detailed study of the chemical bonding for two room-temperature stable platinum silicide phases, tetragonal -Pt2Si and orthorhombic PtSi. An analysis of the valence electronic charge density reveals surprising evidence of covalent three-center bonds in both silicide phases, as well as two-dimensional metallic sheets in -Pt2Si. These elements of the bonding are further analyzed by constructing valence force field models using the results from recent first principles calculations of the six (nine) independent, non-zero elastic constants of -Pt2Si (PtSi). The resulting volume-, radial-, and angular-dependent force constants provide insight into the relative strength of various bonding elements as well as the trends observed in the elastic constants themselves. The valence force field analysis yields quantitative information about the nature of the chemical bonding which is not easily discernable from the more qualitative charge density plots. More generally, this study demonstrates that the detailed variations in the elastic constants of a material contain useful information about the chemical bonds which can be extracted using valence force field models. Inversely, these models also allow identification of specific elements of the chemical bonding with particular trends in the elastic constants, both within a given material and among a class of related materials.
pacs:
PACS 61.50.Lt, 62.20.DcI Introduction
Deposition of metallic platinum silicide compounds on silicon substrates leads to the formation of rectifying junctions, with a Schottky barrier of 220–240 meV (for holes) in the case of orthorhombic PtSi on p-type Si (001).[1, 2] This energy matches an important atmospheric “transparency window” in the infrared region, making these materials well suited to infrared detector applications. PtSi has also been discussed as a promising candidate to replace Ti2Si in polysilicon interconnect applications in sub-half-micron technologies.[3, 4, 5] In light of these and other technological applications, as well as a general paucity of earlier treatments of the fundamental properties of the platinum silicides, there have been two recent in-depth studies of the atomic and electronic structure of two room-temperature stable platinum silicide phases, orthorhombic PtSi and tetragonal -Pt2Si. Beckstein et al.[6] have carried out an extensive set of first principles electronic structure calculations for both materials. In addition to the electronic structure, they have calculated all of the equilibrium structural parameters and zero-pressure elastic constants for both phases. Franco et al.[7] used a combination of photoelectron spectroscopy (PES), soft x-ray emission spectroscopy (SXE), and x-ray absorption spectroscopy (XAS) to study the detailed electronic structure of orthorhombic PtSi. First principles calculations of the partial density of states (PDOS) were also carried out in order to aid in interpreting the experimental spectra.
The present study is complimentary to these two earlier treatments and makes contact with them in a number of ways. The combination of the atomic and electronic structure gives rise to the chemical bonding of a material. The elastic constants and the various experimental spectroscopies reflect the details of this bonding but they do so indirectly. One of the goals here is to directly elucidate the fundamental nature of the chemical bonding in the two silicide phases studied previously. Towards that end we have calculated and analyzed the valence electronic charge density for both silicides. However, this analysis is only qualitative and thus we have made further attempts to gain a more quantitative understanding. The previous first principles study noted a number of interesting trends in the elastic constants, both within a given material and among the two silicides and the pure Pt and pure Si phases.[6] In the present work we analyze these trends in much greater detail and in a more quantitative fashion by constructing valence force field models for all four materials. The models are obtained by fitting the first principles elastic constants while also using insights gained from the charge density analysis to guide the particular choice of radial and angular interactions. In turn, the magnitudes of these various interactions, as obtained from the fits, provide a quantitative measure of the relative importance of different elements of the chemical bonding. In addition, the models can be inverted by expressing the various elastic constants in terms of the volume-, radial-, and angular-dependent interactions. We are thus able to identify the individual trends in the elastic constants with particular elements of the chemical bonding.
In the present work we have two overall goals. The first is to gain a quantitative understanding of the chemical bonding in tetragonal -Pt2Si and orthorhombic PtSi. The second goal is to demonstrate, through a case study of these two silicides as well as pure Pt and pure Si, that in general terms the variations of the elastic constants of a material contain useful information about the chemical bonding and that valence force field models are a convenient means for extracting this information. Moreover, by inverting the models and identifying the chemical interactions responsible for the observed trends in the elastic constants we are thereby able to obtain a more intuitive understanding of the connection between chemical bonding and the mechanical properties of a material. Given this more general goal we have therefore described the construction of the models and the analysis of various elastic constant trends in some detail. Sec. II provides the relevant details regarding the atomic structure for the two platinum silicides studied here and in Sec. III we summarize the previous elastic constant calculations from Ref. [6]. The valence electronic charge densities are analyzed in Sec. IV and the valence force field models are presented in Sec. V. Our results are summarized in Sec. VI.
II Atomic structure
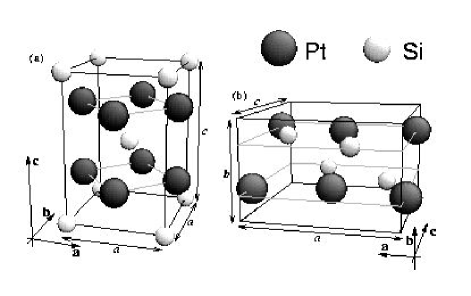
The stable phase of pure Pt at ambient conditions is face-centered cubic (fcc),[8] while for pure Si it is cubic diamond.[9] The conventional unit cells of the two platinum silicides -Pt2Si and PtSi are shown in Fig. 1. The room-temperature ( K) -phase of Pt2Si occurs in the body-centered tetragonal (bct) structure.[10, 11] The Strukturbericht designation is and the space group is (No. 139).[12] The two symmetry-equivalent Pt atoms in the primitive cell occupy Wyckoff 4(d) sites and the one Si atom occupies a 2(a) site. The atom positions are completely determined by the space group symmetry but there are two independent lattice constants and . PtSi has a primitive orthorhombic structure with four symmetry-equivalent Pt atoms occupying Wyckoff 4(c) sites and four symmetry-equivalent Si atoms also occupying 4(c) sites.[13, 14, 15] The Strukturbericht designation for this MnP-type lattice is and the space group is (No. 62).[12] The atom coordinates along the - and -axes are not completely specified by the space group symmetry and thus there are four free internal structural parameters , , , and . The structure also has three independent lattice constants , , and . All of the relevant equilibrium structural parameters for each of these four materials are given in Table I, including both the experimental values and the self-consistent theoretical values calculated from first principles in Ref. [6].
III Elastic constants
Since we will rely heavily on the detailed results of the first principles elastic constant calculations from Ref. [6], we summarize them here. The internal energy of the crystal is expanded to second order in the elements of the strain tensor , using Voigt notation,
| (1) |
where is the volume of the unstrained crystal, the are the components of the applied stress tensor, and the are the second order elastic constants.[6] Since the undistorted crystal was always taken to be the zero-pressure theoretical equilibrium structure, the applied stress components are all zero and so the second term of Eq. (1) did not enter. All of the elastic constant calculations were carried out using the theoretical equilibrium structural parameters listed in Table I.
Crystals with cubic space group symmetry have only three distinct, non-vanishing elastic constants. The theoretical values of these three elastic constants for both pure Pt and pure Si, as obtained in Ref. [6], are listed in Table II together with the corresponding experimental values. The theoretical bulk moduli were obtained from the theoretical elastic constants []. We note that in the case of Si the calculation of required a relaxation of the positions of the Si atoms within the distorted unit cell. The strain-induced symmetry reduction allowed the Si atoms to relax in the direction. Without this relaxation, would have been 108.6 GPa; this is to be compared with the relaxed value of 79.9 GPa and the experimental value of 79.1 GPa.[16] The requirement of mechanical stability in a cubic crystal leads to the following restrictions on the elastic constants[17]
| (2) |
These stability conditions also lead to a restriction on the magnitude of (Ref. [6])
| (3) |
Tetragonal -Pt2Si has six independent and non-zero elastic constants. Three of these elastic constants, , , and , correspond to strain-induced symmetry reductions for which the positions of the Pt atoms are no longer completely fixed by the symmetry. The strain-induced forces drive them into energetically more favorable positions (the corresponding forces on the Si atoms are identically zero by symmetry). The first principles results for the six elastic constants of -Pt2Si are given in Table III. The values labeled as “frozen” correspond to keeping all of the atoms held fixed at the positions determined solely from the strain tensor, while the elastic constants labeled “relaxed” were obtained by relaxing the strain-induced forces on the Pt atoms. The bulk modulus is calculated from the tetragonal elastic constants, , and has the same value in the frozen and relaxed calculations.
The requirement that the crystal be stable against any homogeneous elastic deformation places restrictions on the elastic constants, just as in the cubic case. For tetragonal crystals these mechanical stability restrictions are as follows[17]
| (4) |
These stability conditions again lead to restrictions on the magnitude of (Ref. [6])
| (5) |
There are nine independent and non-zero elastic constants for orthorhombic PtSi. Relaxation of the internal degrees of freedom was necessary in calculating all nine PtSi elastic constants because the atomic positions are not completely fixed by the space group symmetry, even for the unstrained crystal, and consequently there exist free internal parameters (see Table I) which must be redetermined for any distortion of the crystal, including hydrostatic pressure. The results of the calculations are listed in Table III. As in the case of -Pt2Si, the values labeled as “frozen” correspond to calculations in which the internal structural parameters and were held fixed at their self-consistent equilibrium values, while in the “relaxed” calculations these internal structural parameters were recalculated to minimize the energy. The values of are obtained from the elastic constants, . As expected, the relaxed value of is smaller than the frozen value.
Mechanical stability leads to restrictions on the elastic constants, which for orthorhombic crystals are as follows[17]
| (6) |
As in the case of -Pt2Si, we can obtain restrictions on the magnitude of ,
| (7) |
From Tables II and III we see that overall the elastic constants of -Pt2Si and PtSi appear much closer to those of pure Pt as compared to pure Si. The trends of the elastic constants as a function of the atomic percent Pt in all four materials are plotted in Fig. 2. Each of the curves corresponds to an average of a different class of elastic constants, while the symbols show the values of the individual elastic constants themselves. As we see from Eqs. (3), (5) and (7), mechanical stability requires that be larger than the average of , , and but smaller than the average of , , and [note that in the case of -Pt2Si the appropriate averages are and because and for tetragonal crystals]. This stability requirement is reflected in the top three curves in Fig. 2. We also see that these three curves each increase monotonically as a function of atomic percent Pt from pure Si to pure Pt and we note that all three classes of elastic constants represented by these curves correspond to strains in which the volume is not fixed. Conversely, the two lower curves labeled and correspond to the two classes of elastic constants in which the strains are strictly volume-conserving [in the case of PtSi the lowest solid-line curve and large open circles correspond to elastic constant combinations , , and ]. We see that in this case the two sets of averages are approximately constant as a function of atomic percent Pt. The significance of this difference in the trends of volume-conserving versus non-volume-conserving elastic constants is connected to the curve labeled and is discussed in Sec. V along with a general discussion of the relationship between the magnitudes of the various elastic constants and the chemical bonding.
IV Electronic charge density
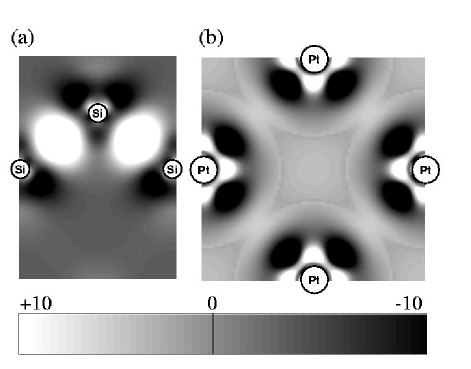
In order to provide insight into the nature of the chemical bonding in -Pt2Si and PtSi we have analyzed the valence electronic charge density in these materials. We have chosen to plot charge density differences, the superposition of free atom densities subtracted from the fully self-consistent crystal density, thus emphasizing the formation of bonds. Since we are using an all-electron method the calculated charge density has a large amplitude close to each of the atomic cores. Subtracting two such large numbers can sometimes produce unusual features in the plots described below, but these are of no consequence to our discussion. Rather we focus on the smoothly varying density differences in between the atomic cores. In all of the gray-scale plots the brighter spots represent an increase in the density relative to superimposed free atoms while the darker spots represent a decrease, with the exact same scale being used in all of the plots.
A FPLMTO method
The valence electronic charge densities were obtained using a full-potential linear muffin-tin orbital (FPLMTO) method[18, 19] which makes no shape approximation for the crystal potential. The crystal is divided up into regions inside atomic spheres, where Schrödinger’s equation is solved numerically, and an interstitial region. The wavefunctions in the interstitial are Hankel functions. An interpolation procedure is used for evaluating interstitial integrals involving products of Hankel functions. The triple- basis is composed of three sets of , , , and LMTOs per atom with Hankel function kinetic energies of = 0.01, 1.0, and 2.3 Ry (48 orbitals per atom). The Hankel functions decay exponentially as . The angular momentum sums involved in the interpolation procedure are carried up to a maximum of = 6. The calculations presented here are based on the local density approximation (LDA), using the exchange-correlation potential of Ceperley and Alder[20] as parameterized by Vosko, Wilk, and Nusair.[21] The scalar-relativistic Schrödinger equation was solved self-consistently. We did not include spin-orbit interactions and we used atomic sphere radii equal to one-half the nearest-neighbor bond lengths. In the case of -Pt2Si we included an empty atomic sphere at the octahedral interstitial site, as well as the usual empty spheres in the interstitial sites of pure cubic-diamond-phase Si. However, these empty spheres do not contribute to the basis but merely improve the accuracy of the interstitial interpolation procedure.
The Pt 6, 6, 5, and 5 orbitals as well as the Si 3, 3, 3, and 4 orbitals were all treated as valence states. The semi-core Pt 5 and 5 orbitals were treated as full band states by carrying out a “two-panel” calculation. The second panel band calculation for the semi-core orbitals included the Pt 5, 5, 5, and 5 orbitals as well as all of the Si valence orbitals. The Brillouin zone (BZ) sums were carried out using the tetrahedron method.[22] We used the same mesh of -points for both the self-consistent total energy and charge density calculations. In the case of -Pt2Si we used a shifted 242424 (121212) mesh in the full BZ, resulting in 1056 (159) irreducible -points in the first (second) panel. In the PtSi calculations we used a shifted 121612 (686) mesh in the full BZ, resulting in 288 (36) irreducible -points in the first (second) panel. A shifted 282828 (161616) mesh in the full BZ was used for fcc Pt, resulting in 2030 (408) irreducible -points in the first (second) panel. Finally, a shifted 121212 mesh in the full BZ was used for cubic-diamond-phase Si, resulting in 182 irreducible -points.
B Pt and Si
We start with the well-known cases of pure diamond-phase Si and fcc Pt in order to provide a baseline with which to compare the results we obtain for the silicides. In Fig. 3(a) we see the localized piling up of additional charge between each pair of Si atoms which corresponds to the covalent bonds in this material. Except for these bonds, the density is relatively unchanged from the free-atom superposition in the remaining regions outside of the atomic cores, as can be seen by identifying the “0” level in the accompanying scale bar. This circumstance is in stark contrast to the case of fcc Pt in Fig. 3(b). In Pt the increase in density is spread approximately uniformly throughout all of the regions outside the atomic cores. In fact, from this perspective Pt appears almost free-electron-like, despite the more localized nature of the states arising from the partially occupied -band. Thus we see that charge density difference plots such as those in Fig. 3 are clearly able to distinguish metallic bonding, as occurs in Pt, from covalent bonding, as occurs in Si. For later purposes we note that the nearest-neighbor spacing is 2.35 Å in Si and 2.77 Å in Pt.
C -Pt2Si
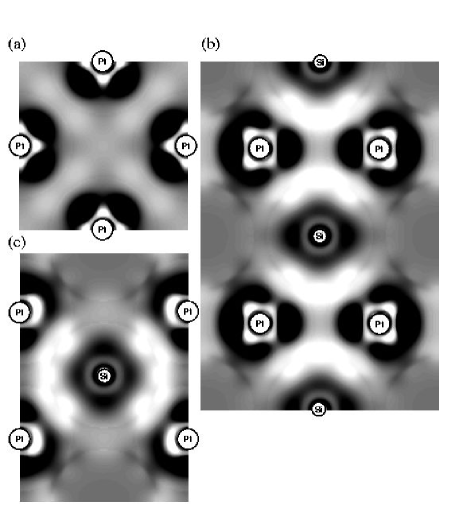
Each Si atom in -Pt2Si has eight Pt nearest-neighbors at a distance of 2.47 Å [see Fig. 1(a)]. In addition to four Si nearest-neighbors, each Pt atom also has four Pt second-nearest-neighbors at a distance of 2.79 Å and two Pt third-nearest-neighbors at 2.98 Å. The Pt second-nearest-neighbors form two-dimensional (001) planes while the Pt third-nearest-neighbors form linear chains. The Pt second-nearest-neighbor distance is very close to the nearest-neighbor distance in pure fcc Pt and thus we might expect these two-dimensional planes to exhibit evidence of metallic bonding. This is in fact what we see, as shown in Fig. 4(a) which bears a strong resemblance to the analogous plot in Fig. 3(b). However, this approximately uniform increase in the charge density in the regions outside the atomic cores is confined to the two-dimensional second-nearest-neighbor Pt (001) planes. In particular, there is little evidence of bonding (i.e. little or no increase in the charge density relative to free atoms) along the third-nearest-neighbor Pt chains.
In addition to the two-dimensional “metallic” bonding, we find strong evidence of covalent bonding between the Pt and Si nearest-neighbors, illustrated in Fig. 4(b). Unlike the case of pure Si where the increase in charge density occurred between pairs of atoms, here the density increase is localized between three atoms, two Pt and a Si. For this reason we refer to these as three-center covalent bonds. We might even be tempted to call these four-center bonds because there is a smaller increase in the density, in between the two Pt atoms, which connects two of the three-center bonds. However, we note that the -axis in Fig. 4(b) is along the direction and that each of the Pt–Pt pairs in between two of the three-center bonds are also located in one of the (001) planes which exhibit evidence of metallic bonding [Fig. 4(a)]. It would thus appear that rather than four-center covalent bonds, a more appropriate description of the bonding in -Pt2Si would be three-center bonds interconnected by two-dimensional metallic sheets.
The -axis of Fig. 4(b) is along the direction which highlights two of the central Si atom’s three-center bonds. However, from Fig. 1(a) we see that there are four of these crystallographic directions and therefore a total of 8 of these three-center bonds for each Si atom. As noted above, the pair of Pt atoms participating in a given three-center bond are second-nearest-neighbors themselves. Fig. 4(c) shows that there is another set of three-center bonds involving one Si atom and a pair of Pt atoms which are third-nearest-neighbors oriented along the chains. The -axis in Fig. 4(c) is along and the -axis is along . There is little or no indication of an increase in charge density along the Pt–Pt chains. In addition to the two three-center bonds in Fig. 4(c), there are two more of these bonds located in the plane obtained by a 90 rotation about the axis [see Fig. 1(a)], for a total of four of these three-center bonds for each Si atom.
Thus we see that each Si atom in -Pt2Si participates in twelve three-center bonds, eight with Pt–Pt second-nearest-neighbors and four with Pt–Pt third-nearest-neighbors, and that these three-center covalent bonds are interconnected by two-dimensional second-nearest-neighbor Pt–Pt metallic sheets. Given the large increase in the number of bonds in -Pt2Si relative to pure Si we expect that each individual bond will be weaker than one of the covalent bonds in Si. However, taken as a whole and in terms of the material strength, the more distributed nature of the bonding in -Pt2Si may indicate something closer in character to the pure metallic bonding in fcc Pt. This interpretation is supported by the calculated elastic constants in Fig. 2, where the non-volume-conserving elastic constants for -Pt2Si are much closer to those of fcc Pt as opposed to pure Si. We address this issue in more detail in Sec. V.
D PtSi
In the orthorhombic PtSi structure each Si atom has six Pt neighbors, with one Pt at 2.41 Å, two at 2.43 Å, one at 2.52 Å, and two at 2.64 Å. In view of the fact that the nearest-neighbor Pt–Si distance is 2.47 Å in -Pt2Si it is perhaps not surprising that we find the two Pt neighbors at 2.64 Å appear to contribute little to the bonding in PtSi. Each Si also has two Si fifth-nearest-neighbors at 2.84 Å but again we find little evidence of bonding between these atoms which is consistent with the fact that the nearest-neighbor distance in pure Si is only 2.35 Å. In addition to six Si neighbors at the same distances listed above, each Pt atom also has two Pt neighbors at a sixth-nearest-neighbor distance of 2.87 Å and two more at a seventh-nearest-neighbor distance of 2.90 Å. These distances are somewhat larger than the 2.77 Å nearest-neighbor distance in pure fcc Pt.
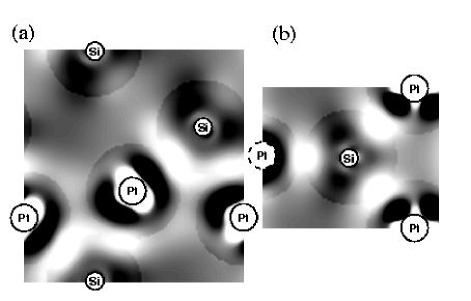
The striking appearance of three-center bonds in -Pt2Si is repeated in orthorhombic PtSi, as shown in Fig. 5(a). As we see in Fig. 1(b), a convenient way to think of the PtSi structure is as two alternating planes of atoms stacked along the -axis. Fig. 5(a) shows the charge density difference in one of these planes. As in the case of -Pt2Si [Figs. 4(b) and 4(c)] we see a pileup of charge relative to the free atom density which is not localized between a single pair of atoms but rather between one Si and two Pt atoms. These Pt neighbors participating in the three-center bond are the first- and third-nearest-neighbors of the Si atom and are at distances of 2.41 Å and 2.52 Å. The two Pt atoms are themselves sixth-nearest-neighbors, with a bond length of 2.87 Å. There appears to be a small increase in the charge density between these two Pt atoms. We note that the two different three-center bonds shown in Fig. 5(a) are equivalent by symmetry.
The two second-neighbor Pt atoms of a given Si atom are located in adjacent -axis planes from the Si. The charge density difference for these bonds is shown in Fig. 5(b), which indicates that they are of the standard two-center variety. In addition to these two-center bonds, the plot also shows part of the bond with the first-neighbor Pt atom on the left side of the figure. In fact, the two second-neighbors as well as the first- and third-neighbors form a very distorted tetrahedron around the central Si atom. The Pt–Si–Pt bond angles involving one Pt second-neighbor and one third-neighbor are very nearly equal to the perfect tetrahedral angle of 109.47 in pure Si, but the remaining four bond angles vary considerably, ranging from 71 to 131.
There is very little evidence of an appreciable increase in the charge density between the Pt and Si fourth-nearest-neighbors and the Si–Si fifth-neighbors, as we mentioned above. The Pt–Pt sixth-nearest-neighbors in Fig. 5(a) show some evidence of charge accumulation but the Pt–Pt seventh-neighbors do not. We thus see that there appears to be only two sets of strong covalent bonds in orthorhombic PtSi, the three-center Pt–Si–Pt bonds within a given -axis plane and the two-center Pt–Si bonds between atoms in adjacent -axis planes, resulting in a total of only three bonds per Si atom. In this sense the bonding in PtSi appears to be qualitatively much more similar to that in pure Si as compared to pure Pt or even -Pt2Si. In particular, we are unable to identify any concrete evidence in PtSi of a uniform increase in interstitial charge density that might be associated with an element of metallic bonding. We revisit this subject in Sec. V D.
V Valence force field models
In order to provide a more quantitative analysis of the trends in the elastic constants as well as the various elements of the chemical bonding, we construct simple valence force field models[23, 24] to describe the interatomic interactions for pure Pt, pure Si, and the two silicides. In these models the change in energy upon distorting the crystal, , is given as follows
| (8) |
where is the number of primitive cells in the crystal, is the number of atoms in the primitive cell, is the volume, is the change in the th bond length , and is the change in the bond angle between the th and th bonds. We determine the and force constants by equating this expression for to corresponding elastic constant expressions derived from Eq. (1), examples of which are given in Ref. [6]. These coefficients are referred to as force constants because Eq. (8) could also be used to anaylze the phonon spectrum and in this case, within a constant factor, the coefficients play the role of Hooke’s law force constants. The factor of in the first term of Eq. (8) is explicitly included so that the resulting force constant represents the volume contribution per atom, thus facilitating the comparison between materials with different numbers of atoms in the primitive cell. Similarly, the indices and are summed over all of the relevant bonds for each of the atoms in the primitive cell (avoiding any double counting), which results in force constants that represent the interaction strength for a single bond () or bond angle (). The volume term in Eq. (8) is needed for metals such as Pt and is reminiscent of the embedded-atom method[25, 26] which has been successful in treating fcc metals. Similarly, the angular terms are needed for covalently bonded systems such as Si; such terms are a part of the Tersoff potential formulation[27] which has been used successfully in semiconductor systems. Both the volume and the angular terms lead to deviations from the Cauchy relations[28] which are strict equalities between various elastic constants that apply when the interatomic interactions are purely pairwise [i.e. including only the second term in Eq. (8)].
A Pt
In the case of fcc Pt we construct a two-parameter model, considering only the nearest-neighbor bond length and a volume term, but no angular terms. The radial force constant can be obtained from the volume-conserving strains corresponding to either or ,
| (9) |
and
| (10) |
where is the volume per atom. Taken together, these two equations provide an explanation for the fact that and for pure Pt are similar in magnitude in Table II. They also satisfy the cubic stability requirements [Eq. (2)] that and .
In order to facilitate comparison with the silicides where there is no experimental data for the elastic constants, we also use the theoretically determined elastic constants for fcc Pt. For the purpose of internal consistency we use the theoretical equilibrium volume as well. The resulting two values of obtained from Eqs. (9) and (10) are 15.78 eV and 16.42 eV, respectively. The fact that the two numbers differ is an indication of the incompleteness of the two-parameter model. Use of the experimental elastic constants yields a bigger difference but we nonetheless will use the average of these two values for the purpose of comparing to the silicides,
| (11) |
Evaluated using the theoretical elastic constants we obtain = 16.10 eV, while the experimental elastic constants correspond to a value of 16.95 eV. We note that we could have eliminated the need to use the averaged expression in Eq. (11) by including additional force constants but we prefer to maintain the conceptual simplicity of the two-parameter model. For example, including an angular interaction in Eqs. (9) and (10) results in a small and slightly negative angular force constant which is conceptually unsatisfying.
The uniform expansion and compression represented by the bulk modulus can be used to obtain the following expression involving and ,
| (12) |
Eqs. (11) and (12) together yield a value of = 16.54 eV using the theoretical elastic constants, and 15.73 eV using the experimental values. The values of and obtained from the theoretical elastic constants are listed in Table IV. We note that the volume force constant has approximately the same magnitude as the radial force constant and that both are important in contributing to the large bulk modulus. For completeness we also give the expressions for and in terms of and ,
| (13) |
| (14) |
Eqs. (12–14) explicitly satisfy the stability requirement that [Eq. (3)].
The Cauchy relation for cubic crystals is that .[28] Using Eqs. (10) and (14) we obtain the following expression for the deviation from the cubic Cauchy relation,
| (15) |
Thus we see that the large and positive deviation from the Cauchy relation in pure Pt is due to a large volume contribution to . Moreover, the presence of the volume contribution is responsible for the fact that , , and are all significantly larger than the volume-conserving elastic constants and .
B Si
In the case of Si we also construct a two-parameter model but instead consider only the nearest-neighbor bond length and the tetrahedral bond angle and set all of the other and force constants to zero. Since there are three elastic constants and we allow only two force constants, we can check the accuracy of the model. The volume-conserving strain corresponding to () leaves the nearest-neighbor bond lengths unchanged to first order in the distortion and thus only the angular force constant enters,
| (16) |
where is the volume per atom. Comparing this result to Eq. (9) we see that has a very different origin in Si as compared to fcc Pt, despite the fact that the two values are approximately the same in Table II.
The volume-conserving strain in Si involves both radial and angular distortions and can thus be used in conjunction with Eq. (16) to determine ,
| (17) |
where corresponds to a pure strain, without allowing for any internal relaxation. This choice is convenient but not essential and we can test how well the two force constants describe the final remaining elastic constant. Using the theoretically determined elastic constants and equilibrium volume, Eqs. (16) and (17) yield = 54.06 eV and = 3.13 eV, which are listed in Table IV. Based on this analysis, the fact that and for Si are close in magnitude in Table II is merely a coincidence having to do with the specific values of the and force constants.
The final independent elastic constant is the bulk modulus which corresponds to an isotropic expansion or compression and therefore only involves radial but not angular distortions. In addition, this distortion is not volume-conserving and thus we could also have included the volume term from Eq. (8), which would not affect either of the volume-conserving strains corresponding to Eqs. (16) and (17), but would yield the following equation for the distortion,
| (18) |
Our two-parameter model has and thus the extent to which obtained from Eq. (18) deviates from zero provides a direct measure of how well the two-parameter model is able to describe the elastic constants. Using the theoretical values determined here, Eq. (18) yields = 0.18 eV, which demonstrates that the two-parameter model is indeed sufficiently accurate for describing the elastic constants in Si. For the sake of completeness we give the expressions for , and the deviation from the Cauchy relation , including a volume contribution,
| (19) |
| (20) |
| (21) |
We can compare our two-parameter model to the one derived by Harrison.[23] His angular term has the identical form as ours and his value of eV differs from ours of 3.13 eV only because we have used the theoretical elastic constants and equilibrium lattice constant while he uses the experimental values.[29] We derived the value of the radial force constant using the frozen elastic constant whereas Harrison derives his radial force constant from . The two values would be identical if the value of derived from Eq. (18) were exactly zero. The small deviation from zero, in addition to the difference in the lattice constants used, leads to a small difference between Harrison’s value of eV and our value of 54.06 eV.
We have found that for Si the angular force constant is more than an order of magnitude smaller than the radial force constant (Table IV). The angular interaction is nonetheless of particular importance for two reasons. The first is that the crystal would be unstable in the absence of angular interactions since [Eq. (16)] and [Eqs. (18–20)] for purely radial interactions, both of which violate the stability conditions discussed in Sec. III. The second reason is that the angular interaction is responsible for the fact that the elastic constants do not obey the Cauchy relation for a cubic crystal, [Eq. (21)]. Including a volume term but not an angular interaction would still result in an unstable crystal since the distortion is volume-conserving and the dependence on is identical for , , and . In addition, a positive volume contribution in the absence of an angular interaction could not account for the fact that the deviation from the Cauchy relation is negative . Thus we see that Eq. (21) and the fact that is small combine to provide an explanation for the fact that is smaller than , but only by a relatively small amount. This is in sharp contrast to pure Pt where the deviation from the Cauchy relation [Eq. (15)] arises from and is large and positive, resulting in a value of which is more than four times larger than in Si. More generally, the absence of a volume contribution in Si is responsible for the fact that and are similar in magnitude to the volume-conserving elastic constants and , in contrast to the case of Pt.
From the force constants listed in Table IV we see that for Si is more than a factor of three times larger than for fcc Pt which is consistent with the presence of strong covalent bonds in Si and distributed metallic bonding in Pt. In addition, the volume contribution is equally important in terms of the metallic bonding in Pt but plays no role in Si. The influence on the elastic constants of these qualitative differences in the chemical bonding are clearly illustrated by comparing Eqs. (12) and (18) for the bulk moduli in Pt and Si, respectively. We see that the geometry coefficient of is three times larger for Pt than for Si, reflecting the difference in the nearest-neighbor coordination and nearly compensating for the difference in the magnitudes of the two force constants. Given that and are approximately the same in Pt, we see from Eq. (12) that the volume contribution to is approximately 50% larger than the contribution from . In the case of Si the force constant is essentially zero and this difference accounts for most of the difference in the magnitudes of between Pt and Si. The pre-factors of account for the remaining difference since the volume per atom is 30% larger in Si.
We therefore see that the presence or absence of metallic bonding, as reflected in the and force constants, is intimately connected to the magnitudes of . Similar analyses can be used to explain the fact that and are also larger in Pt, the predominant reason being the presence of a large volume contribution (or equivalently, metallic bonding) in Pt but not Si. Conversely, the elastic constants corresponding to both of the volume-conserving distortions in Pt, and , are approximately the same as in Si, indicating that they are less sensitive to the differences in chemical bonding for these two materials. These differing trends in the volume-conserving versus non-volume-conserving elastic constants were already noted in Sec. III and are illustrated in Fig. 2. The volume force constant is included in the figure on the same scale as the elastic constants by dividing by the appropriate volume per atom (note that is precisely the combination that enters all of the expressions for the non-volume-conserving elastic constants).
C -Pt2Si
In order to provide a more quantitative description of the chemical bonding in -Pt2Si we describe the interatomic interactions using a valence force field model, just as we did for pure fcc Pt and pure Si. In view of the analysis of the valence charge density in Sec. IV C, we include first-, second-, and third-nearest-neighbor radial force constants as well as a volume term. We also consider some of the angular interactions. In keeping with our neglect of angular interactions in pure Pt we also neglect the bond angles between any two Pt–Pt bonds, both in the two-dimensional (001) metallic sheets and the Pt chains. In consideration of the three-center bonds discussed earlier, we include both the Pt–Si–Pt and the Si–Pt–Pt bond angles relevant to the three-center bonds involving one Si atom and two second-neighbor Pt atoms. However, we neglect the bond angles relevant to the three-center bonds involving one Si and two third-neighbor Pt atoms. This choice is based on the expectation that the strength of the angular interactions will generally be smaller than that of the radial interactions and that the three-center bond involving two Pt second-neighbors is stronger than the one involving two third-neighbors. We thus have six force constants which can be fit to the six elastic constants. For the sake of convenience we fit the force constant expressions to the “frozen” elastic constants, where no internal relaxations were carried out. This choice is not essential and need not be considered an additional approximation because the resulting force constants could be used to directly calculate the internal relaxations.
The volume-conserving strains corresponding to and both depend only on the first-nearest-neighbor Pt–Si radial force constant since the second- and third-nearest-neighbor Pt–Pt bond lengths are left unchanged to first order. In addition, depends on the Si–Pt–Pt bond angle but not the Pt–Si–Pt bond angle, while depends on both. We label the force constant for the Pt–Si–Pt bond angle as because it is the angle between two first-neighbor bonds. Similarly we label the Si–Pt–Pt force constant as . Equating the elastic constant [Eq. (1)] and force constant [Eq. (8)] expressions for the change in the energy and using the theoretical lattice constants from Table I, we obtain the following two equations,
| (22) |
and
| (23) |
where is the volume per atom. We note that in these equations and all of those that follow, the numerical coefficients are simply geometrical factors containing various combinations of the and lattice constants. Examining the geometry coefficients of in Eqs. (22) and (23), together with the expectation that the angular force constants will be significantly smaller in magnitude than , we see that these two equations provide a natural explanation for why is similar in magnitude but slightly smaller than in Table III. We also see that two of the stability requirements [Eq. (4)], and , are explicitly satisfied.
The volume-conserving strain corresponding to changes the second-neighbor Pt–Pt bond length, leaving the other two bond lengths unchanged to first order. This strain also modifies the two bond angles yielding,
| (24) |
Thus we can see from Eqs. (23) and (24) that since in Table III is somewhat more than two times larger than , we expect that the second-neighbor Pt–Pt force constant must be approximately two times larger than the first-neighbor Pt–Si force constant . We will in fact find this to be the case. Eq. (24) also satisfies the stability requirement that .
The final remaining volume-conserving strain corresponding to changes all of the first-, second-, and third-neighbor bond lengths, as well as the two bond angles,
| (25) |
We note that as required for mechanical stability, and that it is similar in magnitude to and in Table III.
The uniform expansion and compression corresponding to the bulk modulus changes the volume and all of the bond lengths but leaves the bond angles fixed,
| (26) |
The final two equations resulting from the and strains both include a contribution from a change in the volume,
| (27) |
and
| (28) |
Similarly, the equations for and are
| (29) |
and
| (30) |
Eqs. (26)–(30) explicitly satisfy the stability requirements [Eq. (5)] that and . We note that in contrast to the case of Si, all of the stability requirements in Eq. (4) would be satisfied even for purely radial interactions (i.e. no angular interactions).
Eqs. (22)–(25), (27), and (28) represent six linearly independent equations in the six unknown force constants. Solving this linear system of equations yields the force constants listed in Table IV for -Pt2Si. The volume force constant is only 16% smaller than in pure Pt. This is consistent with the presence of two-dimensional metallic sheets in -Pt2Si and the fact that there are a large number of distributed three-center bonds all interconnected by these sheets. The first neighbor Pt–Si force constant is nearly four times smaller than in pure Si. This large reduction results from the fact that each Si atom in -Pt2Si has eight Pt nearest-neighbors and participates in twelve different three-center bonds. Conversely, the second-neighbor Pt–Pt force constant is 60% larger than the corresponding force constant in pure fcc Pt, despite the fact that the two Pt–Pt bond lengths are very nearly the same. We can understand this result because each Pt atom in pure Pt has twelve nearest neighbors while each Pt in -Pt2Si has only four Pt second-neighbors and two Pt third-neighbors. Moreover, the Pt atoms in the silicide participate in covalent three-center bonds in addition to the metallic bonding within the two-dimensional sheets. The distributed nature of these bonds and the large number of them in the primitive cell are both consistent with the fact that is still a factor of two smaller than in pure Si. We found little evidence of an increase in the electronic charge density between the Pt–Pt third-neighbors and this is reflected in the fact that is more than three times smaller than . We also find that the angular force constants and are similar in magnitude to the force constant in pure Si. These angular terms play an important but less crucial role in the silicide as compared to pure Si.
Having determined the values of the individual force constants we can now use them to understand the trends in the elastic constants. For example, the two Cauchy relations for tetragonal crystals are that and .[28] Using Eqs. (24) and (29) the deviation from the first Cauchy relation is given by
| (31) |
Similarly, the deviation from the second Cauchy relation is
| (32) |
As in the case of pure Pt [Eq. (15)], it is the presence of the volume interaction which produces a positive deviation from the Cauchy relations. The angular interactions provide a negative contribution to Eqs. (31) and (32), just as they did for pure Si [Eq. (21)]. From the geometry coefficients of the angular terms we see that must be larger in magnitude than . The net result is that the deviations from the Cauchy relations for -Pt2Si are still positive but are factors of 2–3 smaller than the deviation in pure Pt.
In pure Pt we found that the volume-conserving elastic constants were all significantly smaller than the others and that this was due predominantly to the presence of a large volume contribution . We find the same trend in -Pt2Si with , , and all being similar in magnitude and smaller than all the remaining elastic constants (see Fig. 2). The notable exception to this trend is . In conjunction with Eq. (24) we already noted that the large value of in relation to the other volume-conserving elastic constants is due primarily to the fact that the second-neighbor Pt–Pt force constant is a factor of two larger than the first neighbor Pt–Si force constant . This result is in turn directly related to the presence of the network of three-center bonds interconnected by two-dimensional metallic sheets. We also saw that mechanical stability requires , , , and and that the deviations from the Cauchy relations are positive. The remaining variations among the six elastic constants in Table III are determined by the detailed dependence on the various force constants as described above.
One interesting example is that is essentially identical to . Comparing Eqs. (24) and (30) we see that in the case of positive volume and first-neighbor radial terms are partially counterbalanced by negative angular contributions whereas corresponds to a volume-conserving distortion and has positive angular contributions. In addition, the distortion changes the first-neighbor bond lengths, leaving the others fixed, while the distortion changes the second-neighbor bond lengths, leaving the others fixed. We have already noted that is anomalously large in comparison to predominantly because is twice as large as . The elastic constant is larger than for the same reason, thus explaining how it is at least possible for the volume-conserving elastic constant to be similar in magnitude to the non-volume-conserving elastic constant . In summary, while we are able to explain the overall magnitudes of the individual elastic constants, we are forced to conclude that the specific equality of and in Table III depends on the precise values of the individual force constants and is therefore simply accidental.
We saw in Eq. (12) for the bulk modulus of Pt that the volume contribution represented 60% of the total, with the contribution from the radial interaction making up the rest. The same approximate 60:40 split between the volume and radial contributions applies to the expression for the bulk modulus of -Pt2Si in Eq. (26). In addition, the volume per atom is nearly the same in the two materials. Thus we see that the 16% reduction in for -Pt2Si relative to Pt, combined with a similar reduction in the overall radial contribution, leads to a bulk modulus which is approximately 20% smaller in -Pt2Si. As we noted previously, there is no volume contribution in Si where the bulk modulus is a factor of 2–3 smaller. Conversely, the volume-conserving elastic constant is similar in magnitude for all three materials. Comparing Eqs. (10), (17), and (23) we see that in pure Pt arises solely from whereas in pure Si and -Pt2Si it arises from a combination of and angular contributions. In Si the split is 90:10, radial to angular, while in the silicide the split is only 60:40 since is a factor of four smaller. In addition, the volume per atom is 30% larger in Si than in the other two materials. The remaining elastic constants for -Pt2Si can be similarly analyzed in relation to those of pure Pt and pure Si.
D PtSi
Once again we construct a valence force field model to describe the chemical bonding and elastic constant trends in PtSi. In keeping with the discussion of the valence charge density in Sec. IV D, we include first-, second-, and third-neighbor Pt–Si radial force constants (labeled , , and ) as well as sixth- and seventh-neighbor Pt–Pt radial force constants (labeled and ). We also include a volume term () and three Pt–Si–Pt angular force constants. The angular force constants are labeled , corresponding to the bond angle between first- and third-neighbor Pt–Si bonds, , corresponding to the bond angle between two second-neighbor Pt–Si bonds, and , corresponding to the bond angle between second- and third-neighbor Pt–Si bonds. These three bond angles are the ones we have found to be most important and are the ones which correspond to the distorted tetrahedral Pt–Si–Pt angles described in Sec. IV D. The fourth and last of these angles is represented by the force constant but we found it to be unimportant and have not included it in the analysis presented here. Part of the reason for this finding may be that this bond angle is 131.72 which is quite different from the perfect tetrahedral angle of 109.47. We thus have nine force constants which can be fit to the nine elastic constants. As in the case of -Pt2Si we fit the force constant expressions to the “frozen” elastic constants out of convenience, but this choice is not essential because the relaxations could be calculated from the resulting model.
Most of the expressions for the elastic constants in terms of the force constants involve all of the radial and angular terms and thus there is not much to be learned by writing them down. Two exceptions are the volume-conserving strains corresponding to and which depend only on the second-neighbor Pt–Si and seventh-neighbor Pt–Pt radial force constants, as well as the angular force constant . Using the theoretically determined structural parameters from Table I we obtain the following two expressions,
| (33) |
and
| (34) |
where is the volume per atom. The force constant will turn out to be small and thus we can see from Eqs. (33) and (34) that is approximately a factor of two larger than purely because of geometrical factors. In addition, the mechanical stability requirements that and are satisfied by a combination of radial and angular terms. However, as in the case of -Pt2Si, the angular terms are not essential with regard to stability since the crystal would still be stable under purely radial interactions. It turns out that this circumstance is true for all of the stability requirements in Eq. (6). We also note that all of the volume-conserving elastic constants, , , , , , and are similar in magnitude and smaller than the other non-volume-conserving elastic constants (see Fig. 2). The primary exception is , although including the effect of relaxation brings it in line with the other volume-conserving constants.
Solving the linear system of nine equations in the nine unknown force constants, we obtain the values listed in Table IV. The volume force constant is nearly 40% smaller than in pure Pt and 25% smaller than in -Pt2Si. Nonetheless, the value is still sizeable and perhaps somewhat surprising given that we found no evidence of metallic-type bonding in our analysis of the charge density in Sec. IV D. The first- and second-neighbor Pt–Si radial force constants are quite large and nearly as large as the first-neighbor Si–Si force constant in pure Si. This result is consistent with the fact that we found only a small number of two- and three-center bonds for each Si atom in PtSi. This small number of bonds means that each bond is relatively strong, as is the case in pure Si, but in contrast to the situation in -Pt2Si where the Pt–Si force constant is more than a factor of three smaller. The fact that and in PtSi are still smaller than is Si may be due to the fact that the bond angles in PtSi are considerable distorted away from the perfect tetrahedral angle. The Pt–Si force constant in PtSi is approximately a factor of four smaller than and which may be due in part to the correspondingly longer bond length.
The Pt–Pt sixth-neighbor force constant is larger than in pure Pt which is likely due to the fact that this interaction contributes to the three-center bonds in PtSi. However, is 30% smaller than the corresponding Pt–Pt force constant in -Pt2Si, reflecting the longer bond length and the lack of two-dimensional metallic sheets in PtSi. Although the seventh-neighbor Pt–Pt bond length in PtSi is only 0.03 Å larger than the sixth-neighbor bond length, the seventh-neighbor bond does not participate in any three-center bonds and we found little evidence of any increase in the charge density. It is thus not surprising that is more than a factor of four smaller than .
We find that the angular interactions are sizeable in PtSi, as they were in -Pt2Si. However, in PtSi these interactions show a wider variation in magnitude, with being more than an order of magnitude larger than . We can understand the variation in these Pt–Si–Pt force constants by looking at the sizes of the bond angles themselves. corresponds to a bond angle of 71.09 which is very far from the perfect tetrahedral angle of 109.47. The bond angle associated with is a lot closer, having a value of 94.64, resulting in a larger force constant. The largest angular force constant is with the corresponding bond angle of 109.75 being nearly identical to the perfect tetrahedral angle. While the trend in the angular force constants in PtSi is understandable in terms of the deviation relative to the pure tetrahedral angle, the large magnitude of in comparison to the angular force constants in pure Si and -Pt2Si is unexpected. The angular interactions appear to be of greater importance in PtSi than they were in -Pt2Si. An attempt to fit the elastic constants of PtSi using a valence force field model including only radial interactions plus a volume term resulted in nonsensical values for these force constants. A sensible fit was only achieved after including angular terms.
We can now examine some of the trends in the elastic constants of PtSi using the calculated force constants. In particular, the Cauchy relations for an orthorhombic crystal are that , , and .[28] The expressions for the deviations from these Cauchy relations are as follows,
| (35) |
| (36) |
| (37) |
As in the case of -Pt2Si the volume interaction makes a positive contribution to the deviations from the Cauchy relations while the angular interactions make a negative contribution. The geometry coefficients for the angular terms in Eqs. (35)–(37) are smaller than for -Pt2Si in Eqs. (31) and (32), reflecting the smaller multiplicity of the bond angles in PtSi. This reduction is more than compensated by the larger magnitude of the force constants in PtSi, particularly . The volume per atom is similar in the two silicides but the magnitude of is smaller in PtSi. The combined effect of the smaller and the larger is that the deviations from the Cauchy relations in Eqs. (35)–(37) are still positive but approximately 30% smaller on average than in -Pt2Si. This conclusion remains true for the relaxed elastic constants, although the specific numerical details are changed. For example, the larger geometry coefficients of , and especially , in Eq. (37) result in a very small deviation from the third Cauchy relation for the frozen elastic constants. When relaxation is included drops by 29% while increases by 8%, resulting in a significantly larger deviation. However, becomes much smaller so that on average the deviations are still approximately 30% smaller in PtSi.
The requirements of mechanical stability in Eqs. (6) and (7) constrain the elastic constants by requiring that , , , , and . However, there are additional trends among the elastic constants. We have already noted that the volume-conserving elastic constants in PtSi are all smaller than those where the corresponding distortion does not conserve volume. The predominant reason for this occurrence is the presence of the positive volume contribution , just as it was in the case of pure Pt and in -Pt2Si (see Fig. 2). The positive deviations from the Cauchy relations in Eqs. (35)–(37) provide specific examples of this trend. We noted above that the relatively large value of in PtSi seemed surprising given the lack of evidence for metallic bonding in the charge density. In fact, it appeared that the chemical bonding in PtSi was much more similar to that in pure Si than in either -Pt2Si or pure Pt. However, the trends in the elastic constants of PtSi, the positive deviations from the Cauchy relations and the smaller values of the volume-conserving elastic constants, are much more similar to those in the materials that do exhibit direct evidence of metallic bonding, thus requiring a sizeable volume contribution in PtSi as well. This conclusion is not one that we would have reached based on the charge density alone, thus demonstrating the need for care when examining such qualitative characteristics. By contrast, the analysis of the elastic constants using a valence force field model has allowed a more quantitative description of the chemical bonding. We note that the finding of both metallic and covalent components to the bonding in PtSi as well as -Pt2Si indicates a strong similarity between these two materials and may also be connected with the fact that the heats of formation for the two are very nearly the same.[6]
Finally, we examine how the elastic constants of PtSi fit into the trends between the different materials studied here. The expression for the bulk modulus in PtSi is
| (38) |
Using the force constants listed in Table IV we find that there is a roughly 50:50 split between the volume and radial contributions to in Eq. (38) compared to an approximate 60:40 split in pure Pt and -Pt2Si. We already noted that the volume per atom is similar in all three materials. Thus we see that the smaller value of is partially compensated by an increase in the radial contribution, yielding a value of which is only slightly smaller in PtSi than in -Pt2Si, but still approximately a factor of two larger than in pure Si. We can now see that the nearly linear relationship between the bulk modulus and the atomic percent Pt, evident in Fig. 2, has a direct connection with the nature of the chemical bonding in these materials. Conversely, the fact that the volume-conserving elastic constants are similar in magnitude in all four materials demonstrates that they are less sensitive to the nature of the bonding. For example, in Pt [Eq. (10)] arises purely from radial interactions while the split is 90:10, radial to angular, in Si [Eq. (17)]. In the two silicides [Eqs. (23) and (33)] the split is approximately 60:40. Despite these variations in the split between radial and angular contributions and variations in the individual force constants themselves, the volume-conserving elastic constants are all relatively small and similar in magnitude in all four materials.
VI Summary
We have carried out an extensive study of the chemical bonding and elasticity of two room-temperature stable platinum silicides, tetragonal -Pt2Si and orthorhombic PtSi. We have investigated the trends in the calculated elastic constants, both the trends within a given material as well as between materials. The Cauchy relations, that , , and , apply to a crystal in which the interatomic interactions are purely radial. Real materials deviate from these relations and we find that in pure Pt as well as the two silicides the deviations are always positive (left hand side greater than right hand side) but in Si the deviation is negative. More generally, we find that in the metals the elastic constant expressions which correspond to volume-conserving strains are always smaller than those which correspond to strains which do not conserve volume. This also turns out to be true in Si with the exception of which is less than (negative deviation from the Cauchy relation). However, the difference in magnitudes between volume-conserving and non-volume-conserving elastic constants is largest on average in Pt and gets smaller in the progression Pt -Pt2Si PtSi Si. In general, the volume-conserving elastic constants have similar magnitudes in all four materials while the non-volume-conserving elastic constants follow this same progression. In particular, the bulk modulus is found to be a very nearly linear function of the atomic percentage of Pt.
We have analyzed the valence electronic charge density in order to gain insight into the nature of the chemical bonding in the silicides. In the case of -Pt2Si we find striking evidence of a wide network of covalent three-center bonds, each involving a single Si atom and two Pt atoms. Each Si atom participates in 12 different three-center bonds. We also find evidence of two-dimensional metallic Pt (001) sheets which act to interconnect the network of three-center bonds. The Pt–Pt bond length in these two-dimensional sheets is very nearly the same as in pure fcc Pt. The widely distributed nature of the bonding in -Pt2Si appears to be closer in character to the pure metallic bonding in fcc Pt than the covalent two-center bonds in Si. The trends in the elastic constants support this interpretation. PtSi also exhibits evidence of covalent Pt–Si–Pt three-center bonds in addition to more standard Pt–Si two-center bonds. Each Si atom participates in one three-center bond and two two-center bonds with the four Pt neighbors forming a very distorted tetrahedron. Two of the six corresponding bond angles are very nearly equal to the perfect tetrahedral angle but the other four angles vary from 71 to 132. Qualitatively the bonding in PtSi appears much more similar to the covalent bonding in pure Si than the metallic bonding in pure Pt but the trends in the elastic constants indicate that there are actually elements of both. The finding of strong Pt–Si covalent bonding in PtSi is consistent with the experimental study of Franco et al.[7] in which they found spectroscopic evidence that the influence of the Pt 6 orbitals extends throughout the entire valence band.
We have constructed valence force field models for the two silicides as well as pure Pt and pure Si. These models provide a quantitative basis for understanding both the trends in the elastic constants and the various elements of the chemical bonding. We have included volume-, radial-, and angular-dependent contributions in the models. The volume-dependent contribution, which reflects the presence of metallic bonding, turned out to be a crucial element of the models. The presence or absence of this term and the magnitude of the volume force constant are predominantly responsible for the observed trend in the non-volume-conserving elastic constants as a function of Pt concentration. In addition, the absence of this contribution in the volume-conserving elastic constants is largely responsible for the fact that these constants have similar magnitudes in all four materials. The variation in the sign and magnitude of the deviations from the Cauchy relations is a specific example of these more general trends and is once again due primarily to the variation in the magnitude of . The models also provide explanations for differences in magnitude between specific elastic constants for a given material, such as the anomalously large value of in -Pt2Si which we find to be closely connected to the three-center bonds in this material.
In addition to providing explanations for the trends in the elastic constants, the magnitudes of the various force constants themselves provide a direct indication of the nature of the chemical bonding. The magnitude of the volume term provides an indication of the relative importance of metallic bonding. This analysis demonstrated that there is an important element of metallic bonding in PtSi, despite the lack of direct evidence in the analysis of the charge density. This conclusion is required as a result of the specific values of the elastic constants in this material and would not have been possible based solely on the qualitative features of the charge density. Similarly, the magnitudes of the radial and angular force constants are directly connected to the importance of covalent bonds in the material. The trends in these constants confirm the general conclusions made on the basis of the charge density analysis. In addition, the conclusion that there are elements of both metallic and covalent bonding in -Pt2Si as well as PtSi may be connected to the fact that the heats of formation for the two silicides are nearly the same. One general conclusion of this study is that the elastic constants contain a great deal of information about the nature of the chemical bonding in a material but since this information is not readily apparent, an analysis such as the one presented here is necessary in order to extract the information. We have attempted to make the case here that an analysis in terms of valence force field models provides a convenient and fruitful way to analyze the elastic constants and their connection to the chemical bonding in a material.
Our purpose in developing the valence force field models described in this work was to provide a quantitative means for investigating the nature of the chemical bonding in the platinum silicides in comparison to pure Pt and pure Si and also to provide a more intuitive understanding of the connection between the chemical bonding and mechanical properties of these materials. Nonetheless, we can briefly consider the possibility that these models may be useful in carrying out future studies of silicide–silicon interfaces where first principles methods would be vastly more CPU-intensive. For example, depending on the growth conditions, the silicide thin film grown on a silicon substrate can be stabilized in an amorphous phase. The only hope of treating such a structure would be to use a more efficient semi-empirical method such as a valence force field model. We believe that in general it should be possible to develop such a model given that our basic formulation includes the same fundamental elements as in other successful models, such as the embedded-atom method and Tersoff potentials. One possible point of concern is the well-known fact that valence force field models in general tend to converge very slowly with respect to the number of interaction parameters in the model. This issue would certainly need to be explored before any attempt was made to develop models that could be used in large-scale simulations.
Acknowledgements.
This work was performed in part under the auspices of the U. S. Department of Energy, Office of Basic Energy Sciences, Division of Materials Science by the University of California Lawrence Livermore National Laboratory under contract No. W–7405–Eng–48. Partial support was also provided by Deutsche Forschungsgemeinschaft, SFB 292 “Multicomponent Layered Systems.”REFERENCES
- [1] P. W. Pellegrini, C. E. Ludington, and M. M. Weeks, J. Appl. Phys. 67, 1417 (1990).
- [2] V. W. Chin, M. A. Green, and J. W. V. Storey, Solid-State Electron. 36, 1107 (1993).
- [3] D.-X. Xu, S. R. Das, L. E. Erickson, and A. Naem in Materials Reliability in Microlelectronics V, edited by A. S. Oates, K. Gadepally, R. Rosenberg, W. F. Filter, and L. Greer, MRS Symp. Proc. No. 391 (Materials Research Society, Pittsburg, 1995).
- [4] D.-X. Xu, J. P. McCaffrey, S. R. Das, G. C. Aers, and L. E. Erickson, Appl. Phys. Lett. 68, 3588 (1996).
- [5] B. A. Morgan, K. M. Ring, K. L. Kavanagh, A. A. Talin, R. S. Williams, T. Yasuda, T. Yasui, and Y.Segawa, J. Vac. Sci. Technol. B 2, 1238 (1996).
- [6] O. Beckstein, J. E. Klepeis, G. L. W. Hart, and O. Pankratov, Phys. Rev. B 63, 134112 (2001).
- [7] N. Franco, J. E. Klepeis, C. Bostedt, A. Van Buuren, C. Heske, O. Pankratov, T. A. Calcott, D. L. Ederer, and L. J. Terminello, (to be published).
- [8] W. B. Pearson, A Handbook of Lattice Spacings and Structures of Metals and Alloys, Vol. 4 of International Series of Monographs on Metal Physics and Physical Metallurgy, edited by G. V. Raynor (Pergamon Press, Oxford, 1964).
- [9] Semiconductors: Group IV Elements and III–V Compounds, Vol. 17a Landolt-Börnstein, New Series, Group III, edited by O. Madelung (Springer, Berlin, 1982).
- [10] R. Gohle and K. Schubert, Z. Metallkde. 55, 503 (1964).
- [11] R. P. Ram and S. Bhan, Z. Metallkde. 69, 524 (1978).
- [12] International Tables for Crystallography, Vol. A Space-Group Symmetry, 2nd ed., edited by T. Hahn (Kluwer Academic, Dordrecht, 1989).
- [13] H. Pfisterer and K. Schubert, Z. Metallkde. 41, 358 (1950).
- [14] E. J. Graeber, R. J. Baughman, and B. Morosin, Acta Cryst. B 29, 1991 (1973).
- [15] P. Villars and L. D. Calvert, Pearson’s Handbook of Crystallographic Data for Intermetallic Phases (ASM International, Materials Park, 1991), Vol. 4, p. 4994.
- [16] Low Frequency Properties of Dielectric Crystals, Vol. 29a Landolt-Börnstein, New Series, Group III, edited by D. F. Nelson (Springer, Berlin, 1992).
- [17] D. C. Wallace, Thermodynamics of Crystals (John Wiley & Sons, New York, 1972), Chap. 1.
- [18] M. Methfessel, Phys. Rev. B 38, 1537 (1988).
- [19] M. Methfessel, C. O. Rodriguez, and O. K. Andersen, Phys. Rev. B 40, 2009 (1989).
- [20] D. M. Ceperley and B. J. Alder, Phys. Rev. Lett. 45, 566 (1980).
- [21] S. H. Vosko, L. Wilk and M. Nusair, Can. J. Phys. 58, 1200 (1980).
- [22] P. E. Blöchl, O. Jepsen, and O. K. Andersen, Phys. Rev. B 49, 16 223 (1994).
- [23] See for example, W. A. Harrison, Electronic Structure and the Properties of Solids, (W. H. Freeman and Company, San Francisco, 1980), p. 193.
- [24] K. Tanaka, H. Inui, M. Yamaguchi, and K. Koiwa, Mater. Sci. Eng. A 261, 158 (1999).
- [25] M. S. Daw and M. I. Baskes, Phys. Rev. Lett. 50, 1285 (1983).
- [26] M. S. Daw and M. I. Baskes, Phys. Rev. B 29, 6443 (1984).
- [27] J. Tersoff, Phys. Rev. B 39, 5566 (1989).
- [28] See for example, M. Born and K. Huang, Dynamical Theory of Crystal Lattices, (Oxford University Press, Oxford, 1954), p. 136.
- [29] Note that the notation used here differs from that in Ref. [23] where refers to the radial force constant and refers to the angular force constant.
- [30] Structure Data of Elements and Intermetallic Phases, Vol. 6 Landolt-Börnstein, New Series, Group III, edited by K.-H. Hellwege (Springer, Berlin, 1971).
- [31] R. E. MacFarlane, J. A. Rayne, and C. K. Jones, Phys. Lett. 18, 91 (1965).

| Material | Ref. | |||||
| Pt | theor. | [6] | ||||
| expt. | [30] | |||||
| -Pt2Si | theor. | [6] | ||||
| expt. | [11] | |||||
| PtSi | theor. | [6] | ||||
| expt. | [14] | |||||
| Si | theor. | [6] | ||||
| expt. | [16] | |||||
| PtSi | Ref. | |||||
| theor. | [6] | |||||
| expt. | [14] |
| Pt Theory[6] | Pt Expt.[31] | Si Theory[6] | Si Expt.[16] | |||||
|---|---|---|---|---|---|---|---|---|
| 346 | .80.5 | 358 | 163 | .450.03 | 165 | |||
| 262 | .70.3 | 254 | 62 | .130.02 | 63 | |||
| 87 | .50.3 | 77 | 79 | .850.02 (108.6) | 79 | .1 | ||
| 290 | .80.3 | 288 | .4 | 95 | .900.02 | 97 | .0 | |
| -Pt2Si–frozen[6] | -Pt2Si–relaxed[6] | PtSi–frozen[6] | PtSi–relaxed[6] | |||||
|---|---|---|---|---|---|---|---|---|
| 347 | .21.2 | 332 | .40.9 | 327 | .51.2 | 298 | .21.2 | |
| — | — | 313 | .80.0 | 269 | .30.8 | |||
| 297 | .50.5 | (298 | .00.4) | 345 | .90.1 | 308 | .00.6 | |
| 225 | .01.2 | 239 | .61.0 | 157 | .70.6 | 156 | .40.8 | |
| 169 | .30.9 | (169 | .40.8) | 162 | .90.6 | 132 | .20.7 | |
| — | — | 153 | .40.1 | 165 | .10.6 | |||
| 75 | .40.3 | 62 | .70.5 | 141 | .30.3 | 100 | .10.4 | |
| — | — | 113 | .10.1 | 104 | .50.1 | |||
| 169 | .55.2 | (169 | .35.2) | 74 | .20.2 | 66 | .30.4 | |
| 235 | .40.6 | (235 | .50.5) | 215 | .00.2 | 198 | .10.3 | |