Crater formation: can macroscopic scaling laws be used in microscopic cratering?
Abstract
Using classical molecular dynamics simulations we examine the formation of craters during 0.4 - 100 keV Xe bombardment of Au. Our simulation results, and comparison with experiments and simulations of other groups, are used to examine to what extent analytical models can be used to predict the size and properties of craters. We do not obtain a fully predictive analytical model (with no fitting parameters) for the cratering probability, because of the difficulty in predicting the probability of cascades splitting into subcascades, and the relation of the heat spike lifetime and energy density. We do, however, demonstrate that the dependence of the crater size on the incident ion energy can be well understood qualitatively in terms of the lifetime of the heat spike and the cohesive energy of the material. We also show that a simple energy density criterion can not be used to predict cratering in a wide ion energy range because of the important role of the heat spike lifetime in high-energy cascades. The cohesive energy dependence differs from that obtained for macroscopic cratering (observed e.g. in astrophysics) because of the crucial role of melting in the development of heat spikes.
pacs:
79.20.Rf,34.50.Dy,34.10+x,96.35.GtI Introduction
Surface modification of materials by incident ions has been observed using electron microscopy, scanning tunneling microscopy (STM) and atomic forces microscopy (AFM) [1, 2, 3, 4]. A large variety of features have been studied: hillocks [5], depressions [6, 7, 8, 9], crater rims [1, 2, 3, 10], adatoms [11, 12, 13, 14], and surface roughening [15]. Hillocks can appear when an energetic process occurs a few layers below the surface. For instance, an energetic recoil can create a mini-spike which melts the surrounding region, creating a low density region of larger volume which raises the surface [16]. When the energy loss per unit path length of the projectile, , and the sputtering yield are relatively small, adatoms are observed in both experiments and simulations. For larger energy deposition (and larger yields) a crater is formed. For even larger yields re-deposition of the ejecta plus plastic deformation occurs producing craters with rims, studied recently for ion bombardment of polymers [2]. Craters are also produced by cluster ion bombardment in which non-linear effects lead to enhanced sputtering [17, 18, 19, 20, 21]. This has been studied in the velocity regime in which nuclear (elastic) energy loss dominates over electronic energy loss and has also been observed in experiments [17, 18, 19, 20].
Although several studies have used molecular dynamics (MD) computer simulations to examine crater formation [14, 22, 6, 23, 24, 21, 25, 26, 27, 28], most of them have been limited to fairly low total ion or cluster impact energies, 10 keV. In this energy range, a fairly good description of the mechanisms of cratering has been found in dense fcc metals [6, 29]. Yet MD simulations of mixing in the bulk have shown that the amount of atom displacements keeps increasing superlinearly up to ion energies of 100 keV in dense fcc metals, and that the heat spikes formed can persist for tens of picoseconds [30]. This poses the question whether the long lifetime of high-energy spikes can alter the mechanism of cratering in fcc metals, as significant liquid flow might take place in cascades with long lifetimes. In fact, in a recent paper Aderjan and Urbassek [6] suggest that liquid flow might explain why the cratering cohesive energy dependencies differ from those predicted by macroscopic models [31, 32, 33, 34], but they do not give a description of the mechanism by which this might occur.
In this paper, we use MD simulations to examine crater formation by Xe recoils impacting on Au in an unprecedentedly wide energy range, ranging from 0.4 up to 100 keV of initial ion energy. We chose this ion-solid combination because TEM experiments are available for cratering in the same system [10, 35, 36]. We find that at higher energies the fundamental mechanism leading to cratering does indeed change. While in the low-energy regime ( keV) the mechanism can be understood on the basis of a high kinetic energy density alone, in agreement with previous models for dense metals, we show that at high energies ( keV) cratering can result from lower kinetic energy densities due to the long lifetime of the heat spike. We also present analytical models for both energy regimes, and compare our simulation results with experiments and results in other types of materials.
This paper is organized as follows. First some details of the simulation and crater identification and measurement are given in section II. In section III results for a few individual events are presented, leading to the identification of weak points in current analytical models of cratering. In the following section we discuss the formation mechanisms of our craters in detail, and relate them to previous models. In section V we compare our results directly with experiments, and in section VI discuss why macroscopic scaling laws do not apply to atomic systems. We then compare our results for single-ion bombardment with results for cluster bombardment in section VII and finally in section VIII show that with appropriate scaling crater sizes in both metals and some organic solids can be understood in the same framework.
II Method
A Molecular dynamics simulations
The basic MD simulation methods used in this work has been described in several previous papers [13, 37, 30, 38], so in here we only recall the basic principles, and the features which differ from those. In simulating ion irradiation of a surface, we place an incident ion on a random position a few Å above the surface, and give it a kinetic energy of 0.4 – 100 keV towards the sample. The incident angle is chosen in an off-channeling direction close to the surface normal. Most simulations were carried out for a (001) surface, but six 100 keV events were also simulated for a (111) surface. No major difference were observed in the crater sizes for the two surfaces for 100 keV energies. The development of the system of atoms is followed until the cascade has cooled down close to the ambient temperature, which for the cascades presented here was always 0 K to definitely rule out any post-cascade damage annealing. A few 50 keV events (the results of which are not presented here) were also simulated at 300 K, and found to give similar crater sizes as the 0 K events. Varying the initial position of the recoil atom can cause the resulting cascades to behave very differently depending on where the strongest collisions occur.
The simulation cells had periodic boundaries in the and dimensions, and a fixed bottom layer in the direction. They were cooled down to 0 K using Berendsen temperature control at the cell borders and a few layers at the bottom above the fixed layer. The simulation cells had at least 16 atoms per eV of incident ion energy, which was enough to prevent cell heating beyond the melting point or pressure wave reflection from the borders strong enough to affect the cascade outcome. To ensure that no artificial border effects occurred, runs were automatically stopped and restarted in a larger simulation cell if a recoiling atom with an energy higher than 20 eV (which is less than the threshold displacement energy [39]) entered the temperature scaling region.
Most simulations were carried out in Au modeled by the embedded atom method (EAM) potential of Foiles [40], smoothly joined to the universal repulsive interatomic potential of Ziegler, Biersack and Littmark [41] at small interatomic separations [14]. To probe the cohesive energy dependence of the crater size, we used artificial modifications of this potential for different values of the cohesive energy. To be precise, in the EAM formalism [40, 42] we scaled the pair potential and the embedding energy of the potential by a factor in the range 0.5 – 1.6, while leaving the electron density unmodified. To preserve the ballistic properties of the potential, however, the factor was scaled smoothly back to 1.0 at small interatomic separations , in the same range where the repulsive potential was onset. This scaling gives an interatomic potential with the same equilibrium lattice constant as the original potential, but with the cohesive energy and elastic moduli scaled by the factor . We further verified by simulations that the melting point scaled highly accurately by , as expected from Lindemann’s law [43].
For reference purposes, we note that at 0 K the binding energy of our EAM Au is eV, the lattice constant , and hence the atomic density is Å-3. The melting temperature of the simulated solid is 1110K.
B Finding non-channeling directions
To enable the use of simple binary collision approximation programs such as TRIM [41] for quick estimates of cascade energy densities and penetration depths, it is important to use an incident angle in the simulation corresponding to a non-channeling direction. To find such a direction, we used the MDRANGE code, which is an ion range calculation code which accounts for the crystal structure [44].
| (Å) | (Å) | ||
|---|---|---|---|
| 0 | 0 | 780 | |
| 5 | 20-30 | 480 | |
| 10 | 20-30 | 110 | |
| 15 | 20-30 | 90 | |
| 20 | 20-30 | 60 | |
| 25 | 20-30 | 60 | |
| 30 | 20-30 | 76 | |
| 25 | 0-10 | 251 | |
| 25 | 10-20 | 70 | |
| 25 | 20-30 | 60 | |
| 25 | 30-40 | 60 |

In the particular case of heavy ion irradiation of (001) fcc metals, we have observed that channeling effects can be extremely strong, requiring careful selection of both the tilt () and twist () angles to obtain a good non-channeling direction. As we shall see below, this may be of crucial importance for the comparison of cratering probabilities with experiments, whence we give some sample range results for 50 keV Xe bombardment of (001) Au at 0 K in Table I. The results show that the mean range depends sensitively on both and . Ranges at other energies had a quite similar and dependence. To obtain an optimal non-channeling direction we used for the (001) surface at all energies.
C BCA Calculations
A number of SRIM 2000.39 [45] calculations were performed in order to compare binary collision approximation (BCA) results with MD results. If good agreement is found e.g. in the energy densities, the SRIM code could be used to obtain quick estimates of cratering probabilities. The runs used the same incident angle, , =2.6 eV, and =3.9 eV. We used eV as the displacement energy value for SRIM [39]. The low energy self-sputtering of Au at normal incidence was reproduced well with these values of the binding energies and displacement energy. The total energy deposited up to certain depth, can be calculated by integrating the energy deposited as a function of depth , . Energy densities were calculated using a cylindrical volume (which contained the cascade better than a hemispherical volume). SRIM follows recoils until they reach the displacement energy, and therefore one should really compare with the MD energy density discarding atoms with . However, the energy deposition in SRIM represents the scenario before 0.1 ps, when there are only few energetic recoils and the cascade has not evolved significantly.
D Analysis
Post-run analysis of the quenched MD simulation cells was performed to identify the surface features. If the last layer of atoms was located at , with the target in , all atoms in the range were counted as adatoms, and all atoms above were counted as sputtered atoms. was set to 20 Å for all cases except the 100 keV ones, where Å. Both values are much larger than the cut-off radius of the potential, which is only 5.55 Å.
The crater and the crater rims were measured along two directions and the mean sizes were evaluated. The deviation of the crater shape from a circle was estimated with a parameter , where and are the smaller/larger crater radii, respectively. This parameter was typically 0.6 – 0.9, since the craters were not circular but diamond shaped, following the symmetry of the lattice, as seen in cluster bombardment simulation of Cu [6]. The area of the craters was therefore calculated as a circle and also as a parallelogram, which gives smaller areas, but within 10 – 30% of the value for a circular area.
The rims were identified as structures with more than one atomic layer above the surface, to differentiate them from single-layer adatom islands and coherent displacement [38], which occurs often at the side of the rim for the 20 – 100 keV events.
The volume of the crater is approximated as the number of atoms ‘excavated’ from the target, , where is the equilibrium atomic density of the solid. If the number of atoms on top of the surface is used as an estimate of the crater volume, there are two small corrections which have not been taken into account. There may be atoms far from the crater which are on top of the surface because of coherent displacements. Besides, there may be interstitials or vacancies in the crater walls which change the normal density of the material, but their number was observed to be small, and in any case their effect seems to roughly cancel each other out. The ‘measured’ radius of the crater is not affected by these corrections.
| 5 keV | 10 keV | 100 keV | |||||||
| Event | 5 | 5-2 | 5-1 | 5-4 | 5-9 | 10 | 10-8 | 100 | 100-4 |
| Model | SRIM | MD | MD | MD | MD | SRIM | MD | SRIM | MD |
| Crater? | — | no | small | yes | yes | — | yes | — | yes |
| (keV) | 4.42 | 2.125 | 2.81 | 2.71 | 3.16 | 8.32 | 6.27 | 25.4 | 62.35 |
| (eV) | 1.84 | 0.88 | 1.17 | 1.13 | 1.31 | 1.66 | 2.4 | 0.31 | 0.76 |
| — | — | 8 | 16 | 16 | — | 19.6 | — | 36 | |
| / | 13/18 | 20 | 25 | 17 | 12.5 | 19/26 | 20 | 77/105 | 60 |
| Depth | 30 | 40 | 30 | 40 | 25 | 40 | 35 | 250 | 60 |
| 0.8 | 0.39 | 0.43 | 0.68 | 2.35 | 0.5 | 0.62 | 0.07 | 0.21 | |
| 119.5 | 75 | 73 | 299 | 152 | 233.3 | 408 | 1,064.5 | 4,538 | |
| 15.9 | 2 | 6 | 31 | 15 | 21.3 | 44 | 36.3 | 472 | |
| (keV) | 1 | 5 | 10 | 20 | 50 | 100 |
| events | 20 | 10 | 20 | 20 | 10 | 6 |
| (Å)(MD) | 8.5 | 13 | 19.6 | 244 | 312.5 | 33 |
| (Å)(SRIM) | 7 | 13 | 19 | 26 | 43 | 65 |
| (ps)(MD)-bulk | 3.8 | 9.7 | 13 | 13 | 33 | 30 |
| (ps)(MD-surf)-no crater | 0.9 | 2.3 | 5 | 18 | 7.5 | 4 |
| (ps)(MD-surf)-crater | 0.9 | 2.6 | 6 | 23 | 12 | 16 |
| (ps)(Eq. 3) | 0.8 | 2.8 | 6.0 | 11.3 | 17.3 | 17.6 |
| (ps)(Eq. 2) | 2.6 | 4.9 | 7.1 | 9.8 | 21.0 | 21.2 |
| (MD) | 0.80 | 0.78 | 0.73 | 0.7 | 1 | 1 |
| 0.0 | 0.1 | 0.2 | 0.3 | 0.3 | 0.4 | |
| (MD) | 0.79 | 0.67 | 0.60 | 0.55 | 0.83 | 0.60 |
| (Eq. 5) | 0.80 | 0.70 | 0.58 | 0.49 | 0.70 | 0.60 |
III Individual cascades and cratering
A detailed picture of the cratering formation scenario can be obtained by considering individual MD simulations. For brevity, we use the following notation to denote individual events. The B’th event, were B is a running index, carried out with an energy of “A” keV is denoted by “A-B”. Thus for instance the eighth 10 keV event is marked by “10-8”. Results for a few events are listed in Table II and discussed below.
Fig. 1 shows cross-sectional snapshots of a 100 keV cascade, event 100-4, with a crater being formed between 2 and 40 ps. Fig. 2 shows the final crater produced in this event. The liquid flow of atoms builds the crater and crater rim. Notice that the cascade splits below the surface, and one of the subcascades does not reach the surface, even though it produces some coherent displacement [11] of atoms next to the crater. Below we analyze in detail a few cascades in order to clarify some results regarding cratering probability, which is discussed in the following section.
In Table II we compare MD results for individual events to average results from the SRIM 2000 BCA code. The MD values for cascade size, mean energy per atom, and so on compare reasonably well with SRIM, except for 100 keV. Note that the energy density at 0.1 ps, when the craters just start to form, is of the order of 0.3 – 2. For the 10 keV case shown in the table, by 1 ps this energy density decreased to , in good agreement with other estimates of mean kinetic energy () in the molten region of the cascade [46, 5]. The case 10-8 forms an almost hemispherical crater, as well as the case 5-9. The case 5-4 has a large subcascade splitting, but both cascades are very close to the surface. On the other hand, case 5-2 has two subcascades, with some coherent atomic displacement on top of the larger cascade producing only few adatoms and a platelet. The case 100-4 forms a large crater, but notice that the energy density is lower than that for the 5 keV event that did not produce any crater. Since the cascade is so large, it can stay hot longer, and flow occurs during tens of ps, even though the energy density is low. Notice that the crater radius is much smaller than the cascade size, but the rim for 100-4 has a length of Å, close to the lateral range of 105 Å.
From the analysis of the above cases and other events not discussed in detail here, we can already qualitatively conclude that:
-
1.
At low bombarding energies, cratering occurs for energy densities close to 0.5.
-
2.
Energy density alone is not a good criterion for crater formation, since for large spikes the long lifetime of the spike will allow ejection even for energy densities much lower than . To obtain a cratering probability one would need to take into account the probability of the spike being long lived, related to both spike radius and available energy.
-
3.
Cascade splitting should somehow be included, because it can dilute the energy density significantly and concentrate it away from the surface. As a result the cratering probability is reduced.
IV Formation mechanisms
Averaged simulation results can be found in Table III. The data for includes only the results of those simulations which produced a crater. The error bars indicate standard deviation of those events. The cratering probability was calculated as the ratio of cratering events to total number of events, , and it was always larger than 40% for the energies studied.
A Role of spikes at different energies
In the early work of Thompson and Johar [47], where large deviations from linear cascade theory were found, it was proposed that thermal spikes were not necessary, and that a decrease in the surface binding would be enough to explain the data. In our simulations spikes are certainly playing a large role and, since the surface damage is considerable, the surface binding also decreases.
It has been claimed that the energy density in the cascade determines the crater formation [1, 10, 35], and that an energy density larger than is needed to produce a crater. On the other hand, several models [46, 5] assume that the flow of liquid atoms towards the surface can occur when atoms have eV, giving a much lower energy density than before, . We now use our simulation results to elucidate the reasons behind this apparent discrepancy.
In order to verify the first assumption, a simple estimate can be made as follows. For instance, for keV bombardment, we can assume an hemispherical crater of radius , and that is shared by all atoms inside the crater, which gain an energy , . Using Å, close to the one found in MD (see Table III), gives 3336, eV/atom atom, if most of the energy is originally deposited inside the crater region. from MD compares well with the missing crater volume. The agreement is quite good, except for energies below 20 keV, when craters are shallow, or energies above 50 keV, where a significant fraction of the energy is deposited deep inside the sample. However, as can be seen from Table II, the energy density at energies above 10 keV is much smaller than , although higher than . At lower energies the energy density increases, but still is smaller than the minimum energy that would produce craters according to Ref. [1]. The cascade in the simulation 10-8, in Table II, has a crater size Å, and keV. Inside a cylinder of radius 20 Å, and height 35 Å there are 2595 atoms, and eV . This gives ( eV/Å3). Discarding the atoms with kinetic energy below gives .
Thus we see that the apparent contradiction in energy densities mentioned earlier may at least in part arise from the fact that the energy density needed for crater production does in fact strongly depend on the spike lifetime.
Merkle and Jäger proposed that surface spikes were the cause of the cratering and sputtering yield enhancement they observed in Bi+ and Bi++ bombardments of Au. Crater formation in our simulations is related to the probability of the cascade being close to the surface (see Section IV C), as in their work. However, since they could only see craters with a radius larger than 25 Å, they find a high energy threshold for crater formation. In our simulations we observe that crater formation can still occur at relatively low bombarding energies, but the crater size is well below the detection limit of Merkle and Jäger (see Fig. 3). They also assume that atoms originally resident at the crater site are all sputtered, while we now know that most of the atoms will be redeposited at the crater rim and will not contribute to the sputtering yield.
Based on the above discussion and the results in Section III, we can identify two regimes in the crater formation process. First, at low energy deposition only a relatively small hot region is created. For single ions this will occur when the penetration depth has roughly the same size as the lateral range of the ion, i.e. up to 10 – 20 keV in Xe Au. If the energy density deposited in the cascade is larger than a crater will be formed, provided the cascade is connected to the surface and did not decay into multiple subcascades. The probability of crater formation is slightly lower than one only because of the latter reason. For energies lower than 1 keV, the lateral size of the cascade is of the order of the lattice spacing, and it would be difficult to distinguish a crater from a small vacancy cluster. We did perform a number of 400 eV events, and found that 4 out of 17 events simulated resembled craters. However, because of the difficulty of clearly defining what is a crater with the very small number of atoms involved, we did not include these events in the quantitative analysis. In the low-energy (1 – 20 keV) regime, the crater has a roughly hemispherical shape, the radius of the crater is close to the radius of the lateral range of the ion in the solid, and the dependence of the size with energy follows the law. Prompt sputtering of hot atoms cools down the spike significantly.
Second, at high energy deposition, the spike region is large, and the energy density is lower than . However, since the spike is large, the center of the spike cools down much slower that its sides, and there are atoms which can flow out creating a crater. The crater radius is only a fraction of the lateral size of the cascade, since the borders cool down rapidly. Writing
| (1) |
gives a very good estimate of the crater radius as a function of the lateral size of the cascade.
Next we discuss this liquid flow in greater detail.
B Liquid Flow
There will be a crater if the time for atomic outflow, , is close to or larger than the lifetime of the spike, . can be estimated as the time it takes the atoms originally inside the crater to flow out. Assuming for simplicity a cylindrical outflow at constant velocity , and up to a depth ,
| (2) |
is a mean velocity of the atoms after the outflow begins. Writing , . (Ref. [48]). The spike lifetime can be estimated assuming lattice heat conductivity with a constant heat diffusivity (Ref. [49]). Then,
| (3) |
If the lifetime of the spike is estimated as the time that it takes to cool down from the initial energy density to the critical energy density, can also be obtained analytically (assuming a Gaussian temperature profile), given the initial cascade parameters, and gives times within 30% of the simple estimate in Eq. 3. In order to check the validity of Eqs. 2 and 3, we compared the times from those equations to the MD results, using Å2/ps (obtained from MD), and Eq. 1 to obtain the spike radius. Note that typically it is assumed that (Ref. [46]) but, following transport theory, the lateral range is roughly linear with which would mean .
Spike times are generally calculated neglecting the cooling due to evaporation. However, this cooling is significant when only a small hot region is created, and the penetration depth has roughly the same size as the lateral range of the ion, i.e. up to 10 – 20 keV in Xe Au. On the other hand, for 100 keV Xe Au, the lateral size of the cascade is Å, while the ion range is Å (see Table II). The flow of atoms to the surface starts at about 0.1 ps, even though the “ballistic” part is not finished. The ion is colliding further down from the surface, where the spike has not developed yet, but liquid flow already started above this region.
As seen in Table III, Eq. 3 understimates the spike lifetime in the bulk, because is used as the characteristic length scale. However, the agreement between Eq. 3 and the MD results for the lifetime of surface spikes in cratering events is good, while the surface spike lifetime in non-cratering events is shorter, especially at higher energies. The outflow times from Eq. 2 are close to the spike times from Eq. 3 for energies above 5 keV, making possible the crater formation by melt flow.
C Cratering probability
The cratering probability for a projectile with energy , , can be estimated as follows.
where the probability of creating a crater of radius is written as . In order to simplify the analysis, we assume that the probability of producing a crater with certain radius is a delta distribution for , . This is especially valid at low energies, where fluctuations in crater size are not as large as for higher energy, as was also noted in the experiment of Merkle and Jäger [1]. This probability can itself be split in three contributions. is the probability of reaching the threshold energy density in the subsurface layer. is the probability of the spike lifetime being longer than the outflow time. Finally, is the probability of the cascade splitting into two cascades with each having not enough critical energy, or going too deep into the sample. Then,
| (5) | |||||
Note that at low values of , the threshold energy density should be , and that the term will be roughly 1. This is because the crater is created mainly by “ballistic” events, not melt flow.On the other hand, at high energy density, the critical energy is much lower, , and spike times are important. From the MD simulations, we find that depends on energy. It is near 0 at low energies, and increases to 0.2 – 0.4 at higher energies. Of course, for energies much higher than here, it will eventually approach 1.
We show calculated values of in Table III. The values in the table are calculated by using . and were now obtained from MD, but could be obtained from a much simpler BCA calculation. The values for the calculated cratering probability compare well with the values from MD.
For keV liquid flow is the main contribution and the energy density threshold for crater formation is lower, leading to an enhanced cratering probability. The cratering probability decreases rapidly for keV due to cascades being deep below the surface, and splitting due to fast recoils. Our simple model reproduces all these features, and extrapolating our results to keV gives keV and keV), which compares well with the experimental value of keV) from Ref. [36].
V Comparison to experiment
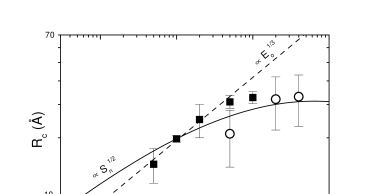
The crater radius from our MD simulations can be seen in Fig. 3 as a function of bombarding energy. The radius can be well approximated by a dependence at low , but at large there is a saturation, which is related to saturation of the energy deposition in the target. This energy deposition can be related to the known values for the stopping power, , and it is included in the figure. There are some models that predict a dependence of the crater radius with (Refs. [50, 51]) and this is the dependence shown in Fig. 3 as , where , and .
The data from Birtcher et al. [10, 35] is also shown in Fig. 3. It is clear that within the uncertainties the experimental and simulated data agree very well, giving good confidence in the validity of our simulations.
In Ref. [35] Donnelly and Birtcher discuss a criterion for crater formation based on the available energy density. They only look at high-energy cascades where spike times are much longer than the outflow time to form a large crater (with the mean size expected for those energies). This corresponds to our high energy region.
The cratering efficiency is much smaller in the experiment (5%) than in our MD simulations ( %). There are two likely reasons for this:
-
1.
Even though crystal orientation was not perfectly known in the experiment, the incidence angle was about 15∘, so there has been a significant amount of channeling (see Table I, and note that both the mean range and straggling are larger for than for ), which decreases the energy deposition close to the surface and therefore the probability of cratering.
-
2.
The cratering probability of 0.05 was found from the ratio of cratering probability to crater destruction cross section. This cross-section could be larger than estimated due to the large ion beam fluxes and possible enhanced atom mobility induced by the electron bombardment.
Donnelly and Birtcher also assume that the faceting of the crater sides occurs slowly by diffusion [35]. However, our simulations show (see Fig. 2) that the craters already are faceted directly in the collision cascades due to the crystal structure.
a)
 b)
b)
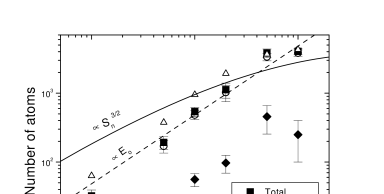
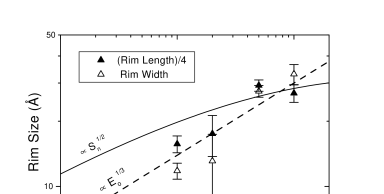
The number of total atoms above the surface after bombardment and the size of the crater rim can be seen in Figs. 4 (a) and (b). As expected from the behaviour of the crater radius, the number of atoms above the surface is linear with at low energies and saturates at higher energies
In the low energy regime we can cast our results in the following form:
| (6) |
| (7) |
Expressing energy in eV and density in Å-3, eV, eVÅ3. Notice that eV . The higher value of indicates that the crater depth is typically smaller than the crater radius, as can be seen in Fig. 4 (a), where the open triangles represent the left side of Eq. 6.
a)
 b)
b)
VI Role of the binding energy of the target
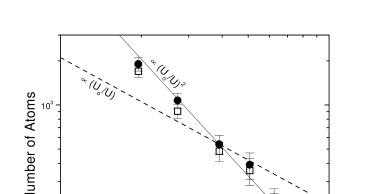
Outside the ion beam community, it has generally been assumed, based on scaling laws, that crater size scales as [31, 29] . This dependence was verified by macroscopic cratering events, like those of gas-gun experiments and astronomical objects where gravity can be neglected [31]. However, this has been recently challenged by results in both EAM Cu [6] and LJ solids [52], where the dependence was found to be . To test this, we repeated our 10 keV Xe bombardment simulations with the Au binding modified by changing the potential as explained in section II.
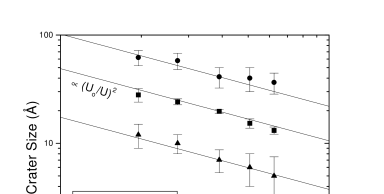
In Fig. 5 a) the number of atoms on top of the surface (as explained in section II D) is plotted versus the binding energy, and a quadratic dependence is found for bindings in the range 1.6-0.5. This quadratic dependence may result from a combination of two factors. We found that the number of atoms in the melt and the lifetime of the spike scale as . Therefore, if the total number of adatoms scales as the product of the liquid atoms generated in the cascade and spike lifetime, the result depends on as (See also Footnote [53]). In Fig. 5-b the crater size is plotted as a function of the binding energy, also showing a dependence of .
VII Comparison with cluster bombardment
Since there are a number of experiments and simulations dealing with cratering induced by cluster bombardment, we discuss some relevant cases.
For cluster bombardment at low , the situation is such that the energy is deposited in a roughly hemispherical region and the threshold for crater formation is similar to what is found for atomic projectiles in the high energy regime.
As mentioned in the introduction, Aderjan and Urbassek [6] recently presented cratering results for CuCu where the number of atoms in the crater was found to scale as
| (8) |
In addition, a scaling with was found. Using Eq. (8) for 20 keV bombardment of Cu, gives , while using the density and binding of Cu in our Eq. (7) gives , in an excellent agreement with the previous estimate. Notice that the 20 keV Xe bombardment deposits all its energy close to the surface, as the Cun clusters do. The scaling found by Aderjan and Urbassek can not explain the experimental results of Xe bombardment of Au, nor the results for bombardment of C60 on HOPG [54], since the crater size increases always linearly with energy. This gives additional evidence for the need of a more complex model. Besides, Aderjan and Urbassek suggested that presence of viscosity may be the cause of the quadratic behavior with . However, for EAM liquids near the freezing point, the viscosity scales as (Ref. [55]). If the crater is formed mainly by outflow we can consider some simplified cylindrical flow and use Poisson’s equation, where the number of flowing atoms is . This would give only an extra factor of 0.25 in the exponent and therefore it is quite unlikely to be the reason for the transition from linear to quadratic behavior.
Typically, cluster bombardment simulations and experiments have been done at low energy per bombarding atom. For C60 bombardment of HOPG, the crater “trace” (corresponding roughly to the rim length in our simulations), measured with an STM, was found to be proportional to , from 100 eV/atom up to 1 keV/atom, even though the experimental errors are quite large [54]. A hemispherical crater is created, whose radius follows the law: , with . This mean energy is consistent with the low energy densities found in the molten region.
All these results support our findings that spikes play a major role in crater formation, and that a simple linear scaling of the crater volume with the bombarding energy is not a good description except at very low energies.
VIII Comparison with models for other kinds of materials
Even though most cratering studies have been performed in the regime where the bombarding ion deposits most of its energy in elastic collisions, there are a number of experiments [2, 3] and simulations [56, 57, 58] dealing with cratering in the regime where most of the energy is initially deposited in the electrons of the target. Experiments and simulations of cratering in solids made of large biomolecules [56, 57] suggested that the crater formation process is mainly due to the large pressure pulse following electronic relaxation. However, the mechanisms of surface erosion on condensed gas solids [58] seem to be controlled by thermal spikes, with pressure playing only a secondary role in crater formation.
Condensed gas solids and other soft materials can be reasonably well approximated by using simple 2-body potentials, as the Lennard-Jones potential (LJ). The track of excitations can be modeled as a cylindrical track of radius , with atoms having some extra kinetic energy, i.e., a cylindrical spike. For tracks of fixed radius, , with , there seems to be a critical energy density necessary for crater formation, which is close to [52]. For rim formation, the energy density needed is even higher, of the order of the bulk modulus of the material or . However, large craters can also be produced at a low energy density, as in the case of 100 keV Xe Au. In LJ solids this has been seen in simulations of tracks, where produces no crater for a spike radius , while for the same energy density can produce large craters because the spike lasts longer [59]. LJ rare gases are comparatively stiffer than metals, and the pressure pulse associated with the high temperature spike takes a significant fraction of the energy when the energy density is large, but it can be neglected for low energy densities. This also decreases the relative lifetime of the spike as compared to metals.
There are of course several differences to ion bombardment of metals, where the spike radius will vary significantly with the energy of projectile, and the energy deposition will not be uniform with depth, leading sometimes to energy deposition profiles closer to spherical geometry. In track simulations there is always a region at the surface, the top of the cylindrical track, which is energized. On the other hand, in the case of ion bombardment in the nuclear stopping regime, the peak in the energy deposition occurs below the surface. However, in the regime with energy above 10 keV for Xe bombardment, the created spike is initially roughly cylindrical, and one would hope certain scaling still to be valid.
In EAM fcc metals the critical energy density needed for crater formation for relatively narrow cascades is also close to , while for more extended cascades much lower energy densities also produce cratering. However, the energy density equivalent to the bulk modulus of Au is 1.04 eV/Å. This energy density is never reached in the Xe bombardment. On the other hand, the shear modulus is equivalent to .
In the LJ track simulation, significant cascade splitting does not occur because of the initial conditions and can be neglected. In addition, because of the many body contribution in the EAM potential, the binding of small clusters is larger than in the LJ potential, and this may lead to an enhanced liquid flow to the surface.
In Fig. 6 we compare the current results on cratering by Xe in EAM Au with those of cratering in a LJ solid by high-energy ions [52]. To make the two cases comparable, we give the abscissa in terms of for an incident ion with energy , and the crater radius scaled by the characteristic length scale of the material . The figure shows that there is remarkably good agreement between the scaling of the crater radius with the stopping power. The rim width shown in the inset, however, does not follow any simple scaling law. The likely reason is the different heat spike geometry (cylindrical vs. hemispherical) leading to different crater shapes.
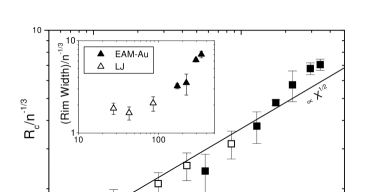
Thus we see that despite of the major differences between metals and some insulators which can be modeled as LJ solids, the crater sizes can still be understood in the same framework, when the incident energy deposited into atomic collisions (either directly or via electronic excitations) is considered along with the stopping power of the material.
IX Conclusions
In conclusion, we have examined crater production by 0.4 – 100 keV Xe ions impacting on Au using classical MD simulations. On the basis of our results, we could show that the cratering mechanisms can not be understood in terms of a single parameter (such as a single energy density), but rather in terms of two energy regimes. In the low-energy regime (ion energies of keV in the present system) the cascades which produce craters need to have relatively high initial energy densities, . However, at higher energies ( keV) the liquid formed in the heat spike can become so long-lived that plenty of time is available for liquid flow, and a much lower initial energy density () suffices for crater formation. These observations explains some apparent discrepancies between previously presented cascade models.
We further demonstrated by direct simulation the importance of cascades splitting into subcascades on the cratering probability, and presented an analytical framework which can be used as a basis for further model development accounting for cascade splitting, energy density thresholds, and spike lifetimes. Furthermore, we showed that by using scaling laws and parameters calibrated from MD, simple BCA codes such as SRIM can be used to estimate cascade formation probabilities
We obtained excellent agreement with crater sizes measured experimentally in the same system.
Comparison with simulations of cluster bombardment and crater formation in LJ solids, which serve as models for some organic materials, showed that a wide range of microscopic cratering events can be understood in the same framework provided that appropriate scaling of the energy deposition and length scales are used.
We also showed that macroscopic cratering laws behave quite differently from the microscopic ones because of the importance of the liquid flow in the microscopic system, but not in the macroscopic systems. Conversely, we note that the results on cascade cratering may imply the need for a re-evaluation of macroscopic scaling laws for materials which expand strongly on melting, if the projectile can create a high enough energy density.
Acknowledgements
We thank Prof. R. S. Averback, Prof. R. E. Johnson, and Prof. S. E. Donnelly and Dr. R. C. Birtcher for useful discussions. Ms. L. Uusipaikka is acknowledged for performing the 400 eV simulations. The research was supported by the Academy of Finland under project No. 73722 and the Vilho, Yrjö and Kalle Väisälä foundation. Generous grants of computer time from the Center for Scientific Computing in Espoo, Finland are gratefully acknowledged.
REFERENCES
- [1] W. Jäger and K. L. Merkle, Phil. Mag. A 57, 479 (1988).
- [2] R. M. Papaléo, L. S. Farenzena, M. A. de Araujo, R. P. Livi, M. Alurralde, and G. Bermudez, Nucl. Instr. Meth. Phys. Res. B 148, 126 (2000).
- [3] R. M. Papaléo, Nucl. Instr. Meth. Phys. Res. B 131, 121 (1997).
- [4] F. Thibaudau, J. Cousty, E. Balanzat, and S. Bouffard, Phys. Rev. Lett. 67, 1582 (1991).
- [5] Q. Yang, T. Li, B. V. King, and R. J. MacDonald, Phys. Rev. B 53, 3032 (1996).
- [6] R. Aderjan and H. M. Urbassek, Nucl. Instr. Meth. Phys. Res. B 164-165, 697 (2000).
- [7] C. T. Reimann, Nucl. Instr. Meth. Phys. Res. B 95, 181 (1994).
- [8] D. A. Kolesnikov, C. T. Reimann, and I. V. Vorobyova, Nucl. Instr. Meth. Phys. Res. B 122, 255 (1997).
- [9] I. V. Vrobyova, Nucl. Instr. Meth. Phys. Res. B 146, 379 (1998).
- [10] R. C. Birtcher and S. E. Donnelly, Phys. Rev. Lett. 77, 4374 (1996).
- [11] K. Nordlund, J. Keinonen, M. Ghaly, and R. S. Averback, Nature 398, 49 (1999).
- [12] K. Kyuno, D. C. Cahill, R. S. Averback, J. Tarus, and K. Nordlund, Phys. Rev. Lett. 83, 4788 (1999).
- [13] M. Ghaly, K. Nordlund, and R. S. Averback, Phil. Mag. A 79, 795 (1999).
- [14] M. Ghaly and R. S. Averback, Phys. Rev. Lett. 72, 364 (1994).
- [15] T. Aoki, Ph.D. thesis, Kyoto University, 2000, http://nishiki.kuee.kyoto-u.ac.jp/~t-aoki/papers/doctor/index.html.
- [16] R. S. Averback and T. Diaz de la Rubia, in Solid State Physics, edited by H. Ehrenfest and F. Spaepen (Academic Press, New York, 1998), Vol. 51, pp. 281–402.
- [17] H. H. Andersen, A. Brunelle, S. Della-Negra, J. Depauw, D. J. D, Y. Le Beyec, J. Chaumont, and H. Bernas, Phys. Rev. Lett. 80, 5433 (1998).
- [18] I. Yamada, Mat. Chem. and Phys. 54, 5 (1998).
- [19] I. Yamada, J. Matsuo, N. Toyoda, T. Aoki, E. Jones, and Z. Insepov, Mat. Sci. and Engnr. A 253, 249 (1998).
- [20] I. Yamada, Nucl. Instr. and Meth. B 148, 1 (1999).
- [21] T. Colla, R. Aderjan, R. Kissel, and H. Urbassek, Phys. Rev. B 62, 8487 (2000).
- [22] E. M. Bringa and R. E. Johnson, Nucl. Instr. Meth. Phys. Res. B 143, 513 (1998).
- [23] V. I. Shulga and P. Sigmund, Nucl. Instr. and Meth. B 47, 236 (1990).
- [24] R. S. Averback, T. D. de la Rubia, H. Hsieh, and R. Benedek, Nucl. Instr. and Meth. B 59/60, 709 (1991).
- [25] M. Ghaly and R. S. Averback, Mat. Res. Soc. Symp. Proc. (Materials Research Society, Pittsburgh, 1992), Vol. 279, p. 17.
- [26] Z. Insepov and B. Kabdiev, Intern. Conf. on Phys. and Chem. of Finite Systems: from Clusters to Crystals (PUBLISHER, ADDRESS, 1992), Vol. 1, p. 429.
- [27] Z. Insepov and I. Yamada, Nucl. Instr. and Meth. B 112, 16 (1996).
- [28] T. Aoki, J. Matsuo, Z. Insepov, and I. Yamada, Nucl. Instr. and Meth. B 121, 49 (1997).
- [29] Z. Insepov, R. Manory, J. Matsuo, and I. Yamada, Phys. Rev. B 61, 8744 (2000).
- [30] K. Nordlund, L. Wei, Y. Zhong, and R. S. Averback, Phys. Rev. B (Rapid Comm.) 57, 13965 (1998).
- [31] D. Gault, J. E. Guest, J. B. Murray, D. Dzurisin, and M. Malin, J. Geophys. Res. 80, 2444 (1975).
- [32] C. W. Lampson, Effects of Impact and Explosion (Office of Scientific Research and Development, ADDRESS, 1946), Vol. 1, p. 110.
- [33] S. Quinones and L. Murr, Phys. Stat. Sol. A 166, 763 (1998).
- [34] in Impact and explosion cratering, edited by D. J. Roddy and O. Pepin (Pergamon Press, New York, 1977).
- [35] S. E. Donnelly and R. C. Birtcher, Phys. Rev. B 56, 13599 (1997).
- [36] R. Birtcher, S. Donnelly, and S. Schlutig, Phys. Rev. Lett. 85, 4968 (2000).
- [37] K. Nordlund, M. Ghaly, R. S. Averback, M. Caturla, T. Diaz de la Rubia, and J. Tarus, Phys. Rev. B 57, 7556 (1998).
- [38] K. Nordlund, J. Keinonen, M. Ghaly, and R. S. Averback, Nature 398, 49 (1999).
- [39] H. H. Andersen, Appl. Phys. 18, 131 (1979).
- [40] S. M. Foiles, M. I. Baskes, and M. S. Daw, Phys. Rev. B 33, 7983 (1986).
- [41] J. F. Ziegler, J. P. Biersack, and U. Littmark, The Stopping and Range of Ions in Matter (Pergamon, New York, 1985).
- [42] M. S. Daw, S. M. Foiles, and M. I. Baskes, Mat. Sci. Rep. 9, 251 (1993).
- [43] F. A. Lindemann, Phys. Z. 11, 609 (1910).
- [44] K. Nordlund, Comput. Mater. Sci. 3, 448 (1995).
- [45] J. F. Ziegler, 2000, sRIM-2000.39 computer code, private communication.
- [46] R. S. Averback and M. Ghaly, J. Appl. Phys. 76, 3908 (1994).
- [47] D. A. Thompson and S. S. Johar, Appl. Phys. Lett. 34, 342 (1979).
- [48] This estimate neglects the energy barrier needed for the outflow, which is expected to be much lower than the binding energy. If the barrier, , is known, then should be multiplied by .
- [49] Because the most recent evidence indicates that energy transfer to the electronic subsystem occurs over timescales longer than those active in cascades, the electronic heat conductivity can be neglected at least as a first approximation. See Ref. [30, 60].
- [50] Y. Yamamura, Nucl. Instr. Meth. 194, 515 (1982).
- [51] I. Bitensky and E. Parillis, Nucl. Instr. Meth. Phys. Res. B 21, 26 (1987).
- [52] E. M. Bringa, R. Papaleo, and R. E. Johnson, (2001), submitted.
- [53] This argument relies on the observation that the melting point scales linearly with the inverse of the cohesive energy, as it does in the simple modification of the potential used here. However, we have earlier found that by modifying only the repulsive part of the interatomic potential, the melting point can be modified with no change in the cohesive energy [30]. Although it would be of some interest to examine the crater size scaling for such a change, this is not directly instructive for the main point of the present paper, namely the comparison with macroscopic scaling laws, and hence will not be done here.
- [54] T. Seki, T. Aoki, M. Tanomura, J. Matsuo, and I. Yamada, Materials Chemistry & Physics 54, 143 (1997).
- [55] N. H. March, Phil. Mag. A 80, 1335 (2000).
- [56] D. Feny and R. E. Johnson, Phys. Rev. B 46, 5090 (1992).
- [57] R. E. Johnson, B. U. Sundqvist, A. Hedin, and D. Feny , Phys. Rev. B 40, 49 (1989).
- [58] E. M. Bringa and R. E. Johnson, Nucl. Instr. Meth. Phys. Res. B 152, 267 (1999).
- [59] E. M. Bringa, R. E. Johnson, and M. Jakas, Phys. Rev. B 60, 15107 (1999).
- [60] A. E. Stuchbery and E. Bezakova, Phys. Rev. Lett. 82, 3637 (1999).