Electronic structure and weak electron-phonon coupling in TaB2
Abstract
We present electronic structure calculations together with resistivity, susceptibility, and specific heat measurements for TaB2 to search for the recently contradictorily reported superconductivity and to study related normal state properties. We ascribe the absence of superconductivity down to 1.5 K for our TaB2 samples to the generally weak electron phonon coupling derived from comparison of the calculated and measured specific heat constants. For the E2g and the B1g point phonons we derive from the calculated deformation potentials very small electron phonon couplings for these modes, opposite to the strong coupling of the E2g mode in MgB2, probably responsible for its high . In comparison to MgB2, we discuss the origin of the quite different features in the density of states and of the Fermi surfaces. The differences are mainly due to the strong hybridization between Ta 5 and B 2 states outside the hexagonal basis plane.
74.25-q,71.20.-b
I introduction
The recent discovery of superconductivity in MgB2[2] has initiated an immediate broad research activity due to the surprisingly high transition temperature 40 K in a seemingly ordinary metal. Investigation of related diborides MB2 (M = Li, Be, Al) [3, 4, 5] and a series of isostructural transition metal diborides (M = Sc, Ti, Zr, Hf, V, Ta, Cr, Mo, Nb) [6, 7, 8] has shown that only few of them seem to be superconducting, and then only at very low temperatures. Since the understanding of the pairing mechanism in MgB2 is still in its early stages, a study of the isomorphic compounds with low transition temperatures or with absence of superconductivity, respectively, could be helpful in clarifying the expected very substantial electronic differences.
Contradictory reports about superconductivity in TaB2 have appeared; one found superconductivity at 9.5 K,[9, 10] while another found no superconductivity down to 4.4 K.[11] TaB2 is isovalent with NbB2, where the occurrence of superconductivity, or at least the value of Tc, is likewise uncertain. NbB2 was reported to be superconducting at 3.87 K,[7] superconducting only at 0.62 K,[8] and not superconducting above 0.37 K.[11] Clearly there is sample dependence for both TaB2 and NbB2, and no doubt for many other diborides as well.
In an attempt to begin to settle some of these discrepancies, we address TaB2 specifically in this paper with a joint theoretical (Secs. II A and III A) and experimental (Secs. II B, III B) investigation. In Sec. III we provide an analysis of its electronic structure, and contrast it with that of MgB2. We also present specific heat, susceptibility as well as resistivity data for two almost single phase samples. One of them exhibited a significant amount of boron vacancies.
II Methods
A Band structure calculations
We calculated the electronic structure of TaB2 in the hexagonal space group (SG) P63/ (No. 191) with the lattice constants = 3.082 Å and = 3.243 Å.[9] The frozen phonon calculations for the E2g and B1g modes where done in the orthorhombic SG C (No. 65) and in the trigonal SG P (No. 164), respectively.
Our band structure calculations were performed using the full-potential nonorthogonal local-orbital minimum-basis scheme (FPLO) [12] within the local density approximation (LDA). In these scalar relativistic calculations we used the exchange and correlation potential of Perdew and Zunger.[13] Ta , ,, , 5 states and B 2, 2, 3, were chosen as minimum basis set for the valence states. All lower lying states were treated as core states. The inclusion of the relatively extended Ta , semi-core states as band states was done because of the considerable overlap of these states on nearest neighbors. This overlap would be neglected if they were treated as core states in our FPLO scheme. Accounting for this overlap is of importance especially for the calculations of phonon frequencies that we report. B 3 states were added to allow for boron polarizability. The spatial extension of the basis orbitals, controlled by a confining potential [14] , was optimized to minimize the total energy. The self-consistent potentials were carried out on a -mesh of 20 -points in each direction of the Brillouin zone, which corresponds to 481, 784 and 1221 in irreducible part for P6, P, and C SG, respectively. Our FPLO approach has been proved by recent comparison to FLAPW results in many cases to have an absolute accuracy of 1mHartree/atom for the total energy and a much higher accuracy for the relative total energy changes.
B Sample preparation and measurements
Two different TaB2 samples, one with near stoichiometric and one with boron deficient compositions, were prepared starting from the pure elements Ta ( 99.9%) and B ( 99.9%) by arc melting furnace under purified argon atmosphere. To ensure a better homogeneity the samples were turned several times. The phase content was checked by X-ray diffraction (XRD) using Co-K radiation.
The samples contain the hexagonal AlB2 phase mainly, 95% in sample No. 1 and 97% in sample No. 2. In both samples small amounts ( 5%) of a second phase were found which are B for sample No. 1 and Ta3B4 for sample No. 2. The compositions of the main phases measured by electron probe microanalysis in the WDX modus showed a composition of about TaB2.03 (sample No. 1) and compositions of TaB1.29 (sample No. 2).
Furthermore, the XRD resulted in quite different lattice parameters for the two samples ranging from = 3.0980.002 nm and = 3.2240.003 Å of the B-deficient sample to = 3.067 0.002 Å and = 3.286 0.006 Å of the B-rich sample.
The specific heat of both TaB2 samples was measured in the temperature range between 2 and 16 K using a Quantum Design PPMS relaxation calorimeter. The addenda which were determined in a separate run were subtracted in order to obtain the specific heat data for TaB2.
Magnetization measurements have been performed using a Quantum Design-SQUID magnetometer in the temperature range down to 1.8 K. Resistivity measurements down to 1.5 K have been performed using the standard four point method.
III Results and discussion
A Theoretical results
In Figure 1 we display the total as well as the atom decomposed density of states (DOS) of TaB2. The B and Ta states share almost equally in the occupied valence bands in the region -10 to -2 eV (the Fermi level is taken as the zero of energy). Our DOS is in agreement with that of P.P. Singh[15], which we became aware right after the completion of our study.
A striking difference in comparison to MgB2 is the dominating contribution of Ta states to the DOS at Fermi level, which contribute about 70% of the total DOS; in MgB2 the DOS at Fermi level is dominated by B- states (see Figure 2 for comparison [16]). Although a rigid band picture is very limited in this case, a valence analysis shows that due to the 3 additional valence electrons of Ta with respect to Mg, the Fermi level has shifted from the bonding B states below the hybridization gap in MgB2 to the anti-bonding states above this gap in TaB2. From the very similar shape of the partial B and Ta DOS, a strong hybridization between B and Ta states is obvious, mentioned below in more detail.

The calculated value of the density of states at the Fermi level is slightly higher for TaB2 ( = 0.91 states/(eVcell)) than for MgB2 ( = 0.71 states/eVcell), in agreement with Refs. [17, 18]). This corresponds to a bare specific heat coefficient = 2.14 mJ/(moleK2) for TaB2.

Figure 3 shows the band structure of TaB2 along the symmetry lines of the hexagonal cell. As already mentioned above, the bonding B states, which lie in the region -10 eV to -2 eV and are highlighted in the middle panel, are completely filled. These states, which are unoccupied along the -A direction in MgB2 (compare to Figures 1 of Refs. [17, 18]), lie now between -5 eV and -2 eV for this symmetry line and show almost 3 eV dispersion along the hexagonal axis (-A) compared to 0.6 eV in MgB2. The two-dimensional character of these states in MgB2 is obviously destroyed in TaB2. Furthermore, we find around the A-L-H plane of the -space a strong hybridisation of those B states with the Ta 5dxz and 5dyz states, indicated in the lower panel of Figure 3. Once more we like to emphasize the difference to MgB2, where these states are of nearly pure B character.

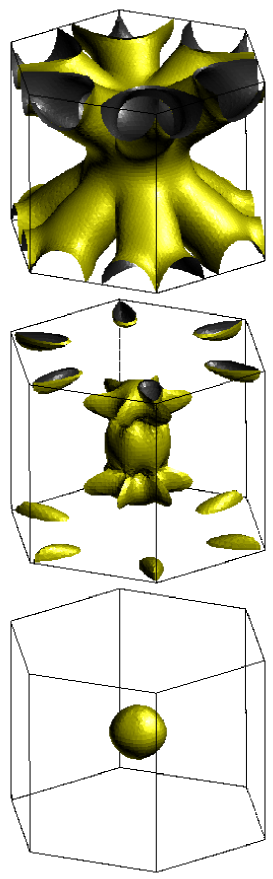
The corresponding Fermi surface (FS) of TaB2 is shown in Figure 4. For convenience of comparison with MgB2 (compare to Fig. 3 in Ref. [18]), we have chosen the A point as the center of the hexagonal prism. All three sheets of the FS of TaB2 are electron-like. Because of the strong dispersion of the antibonding B - Ta 5dxz,yz states, they build closed FS around the A point (see middle and lower panel of Fig. 4), where the hole-like quasi two-dimensional tubes are found in MgB2. The large FS in the upper panel of Fig. 4 is due to Ta 5d states, the contribution of B states to this sheet is almost negligible.
To account for the experimental uncertainty in the lattice constants for different samples [19], we also investigated the influence of different lattice constants for the experimentally reported range on the electronic structure. The changes for the relevant features in the band structure are negligible, the DOS is basically unchanged, N() varies by less then 2%.
For a rough estimate of the electron-phonon (el-ph) coupling in TaB2, we calculated the phonon frequencies and the deformation potential of the E2g (in-plane displacement of the borons) and the B1g (borons displaced along in different directions) zone-center phonon modes. Their frequencies are 98 meV and 85 meV, respectively. For the corresponding frequencies in MgB2 Kortus et al. [18] reported 58 meV and 86 meV, respectively. For AlB2 118 meV and 60 meV, respectively, were calculated. [20] Already from the strong hardening of the calculated E2g frequency compared with MgB2 one can conclude a strongly reduced electron phonon coupling of this mode.
Figure 5 shows the calculated band structure for the frozen E2g phonon mode of TaB2 with a B displacement of = 0.018 Å. The B bond stretching mode splits the antibonding B -Ta 5dxz,yz bands along the -A line. For an averaged split 9 eV/Å we find a deformation potential 4.5 eV/Å about 3 times smaller than in MgB2. [17] Calculating larger elongations up to the actual rms we found a nearly linear dependence of the deformation potential on the elongation .
Following Ref. [17], we can estimate the coupling from this mode alone using Eq. (2.34) of Kahn and Allen [21] for the EP matrix element in terms of . With = 0.28, resulting from a summation of the calculated orbital projected DOS for the orbitals mainly involved in the deformed band, we find
| (1) |
The sum on runs over the two B atoms of the E2g mode, for we used the isotope averaged mass of B. Due to the high frequency and the smaller deformation potential , we get a coupling smaller by a factor of about 20 compared to MgB2.
From a corresponding calculation of the coupling constant for the B1g mode, reported [20] to be softened in AlB2 ( = 60 meV), we find an even slightly smaller contribution compared with the already weak coupled E2g phonon.
Assuming similar coupling to the acoustic phonons as reported [20] for MgB2 or AlB2 and comparable contributions of other modes, the total el-ph coupling constant might be no more than 0.2.
B Experimental results
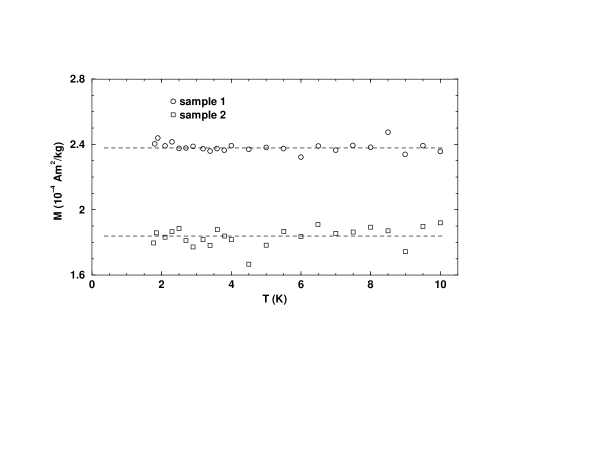
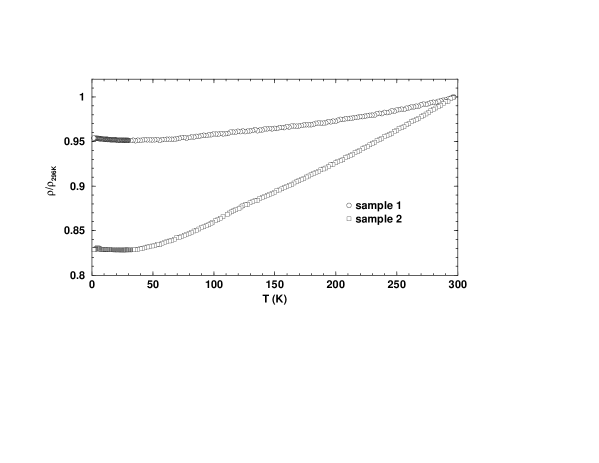
The results of the specific heat measurements are shown in Figure 6. Since no superconductivity was observed at least in the temperature range down to 1.8 K from magnetization measurements (see Figure 7), and down to 1.5 K from resistance measurements (see Figure 8), the results of the specific heat measurements are shown in the vs. plot. Thus, assuming standard normal metal behaviour, the Sommerfeld coefficient was determined using the relation
| (2) |
where being the ideal gas constant and the initial Debye temperature.
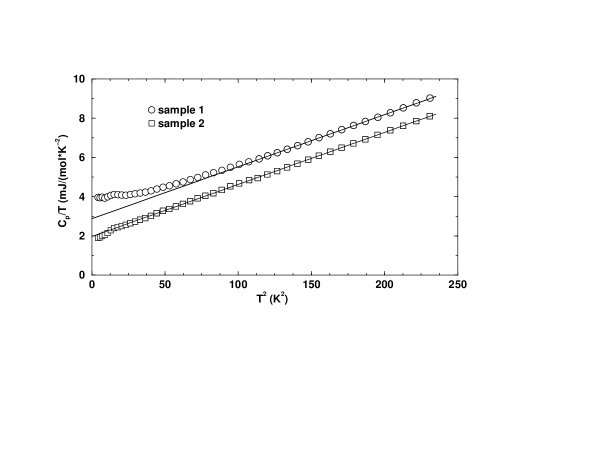
The investigated TaB2 samples show distinct anomalies at temperatures around 4 K which are, however, not due to superconductivity as was found from magnetization and resistance measurements.
Sizable deviations from the linear fits, shown in Figure 6 are observed especially for sample No. 1. Similar deviations as found for these two samples are known as well from MgB2 [22, 23, 24]. Since such anomalous contributions do not essentially change in the superconducting state of MgB2, we ascribe them to lattice effects related to boron disorder present in all diborides.
Naturally, the initial Debye temperature 417 2 K is smaller than the corresponding value reported for MgB2 of 750 to 800 K [25, 23, 22]. But it is somewhat harder than the value one might expect from a simple scaling with the square root of the total mass ratio: 369 11 K. This is in line with the hardening calculated for the optical phonons at the -point as reported above.
| Sample | ||||
|---|---|---|---|---|
| No. | [mJ /mol K-2)] | [K] | RRR | cm |
| 1 | 2.8 | 415 | 1.05 | 350 |
| 2 | 2.0 | 419 | 1.2 | 199 |
The theoretically estimated value of the el-ph coupling constant is in accordance with those small values derived by comparing the experimental value of the Sommerfeld constant (see figure 6) with the calculated DOS at the Fermi level
| (3) |
Using our calculated = 2.14 mJ/moleK2 and the measured = 2.8 mJ/moleK2 of sample No. 1, we obtain an empirical value of . If this estimate is correct, a sizable contribution of relatively low-frequency phonons involving Ta-vibrations can be expected.
The low value of mJ/moleK2 for sample No. 2 can be ascribed to the significant number of boron vacancies in understoichiometric TaB2-δ samples. Within a very crude estimate, supposing a rigid band behaviour and using the atomic partial density of states ) and ) (see Figure 1) we assume for the effective bare specific heat constant
| (4) |
For TaB1.29 (sample No. 2) this yields = 1.8986 corresponding to = 0.053. Considering additionally broadening effects in the DOS due to disorder in the vacancy distribution and other impurities, that value can be taken as a lower bound.
Adopting a standard value of the Coulomb pseudopotential one arrives at negligible values of the transition temperature K, irrespectively of the details of the shape of the Eliashberg function, i.e. the averaged phonon frequency. If even the pseudo potential would be ignored, would not exceed 18 mK. Thus, the experimental evidence for the absence of superconductivity, possibly even down to several 100 mK,[6] becomes very plausible already in the traditional electron-phonon Migdal-Eliashberg picture.
IV Conclusions
Although TaB2 occurs in the same crystal structure as MgB2, it should not be considered as a close relative of MgB2 with respect to the electronic structure (even if it would be found superconducting at very low temperatures). The major differences occur due to: (i) the different band filling because of the three additional valence electrons of Ta with respect to Mg, resulting in a shift of the the Fermi level from the bonding B- states in MgB2 to the antibonding B- - Ta- hybrid states in TaB2, (ii) the strong out of plane hybridization of the B 2 states with Ta, (iii) the weak electron phonon coupling, especially of the E2g mode, which is strongly coupled in MgB2.
According to our experimental results, TaB2 is not superconducting down to 1.5 K. Thus, we confirm the earlier results of Refs. [11, 6] and disprove at the same time the speculation about superconductivity around 9.5 K reported in Ref. [9]. Because in our opinion the main reason for the absence of superconductivity in TaB2 is the different position of the Fermi level (with respect to MgB2), huge hole doping might “reintroduce” superconductivity at relatively high temperatures.
In other words, the results obtained here suggest that the empirical absence or low-temperature superconductivity established in many transition metal (or rare earth) diborides with electrons as the potentially paired charge carriers, stressed by Hirsch [26], might be explained in the traditional electron-phonon picture simply by a weak electron-phonon interaction. In that case there is no need to explain this behavior by the absence of a sophisticated Coulomb interaction driven non-phonon mechanism which works exclusively for holes[26].
Corresponding studies for other related transition metal diborides of experimental interest will be published elsewhere.
V acknowledgments
We thank J.M. An and S.V. Shulga for discussions and N. Mattern for providing us with the XRD-data. This work was supported by the DAAD (individual grant H.R.), the ONR Grant No. N00017-97-1-0956, the SFB 463, and the Deutsche Forschungsgemeinschaft.
REFERENCES
- [1] Corresponding author: helge@physics.ucdavis.edu
- [2] J. Nagamatsu, N. Nakagawa, T. Muranaka, Y. Zenitani, and J. Akimitsu, Nature, 410, 63 (2001).
- [3] J.S. Slusky, N. Rogado, K.A. Regan, M.A. Hayward, P. Khalifah, T. He, K. Inumaru, S. Loureiro, M.K. Haas, H.W. Zandbergen, and R.J. Cava, cond-mat/0102262, (2001).
- [4] I. Felner, cond-mat/0102508 (2001).
- [5] Y.G. Zhao, X.P. Zhang, P.Y. Qiao, H.T. Zhang, S.L. Jia, B.S. Cao, M.H. Zhu, Z.H. Han, X.L. Wang, and B.L. Gu, cond-mat/0104063, (2001).
- [6] G.V. Samsonov and I.M. Vinitsky, Refractory Compounds (in Russian), Metallurgia, Moskva, (1976).
- [7] A.S. Cooper, E. Corenzerst, L.D. Longinotti, B.T. Mattias, and W.H. Zachariasen, Proc. Natl. Acad. Sci. 67, 313 (1970).
- [8] L. Leyarovska and E. Leyarovski, J.Less-Common Metals, 67,249 (1979).
- [9] D. Kaczorowski, A.J. Zaleski, O.J. Zogal, J. Klamut, cond-mat/0103571 (2001).
- [10] D. Kaczorowski, J. Klamut, A.J. Zaleski, cond-mat/0104479 (2001).
- [11] V.A. Gasparov, N.S. Sidorov, I.I. Zver’kova, M.P. Kulakov, cond-mat/0104323 (2001).
- [12] K. Koepernik and H. Eschrig, Phys. Rev. B 59, 1743 (1999).
- [13] J. P. Perdew and A. Zunger, Phys. Rev. B 23, 5048 (1981).
- [14] H. Eschrig, Optimized LCAO Method and the Electronic Structure of Extended Systems (Springer, Berlin, 1989).
- [15] P.P. Singh, cond-mat/0104580 (2001).
- [16] Our band structure calculations for MgB2 are in excellent agreement with those of Refs. [17, 18]. The partial DOS naturally differ from Ref. [18] because of different calculational methods. To calculate the partial DOS, we use the projection onto our minimal basis set instead of a projection onto muffin tin spheres in Ref. [18], which finds a large contribution of the interstitial plane wave region.
- [17] J.M. An and W.E. Pickett, Phys. Rev. Lett. 86, 4366 (2001).
- [18] J. Kortus, I.I. Mazin, K.D. Belashchenko, V.P. Antropov, and L.L. Boyer, Phys. Rev. Lett. (to be published)
- [19] The published lattice constants for TaB2 scatter much stronger than the usual experimental errors in an XRD experiment. We found parameter sets reported with 3.057 Å a 3.0966 Å and 3.224 Å c 3.288.[27, 11, 28] The different lattice constants are most probably due to different B contents of different samples.
- [20] K.-P. Bohnen, R. Heid, and B. Renker, Phys. Rev. Lett., (to be published), cond-mat/0103319 (2001).
- [21] F.S. Kahn and P.B. Allen, Phys. Rev. B 29, 3341 (1984)
- [22] Y. Wang, T. Plackowski, and A. Junod, Prep. cond-mat/ (2001)
- [23] R.K. Kremer, B.J. Gibson, and K. Ahn, cond-mat/0102432 (2001).
- [24] E. Bauer, Ch. Paul, St. Berger, S. Majumdar, H. Michor, M. Giovannini, A. Saccone, and A. Bianconi, J. of Phys.: Condens. Matter 13, L487 (2001).
- [25] S.L. Bud’ko et al. PRL 86, 1877 (2001).
- [26] J.E. Hirsch, preprint cond-mat/0102115 v3 (2001).
- [27] P. Villars and L.D. Calvert, “Pearson’s Handbook of Crystallographic Data for Intermetallic Phases” vol. 2, pp. 16939-16940, The Materials Information Society, Materials Park, OH 44073, Library of Congress Catologing in Publication Data (1991).
- [28] S. Otani, M.M. Korsukova, and T. Mitsuhashi, J. of Crystal Growth 194, 430 (1998).