Doping dependence of the electrical and thermal transport properties of CaB6
Abstract
The thermoelectric power and the thermal conductivity of stoichiometric CaB6 and vacancy-doped Ca1-δB6 have been measured between 5 and 300 K. The thermopower of both materials is surprisingly large at room temperature. Across the whole covered temperature range, is negative and the temperature dependence is most likely dictated by band-structure effects. The empirical interpretation of our data involves a calculation of the thermoelectric power by using the Boltzmann equation in the relaxation-time approximation and the assumption of a defect band in the proximity of the lower edge of the conduction band. Good agreement with our data is found by considering acoustic-phonon and ionized-impurity scattering for the electrons in the conduction band which is well separated from the valence band. The thermal conductivity , predominantly due to phonons, may also be described quite well across the whole covered temperature regime on the basis of a Debye-type relaxation-time approximation and assuming the concurring influence of boundary-, dislocation-, Rayleigh-, and resonant-scattering on the mean free path of the phonons.
pacs:
70., 66.70.+f, 71.20.-b, 72.20.-iI Introduction
Recent experiments on hexaborides with divalent metal cations of the alkaline-earth series, namely Ca, Sr and Ba, have revealed some unusual physical properties of these materials. In particular, an itinerant type of weak ferromagnetic order, stable up to temperatures between 600 and 900 K, has been observed in CaB6 and related alloys in a very narrow range of electron doping. [1, 2] The electronic properties of alkaline-earth hexaborides place these materials close to a metal-insulator transition. [2, 3] This has been confirmed theoretically by recent calculations of the electronic structure of divalent hexaborides which have shown that, with the exception of a small region around the X point of the cubic Brillouin zone, the valence- and the conduction bands are separated by a large gap of several eV. [4] The slight band overlap is reduced if the inter-octahedron B-B bond distances increase, finally resulting in the opening of a gap over the entire momentum space. It has also been predicted that the transport properties of SrB6 may be strongly dependent on doping, with changes from a - to an -type metal induced by slight shifts of the Fermi energy around the zero doping value. [4] These observations have led to the speculation that the ground state of undoped divalent hexaborides may be characterized by a Bose condensate of bound electron-hole pairs, or excitons. [5, 6, 7] Weak ferromagnetism may then develop because of a spontaneous time-reversal symmetry breaking via doping. More recent calculations of the single-particle excitation spectrum of CaB6, however, have led to the claim that this material is not a semimetal but a semiconductor with a minimum band gap of 0.8 eV. [8] If this possibility is considered, the experimental observations, which suggest that binary hexaborides are close to a metal-insulator transition, would indicate the presence of a defect band of itinerant charge carriers. In an attempt to resolve the uncertainties with respect to the correct description of this material, we have studied the influence of the chemical composition on the physical properties of CaB6. The electrical resistivity, magnetoresistance, low-temperature specific heat and the optical conductivity of stoichiometric and doped CaB6 samples have been studied and the results have been presented in a previous publication. [2] Below, we present the results of measurements of the thermal conductivity and the thermopower. While data on the electrical conductivity and the electronic contribution to the thermal conductivity provide information on the density of electronic states close to the Fermi energy , the thermopower may serve to establish the energy derivative of , i.e., an additional important detail of the electronic excitation spectrum. One of the samples was prepared in such a way as to obtain material with a close to stoichiometric composition, denoted as CaB6. The second sample, which we denote as Ca1-δB6, contained a small number of vacancies on the calcium sites, inadvertently introduced during the flux-growth procedure and leading to a certain degree of self doping which is difficult to control. This paper is organized as follows. After a brief description of the sample preparation and the experimental methods used in this investigation in section II, we present, in section III, the results of our measurements and their analysis. The conclusions are presented in section IV.
II Samples and experimental methods
Binary hexaborides can be synthesized in a narrow range of composition, with the tendency to be boron-rich with concentrations of metal vacancies up to several percent. Stoichiometric CaB6 crystals can be obtained close to the border of the metal-rich phase boundary.[3, 9] For our experiments the single crystals were grown by a slow-cooling procedure in aluminum flux [10] starting with a nominal ratio CaB3 for the stoichiometric CaB6 sample, and with CaB12 for the metal-deficient Ca1-δB6 sample. The crystals were removed from the flux by leaching in a concentrated sodium hydroxide solution. Subsequent etching with HNO3 was intended to remove possible surface contaminations. The samples on which our transport measurements were made were of prism-type shape with approximate overall dimensions of for CaB6 and for Ca1-δB6.
The thermoelectric power and the thermal conductivity of both samples were measured simultaneously by means of a standard steady-state heat-flow technique. A commercial 4He gas-flow cryostat was used for cooling the sample holder. At one end of a prism-shaped sample, the thermal contact to a copper heat sink was achieved by using high-conductance silver epoxy. The sample heater, consisting of a ruthenium-oxide chip resistor, was attached to the other end of the prism by the same method. Joule heating caused by heater currents of the order of a few mA provided the necessary heat-flow and hence a thermal gradient along the crystals. In order to measure both the temperature difference between two contacts mounted perpendicularly to the heat flow as well as the thermoelectric voltage of our samples with respect to chromel, we used two pairs of calibrated 0.025 mm Au-Fe (0.07 at. %) versus chromel thermocouples. [11] In order to minimize spurious thermal voltages, the thermocouple leads were connected to uninterrupted copper wires reaching three home-built low-noise voltage amplifiers, mounted directly on top of the cryostat insert.
III Experimental results and Analysis
A Thermoelectric power
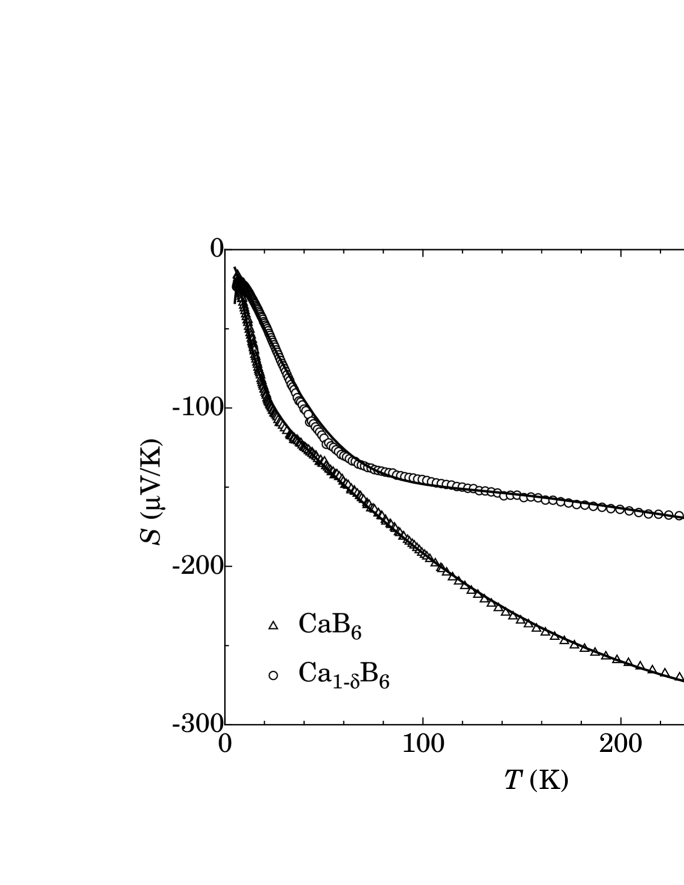
The thermoelectric power of both samples is shown in Fig. 1 on linear scales. The negative sign of clearly demonstrates the dominant -type character of the investigated crystals. The rather large values of , if compared to the typical values observed for the thermoelectric power of common metals, are an indication for the low itinerant charge-carrier concentration in these materials, compatible with the very low values of the electrical conductivity reported previously. [2] The overall temperature dependence of is obviously non-linear, with features that are reminiscent of band-structure effects affecting the thermopower of elements and crystalline alloys. [12] Nevertheless, below and 40 K for CaB6 and Ca1-δB6, respectively, the curves show an approximately linear temperature dependence. A negative thermoelectric power varying linearly with is usually identified as the diffusion thermopower of metals, where the Fermi-energy is located within the conduction band. In the free-electron approximation,
| (1) |
with as the Fermi-energy measured from the bottom of the conduction band, and a factor, typically of the order of unity, describing the energy dependence of the scattering time for the scattering mechanism dominating the low temperature behaviour. [12] From the average slope of below , we may thus calculate a rescaled Fermi energy . These values are and 8.7 meV for CaB6 and Ca1-δB6, respectively. Considering the entire temperature dependence of , in particular the abrupt changes of slopes of around , suggests that ultimately, cannot be explained by simply taking into account electronic states in the conduction band alone. In the following, we try to identify the possible reasons for the measured departure from linearity in the temperature dependence of .
With the common assumption that the current densities and for electrical and thermal transport, respectively, respond linearly to their driving forces, we can write
| (2) | ||||
where is the external electric field and is the temperature gradient. In Eq. 2, the transport coefficients (i=0,1,2) explicitly fulfill the Onsager relations. [13] For , we obtain and , whereas for , we get . These are the equations defining the electronic contribution to the thermal conductivity , the thermoelectric power , and the electrical conductivity , such that
| (3a) | ||||
| (3b) | ||||
| (3c) | ||||
The integrals (i=0,1,2), are defined as
| (4) |
with representing the conductivity spectrum, including all system-dependent features. By partial integration of Eq. 4 and by using the Sommerfeld expansion scheme, we get
| (5) |
which approximates Eq. 3b very well at temperatures . Since we intend to interpret our data over the entire covered temperature range, we will not use the low-temperature approximation represented by Eq. 5, in our analysis. For our purposes the general form of shown in Eq. 3b is more suitable.
Since , the coefficient is strictly positive and the sign of is determined by the sign of the integral . By inspecting the integrand of , represented in Eq. 4, and also by considering Eq. 3b, it may be concluded that the states with energies higher than the chemical potential, i.e., , provide a negative contribution to the thermoelectric power, whereas those states which are located below contribute with the opposite sign. At low temperatures, where only the states very close to contribute to the electronic transport, the measured values are negative. This leads us to conclude that must increase monotonously across , so that the states contributing negatively to in acquire a larger weight than those located below the Fermi-energy, which contribute positively to . In order to reproduce the observed reduction of the slope of at in the calculation, however, we are forced to introduce a “feature” in centered at an energy such that . Since the absolute value of decreases above , the feature in must either reduce the negative contribution to given by the states above , or else enhance the positive contribution to of the states below . In what follows, we assume that in our case the second possibility is realized and we add an additional part to the spectrum, decreasing linearly with increasing energy below . The complete chosen spectrum, corresponding to the Eqs. 7 and 10 below, is shown in Fig. 2.
Based on this preliminary analysis and the model outlined above, we have calculated the electrical transport properties of CaB6 and Ca1-δB6. The Fermi energy is fixed within a parabolic conduction band. Close to the bottom of this band we position an additional band, which may be interpreted as a defect band. With these assumptions, the conductivity spectrum may be written as
| (6) |
For an isotropic parabolic conduction band, the Boltzmann equation in the relaxation time approximation leads to
| (7) |
where the bottom of the conduction band has been fixed to . By setting in Eq. 5, it is easy to recover Eq. 1. For the effective mass of the conduction electrons we used , [4, 8] with as the free electron mass. We only considered two scattering mechanisms of the charge carriers in the conduction band, i.e., scattering by acoustic lattice vibrations, approximated by a rate [14, 15]
| (8) |
and scattering by ionized impurities, with a rate [15]
| (9) |
where and are two constants to be determined by the fitting procedure. If the defect states which are forming a band below the bottom of the conduction band coexist with localized states, the latter may act, when ionized, as scattering centers for the electrons. This justifies considering a term in the scattering rate of the electrons. As we will show below, the existence of localized donor states may also be compatible with our thermal conductivity data. Another possibility is to attribute the rate to the vacancies at the Ca2+-ion sites which would act as negatively charged scattering centers. With the common assumption that the two scattering mechanisms do not interfere with each other, we may use Matthiessen’s rule in the form for the electrons’ average scattering time.
For the defect band, we postulate [16]
| (10) |
with a mobility edge and a constant. Since the quantities and which dictate the temperature dependence of the thermopower, appear in the ratio , depends only on the relative magnitude of the constants , , and . This allows some reduction of the number of fitting parameters. In Fig. 1, the solid curves represent the results of the calculation of . By considering the simplicity of the model and the small number of free parameters (), the agreement with the experimental data is quite remarkable. The Fermi energies which emerge from the fitting procedure amount to 14 and 28 meV for CaB6 and Ca1-δB6, respectively, corresponding to 0 K charge-carrier densities of and , or to and charge carriers per unit cell, respectively. Preliminary results of low-temperature Hall effect measurements performed on a CaB6 sample with the same resistivity as our vacancy-doped sample lead, when interpreted with a single-band model, to a charge carrier density of (Ref. [17]), hence compatible with our results. The value of the mobility edge , introduced to reproduce the kink in at the observed temperatures is approximately meV for both samples. We note, however, that this value strongly depends on the choice of the energy exponent of the low-temperature scattering term. In this sense we have to admit that this result depends on the employed model.
Our calculation of the thermoelectric power relies essentially on the model of the conductivity spectrum (modulo a factor), which we may now test by calculating other electronic transport properties such as the electrical resistivity and the thermal conductivity and compare the results with the experimental data. In Fig. 3, we have plotted the rescaled electrical resistivity of CaB6 calculated with Eq. 3c, together with the experimental data taken on two samples of the same batch. The agreement between the calculated curve and the experimental data is acceptable, especially if one considers primarily the temperature dependence.
By using Eqs. 3c, 4, and 7, combined with the measured resistivity curves shown in Fig. 3, we conclude that the mean free path of the conduction electrons in CaB6 is less than 100 Å. The same length is obtained, obviously enough, by employing the Drude formula and by using , the value cited above for the charge carrier concentration of CaB6. Since the electrons’ wave vector at the Fermi-energy is of the order of Å-1, it seems fair to assume that the Ioffe’s criterion for localization () is close to be fulfilled in CaB6.
B Thermal transport
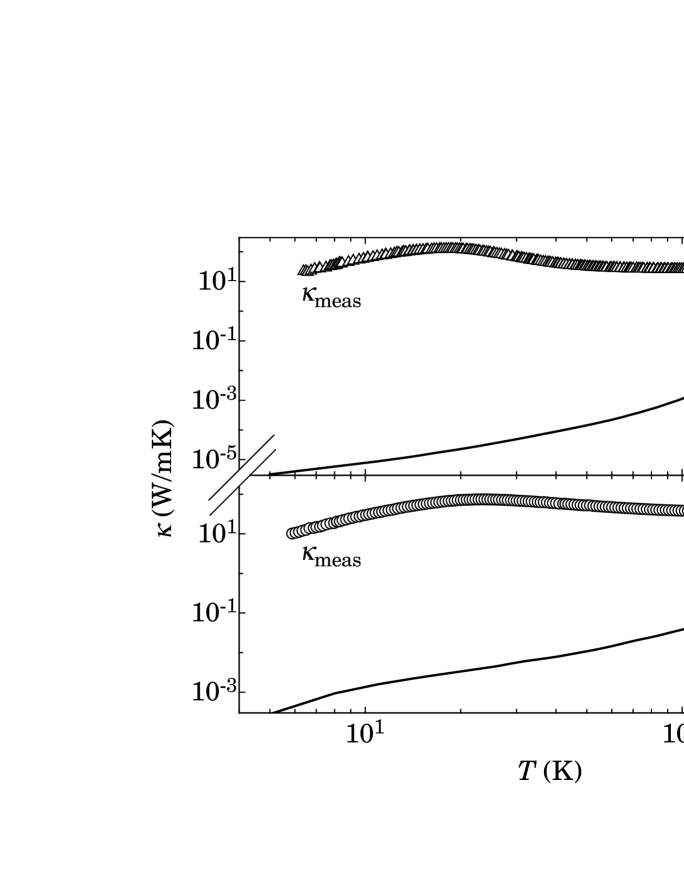
In Fig. 4, we show the measured thermal conductivities of CaB6 and Ca1-δB6 on logarithmic scales between 6 and 300 K. In the further analysis we assume that only conduction-electron and lattice contributions to need to be considered.
A measure for the electronic contribution to the thermal conductivity is given by the quantity , which can be calculated from the Eqs. 3a and 3c. Just like the thermoelectric power , depends only on the relative magnitude of the constants , , and . In a degenerate one-band model, the value
| (11) |
is denoted as the Lorenz number. The ratio can be much higher in semiconductors than in metals, due to the so-called ambipolar diffusion, i.e., the diffusion of electron-hole pairs. In Fig. 5 we plotted the temperature dependence of , calculated by using the fitting parameters provided by our analysis of , together with the value . As expected, is equal to the Lorenz number at very low temperatures. This is so because only the electrons of the conduction band contribute to the transport. The influence of the ambipolar diffusion to the electronic thermal conductivities of CaB6 and Ca1-δB6 is manifest at intermediate temperatures. Nevertheless, this effect is still quite small if compared to enhancements of by two orders of magnitude observed in intrinsic semiconductors. [18]
The electronic contributions to the thermal conductivities of CaB6 and Ca1-δB6, shown in Fig. 4 as solid lines, have beeen calculated by using the Wiedemann-Franz relation , with calculated from the Eqs. 3a and 3c as shown in Fig. 5. For the electrical conductivity , we used the values which have typically been measured on close-to-stoichiometric and vacancy-doped samples, respectively. [2, 19, 20] For both hexaborides, the estimated is at least two orders of magnitude smaller than at all temperatures covered in this study. Since the experimental uncertainty in our measurements of the thermal conductance is of the order of , the procedure for estimating is not critical and may be considered as sufficiently accurate for the validity of the following considerations.
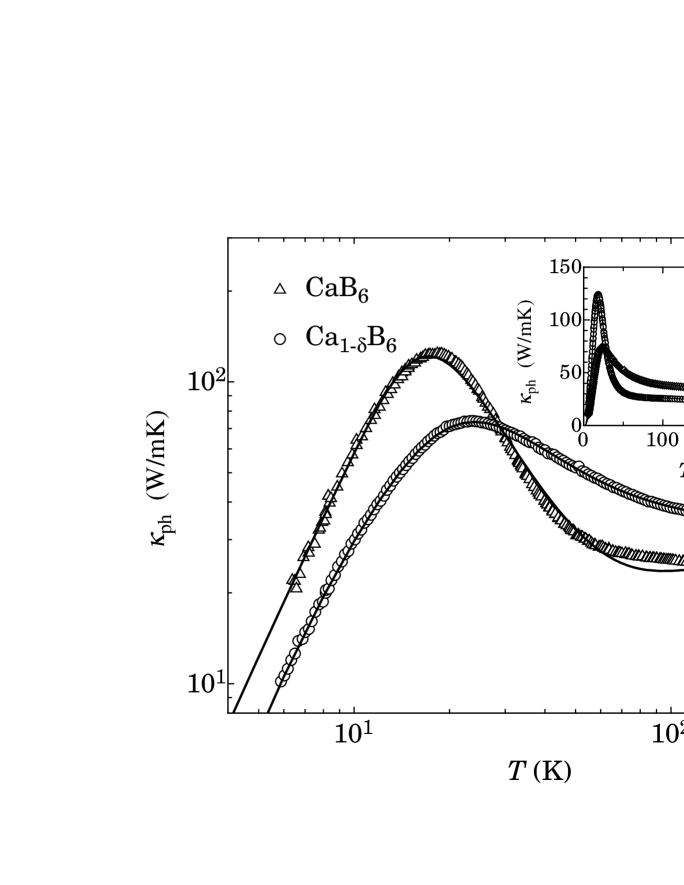
The lattice contributions to the thermal conductivities of both samples are shown in Fig. 6, revealing monotonic increases with up to 18 K and 23 K for CaB6 and Ca1-δB6, respectively. At these temperatures, passes over maxima of 124 and 74 , respectively, and decreases with varying slopes up to room temperature. We note that at low temperatures of Ca1-δB6 attains lower values than for CaB6. This seems reasonable because of an expected enhanced scattering of the phonons by defects in the Ca-deficient material. The crossing of the curves at a temperature close to 30 K is a rather surprising experimental observation which indicates a more efficient high-frequency scattering mechanism of the phonons in the structurally more perfect sample.
The following quantitative analysis of our data is based on a relaxation-time approximation in the context of the Debye model. The Debye approximation is valid at temperatures which are low enough with respect to the Debye temperature , where we may assume that the acoustic branches of the vibrational modes are well approximated by a linear dependence. Since the temperature range covered in our experiment is considerably lower than the Debye temperature K, [2] this approximation is justified to some extent. With this simplification, the thermal conductivity may be calculated from
| (12) |
where is the mean time between collisions of a phonon, the number density of atoms in the crystal, and . By limiting the total density of allowed degrees of freedom to , it is possible to calculate the cut-off frequency , which is related to the slope of . This cut-off frequency defines the Debye temperature of the material which is, in this sense, a measure of the phonon velocity and is usually extracted from low-temperature specific-heat or elastic-constant measurements. For the Debye temperature , we used the above cited value which was extracted from specific-heat measurements on stoichiometric CaB6. [2] Since upon introducing a very small number of calcium vacancies, no significant changes in the lattice contribution to the specific heat are expected, we used the same Debye temperature for CaB6 and Ca1-δB6. This argument is supported by the observation that there are no significant differences between the low-temperature specific heats of CaB6 and Ca1-xLaxB6 with x=0.005. [2] The number density of atoms in CaB6 can be calculated by using the lattice constant Åreported in Ref. [9]. From the relation
| (13) |
we may also calculate the average velocity of the vibrational modes for which we obtain . This value is compatible with the average sound velocity , valid for EuB6 [22] when scaled with the mass-density factor .
For evaluating the integral in Eq. 12, we approximate the phonon relaxation rate by
| (14) |
The different terms on the right hand side of Eq. 14 represent the scattering of phonons at grain boundaries, by the strain fields surrounding dislocations, by point defects and via resonant scattering, respectively. The resulting fits are shown in Fig. 6 as solid lines. In what follows, we discuss each term appearing in Eq. 14 separately. The values of the free parameters involved in our fitting procedure (see below) are given in Table I and the resulting total scattering rates of the phonons are shown as a function of frequency in Fig. 7 for and 100 K.
The temperature and frequency independent scattering length in the first term in Eq. 14, , is the so-called Casimir lenght, where the phonon mean free path is limited by the sample dimensions. [21] The values of 0.303 mm and 0.083 mm for CaB6 and Ca1-δB6, respectively, are of the order of magnitude of the smallest sample dimensions, resulting from the variation of the sample cross section perpendicular to the direction of the thermal current.
The second term in Eq. 14, , is usually attributed to phonon-electron scattering but, as pointed out in Ref. [22], can also be caused by phonon scattering due to strain fields surrounding dislocations. As may be seen in Table I, this term is slightly larger for CaB6 than for Ca1-δB6. In view of the higher density of charge carriers in Ca1-δB6 derived in section III A, this rules out that mainly phonon-electron scattering is responsible for this term. Phonon-electron scattering may also be excluded by inspecting the relevant scattering rate which can be written as [14]
| (15) |
with as the deformation potential. The fit values for given in Table I result in Fermi-energies of the order of 1-2 eV, i.e., values which exceed evaluated in section III A by two orders of magnitude. For phonon scattering at dislocations we have [23]
| (16) |
with as the dislocation density, the Grüneisen parameter, and b the Burger vector. By using the lattice constant for Åand , we obtain , a plausible result.
The enhanced presence of scattering centers at the vacancy sites in Ca1-δB6 is unequivocally reflected in the third term of Eq. 14. Rayleigh scattering by point-like mass defects leads, in the continuum approximation, to a scattering rate term , with [14]
| (17) |
In Eq. 17, is the number density of point defects in Ca1-δB6, Åis its lattice constant, is the mass of a unit cell, and is the supplementary or missing mass due to a point defect in a sphere with the radius of the point defect itself. Since the extra mass term appears squared in Eq. 17, it is not possible to decide whether is positive or negative. By assuming that each point defect in Ca1-δB6 provides one free electron to the ensemble of conduction electrons and that for stoichiometric CaB6 , we have , i.e., the same value as the electron density calculated in section III A. Again, by using for the value which we obtained from the fitting procedure, we note that is of order unity. In view of the rather crude approximations, this result is encouraging, as it seems to indicate that the concentration of itinerant electrons in CaB6 is equivalent to the concentration of impurities (or vacancies) with approximately the same mass as the mass of the unit cells. The scattering rate term is only of significance for fitting the data of the vacancy-doped Ca1-δB6 sample. Our attempts to evaluate the free parameter for CaB6 resulted in a vanishing contribution of to the total scattering rate of the stoichiometric hexaboride. Considering the estimated error range of a few times sec3 for , this is at least consistent with a reduced amount of defects in CaB6.
The last term appearing in Eq. 14 needs a detailed examination. Resonant scattering of phonons has already been invoked in the analysis of the thermal conductivity data of EuB6 in a previous investigation. [22] The appearance of in the scattering rate of EuB6 was intepreted as being due to a resonant scattering of low-momentum vibrational states in the dispersionless part of the branches with acoustic phonons of constant energy that seem to occupy an extended region of the Brillouin zone at higher momenta. Indeed, a rapid flattening of the LA branches at an energy of approximately 12 meV has been observed in inelastic neutron scattering experiments performed on the trivalent hexaborides XB6 (X = Ce, La, Sm). [24, 25, 26] Because of similar atypical temperature dependencies of above 50 K, we follow the arguments given in Ref. [22] and introduce a resonant scattering term of the form
| (18) |
with
| (19) |
as the bosonic population factor. In our intepretation of the data, the crossing of the thermal conductivity curves at K has to be traced back to a much stronger resonant scattering rate in CaB6. As may be seen in Table I, the fit value is more than one order of magnitude larger for CaB6 than for Ca1-δB6.
Although, by taking into account the resonant-scattering term, we achieve a fairly accurate description of our thermal conductivity data, it seems rather unlikely that the large difference in the temperature dependence of may be accounted for by considering phonon-phonon scattering processes alone, especially if we consider the only small difference in chemical composition between the two materials.
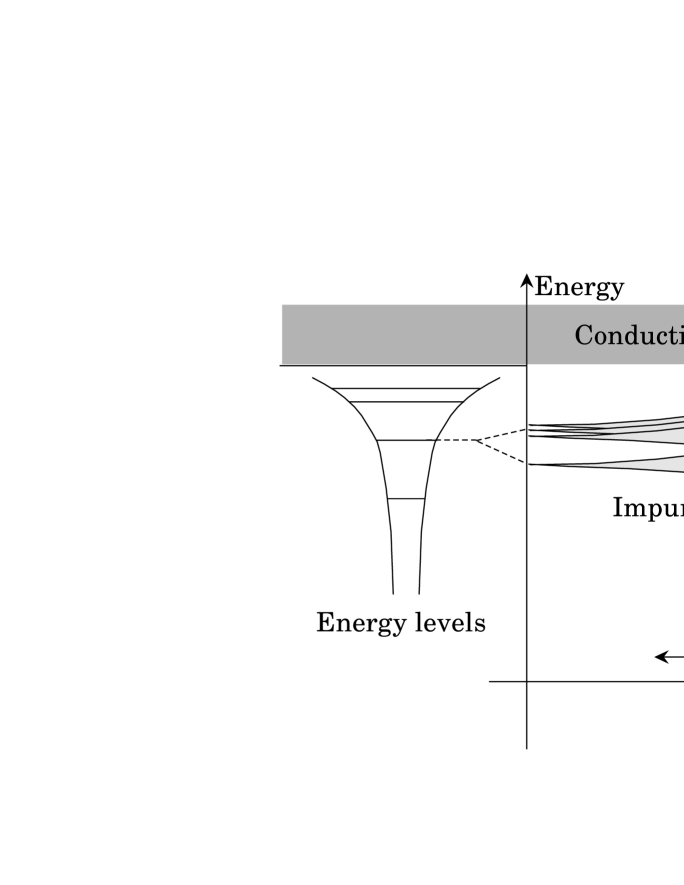
In order to find a more plausible explanation for the experimentally observed crossing of , we note that a strong reduction of the lattice thermal conductivity of semiconductors induced by defect donor states has been reported in a large number of publications. [27, 28, 29] The intensity of the phonon scattering processes invoking such states depends strongly on the electronic excitation spectra induced by these defects. In particular, donor states in cubic semiconductors, leading to the existence of localized singlet-triplet centers just below the conduction band, are also expected to provide the source for a strong resonant phonon scattering. [29] Physical realizations of such systems have been found in the valley-orbit-split ground state of the donors As, Sb, P, and Li in Ge. The singlet-triplet valley-orbit splitting of the fourfold degenerate ground state of As in Ge, for example, is 4.23 meV, a value which is of the same order of magnitude as the resonant energies of 10.85 and 9.38 meV, quoted in Table I for CaB6 and Ca1-δB6, respectively. If the density of defects in the crystal is such that the average distance between the donor states is of the order of the extension of the defect wave function, characterized by a Bohr radius of typically 40 Å, we expect a broadening of the degenerate energy-eigenvalues, finally resulting in the formation of a band of defect states. The typical extension of the defect wave function should be compared with the expected mean distance between the electrons in CaB6, estimated by calculating the third root of the inverse of the electron density derived in section III A. This leads to values of 70 Å and 100 Å for Ca1-δB6 and CaB6, respectively. If the electron densities at 0 K derived in section III A are due to the existence of donor states in CaB6, we are thus close to concentrations for which a band is expected to form. A schematic representation of this is shown in Fig. 8. Because of the statistical distribution of distances between donor states, it seems possible to realize a situation where both, localized donor states and defect-band itinerant states, coexist. Since stoichiometric CaB6 is closer to perfection than the vacancy-doped sample, the observation of a stronger high-frequency scattering mechanism in CaB6, as mentioned above, might appear as rather surprising. However, as we noted above, an increasing distance between the defects due to a lower concentration of defects would narrow the tight-binding bands in CaB6, eventually resulting in a larger fraction of localized donor states acting as resonant scattering centers for the phonons. Hence, if this scheme is valid, the higher resonant scattering rate in CaB6 makes sense.
All our attempts to cast the scattering of phonons at localized donor states into a reasonable equation for its relaxation rate and to obtain a fair description of the high temperature features of for CaB6 failed. This failure may either be due to a breakdown of the Debye model at higher frequencies, or may indicate that localized donor states in CaB6 do not scatter phonons. With respect to the first possibility it may well be that using the Debye model at the frequencies around the resonance is not justified. A strong resonant scattering mechanism may, in some cases (see, for example, Ref. [30]), modify the unperturbed dispersion relations by opening a gap in the phonon spectrum at the resonant frequency, thus turning the Debye scheme into a very poor approximation at the frequencies around the resonance. This may also be the reason for the poor quality of the fit to the CaB6 data, for which the resonant-scattering is quite significant. Since the dispersion relations of the lattice vibrational modes in CaB6 have not been measured yet, we cannot offer a more detailed discussion. In case of deviations of the acoustic branches of CaB6 from a non-dispersive dependence at the frequencies which are relevant for our investigation, the functional form of would certainly change.
Concluding this section, we recall that our thermal conductivity data show a strong and somewhat unexpected dependence on calcium vacancy-doping at elevated temperatures, which we interpret as being due to a resonant scattering of the vibrational modes. For a more realistic computation of the thermal transport properties at the high end of the temperature regime covered in our investigation, more information concerning the phonon dispersion relations of CaB6 is necessary, however.
IV Summary and conclusion
We have measured the thermoelectric power and the thermal conductivity of close to stoichiometric and vacancy-doped CaB6 between 5 and 300 K. The high negative values of the thermoelectric power of both materials indicate a low concentration of itinerant -type charge-carriers. We have achieved a reasonable interpretation of by using a relaxation-time approximation of Boltzmann’s equation, by considering a sizeable gap between valence and conduction band states, and by postulating the existence of an additional term in the conductivity spectrum which may be related to the existence of a defect band in proximity to the lower conduction band edge. A Debye-type relaxation-time approximation is successful in describing the thermal conductivity data across the entire temperature range covered in the experiments. The usual terms contributing to the total scattering rate of the vibrational states agree well with our expectations. A rather unusual temperature dependence of is observed above approximately 30 K. A resonant type of scattering seems to influence the mean free path of the phonons at these temperatures. Quite surprisingly, its limiting effect on the time period between two vibrational-mode collisions is much stronger in the material closer to stoichiometry. Although postulating a resonant-type of phonon-phonon scattering leads to a satisfactory description of our experimental observation, an alternative possible interpretation which considers the existence of localized donor states is suggested. Since the lattice dispersion relations of CaB6 have not yet been investigated experimentally, we cannot offer any rigorous statements about the physical nature of this resonant type of scattering of the vibrational modes.
V Acknowledgements
We thank R. Monnier and M. E. Zhitomirsky for stimulating discussions. This work was financially supported by the Schweizerische Nationalfonds zur Förderung der Wissenschaftlichen Forschung.
REFERENCES
- [1] D. P. Young, D. Hall, M. E. Torelli, Z. Fisk, J. L. Sarrao, J. D. Thomson, H. R. Ott, S. B. Oseroff, R. G. Goodrich, and R. Zysler, Nature 397, 412 (1999).
- [2] P. Vonlanthen, E. Felder, L. Degiorgi, H. R. Ott, D. P. Young, A. D. Bianchi, and Z. Fisk, Phys. Rev. B 62, 10076 (2000).
- [3] H. R. Ott, M. Chernikov, E. Felder, L. Degiorgi, E. G. Moshopoulou, J. L. Sarrao, and Z. Fisk, Z. Phys. B 102, 337 (1997).
- [4] S. Massidda, A. Continenza, T. M. de Pascale, and R. Monnier, Z. Phys. B 102, 83 (1997).
- [5] M. E. Zhitomirsky, T. M. Rice, and V. I. Anisimov, Nature 402, 251 (1999).
- [6] L. Balents and C. M. Varma, Phys. Rev. Lett. 84, 1264 (2000).
- [7] V. Barzykin and L. P. Gor’kov, Phys. Rev. Lett 84, 2207 (2000).
- [8] H. J. Tromp, P. van Gelderen, P. J. Kelly, G. Brocks, and P. A. Bobbert, cond-mat/0011109 (2000).
- [9] K. E. Spear, Boron and refractory borides (Springer, Berlin, 1977), p. 442.
- [10] Z. Fisk and J. P.Remeika, in Growth of Single Crystals from Molten Metal Fluxes, Vol. 12 of Handbook on the Physics and Chemistry of Rare Earths, edited by K. A. Gschneider and L. Eyring (Elsevier Science, New York, 1989), pp. 53–71.
- [11] H. Bougrine and M. Ausloos, Rev. Sci. Instrum. 66, 199 (1995).
- [12] R. D. Barnard, Thermoelectricity in Metals and Alloys (Taylor & Francis Ltd, London, 1972).
- [13] F. J. Blatt and P. A. Schroeder, Thermoelectricity in Metallic Conductors (Plenum Press, New York, 1978), p. 7.
- [14] J. M. Ziman, Electrons and Phonons (Oxford Industry Press, London, 1960), pp. 310–433.
- [15] B. R. Nag, Theory of electrical transport in semiconductors (Pergamon Press, Oxford, 1972), pp. 105–115.
- [16] J. E. Enderby and A. C. Barnes, Phys. Rev. B 49, 5062 (1994).
- [17] C. Wälti, Private communication.
- [18] H. J. Goldsmid, Proc. Phys. Soc. B 69, 203 (1956).
- [19] S. Paschen, D. Pushin, M. Schlatter, P. Vonlanthen, H. R. Ott, D. P. Young, and Z. Fisk, Phys. Rev. B 61, 4174 (2000).
- [20] P. Vonlanthen, Private communication.
- [21] H. B. G. Casimir, Physica 5, 495 (1938).
- [22] P. Vonlanthen, S. Paschen, D. Pushin, A. D. Bianchi, H. R. Ott, J. L. Sarrao, and Z. Fisk, Phys. Rev. B 62, 3246 (2000).
- [23] P. G. Klemens, in Solid State Physics: Advances in Research and Applications, edited by F. Seitz and D. Turnbull (Academic, New York, 1958), Vol. 7.
- [24] S. Kunii, J. M. Effantin, and J. Rossat-Mingnod, J. Phys. Soc. Jpn. 66, 1029 (1997).
- [25] H. G. Smith, G. Dolling, S. Kunii, M. Kasaya, B. Liu, K. Takegahara, T. Kasuya, and T. Goto, Solid State Commun. 53, 15 (1985).
- [26] P. A. Alekseev, A. S. Ivanov, B. Dorner, H. Schober, K. A. Kikoin, A. S. Mishchenko, V. N. Lazukov, E. S. Konovalova, Y. B. Paderno, A. Y. Rumyantsev, and I. P. Sadikov, Europhys. Lett. 10, 457 (1989).
- [27] B. L. Bird and N. Pearlman, Phys. Rev. B 4, 4406 (1971).
- [28] A. Adolf, D. Fortier, J. H. Albany, and K. Suzuki, Phys. Rev. Lett. 41, 1477 (1978).
- [29] A. Puhl, E. Sigmund, and J. Maier, Phys. Rev. B 32, 8234 (1985).
- [30] V. Roundy and D. L. Mills, Phys. Rev. B 1, 3703 (1970).
- [31] A. Bianchi, Private communication.
| Fit parameter | Units | CaB6 | Ca1-δB6 |
|---|---|---|---|
| m | |||
| 10-6 | |||
| 10-44 sec3 | - | ||
| 1010 sec-1 | |||
| meV |