Electronic structure of MgB2: x-ray emission and absorption studies
Abstract
Measurements of x-ray emission and absorption spectra of the constituents of MgB2 are presented. The results obtained are in good agreement with calculated x-ray spectra, with dipole matrix elements taken into account. The comparison of x-ray emission spectra of graphite, AlB2, and MgB2 in the binding energy scale supports the idea of charge transfer from to bands, which creates holes at the top of the bonding bands and drives the high-Tc superconductivity in MgB2.
pacs:
74.70.Ad, 78.70.Dm, 78.70.En, 74.25.JbI Introduction
The recent discovery of superconductivity in MgB2 with a close to 40 K [1] was an unexpected experimental achievement. Up to now, it is the highest Tc value reported for any binary compound [2]. This value of is much higher than previously expected within the context of BCS theory [3]. Not surprisingly, its discovery has given rise to much experimental and theoretical activity, having raised the possibility of a whole new class of superconductors.
The experimentally observed B isotope shift of Tc [4] and other experimental data [5] suggest conventional BCS -wave electron-phonon coupling. However, careful analysis of the temperature and magnetic field dependence of the specific heat [6] suggests anisotropic or multiple gaps. The reported values of from tunneling measurements [7] also raise the possibility of multiple gaps, although the values below the BCS weak coupling limit of 3.5 have been attributed to surface effects. Even though there is growing evidence for conventional BCS -wave electron-phonon coupling, the experimental picture is not yet entirely clear. In addition to theoretical explanations based on BCS theory, [8, 9, 10] an alternative explanation based on hole superconductivity has been proposed.[11] Both theories are based on the results of band structure calculations of MgB2.
X-ray emission and absorption spectroscopies are powerful probes of the electronic structure of solids. Photon emission and absorption involve a transistion between electronic states. In the soft x-ray regime, one of the states is a localized, dispersionless core level. This allows for the interpretion of the measured spectra in terms of unoccupied states for absorption and occupied states for emission. Since dipole selection rules govern the transitions to or from the core level, it is actually the angular-momentum-resolved density of states (DOS) that is measured. Furthermore, since the core level is associated with a specific element in the compound, x-ray absorption and emission are also element specific. Finally, they have the advantage of being relatively insensitive to the quality of the sample surface, unlike x-ray photoelectron spectroscopy (XPS) or ultraviolet photoemission, where in order to measure the bulk electronic structure it is necessary to prepare atomically clean, stoichiometric, and ordered surfaces, which are impossible to realize for sintered samples such as MgB2.
Recently, a high-resolution photoemission study of a sintered powder sample of MgB2 was carried out [12], however the behavior of the spectral function was analyzed only in the vicinity of the Fermi level. In the present paper, the x-ray emission and absorption spectra (XES and XAS) of the constituents have been studied in MgB2 and related compounds (graphite and AlB2). The results obtained are compared with the partial density of states and first-principles calculations of the intensities of x-ray spectra which take dipole matrix elements and selection rules into account.
II Experimental Details
Both pressed powder and sintered polycrystalline MgB2 samples were used for measurements of the XES. The sintered polycrystalline sample was prepared as described in Ref. [1]. X-ray diffraction measurements show that the sample is single-phased and electrical resistivity and DC magnetization measurements confirm the onset of a sharp superconducting transition at 39.5 K. The B K-emission and absorption spectra were studied on Beamline 8.0.1 at the Advanced Light Source (ALS) at Lawrence Berkeley National Laboratory employing the soft X-ray fluorescence endstation.[13] Emitted radiation was measured using a Rowland circle type spectrometer with spherical gratings and a multichannel two-dimensional detector. The measurements of the Mg L-emission spectra were performed using an ultrasoft x-ray grating spectrometer (R=1 m, n=600 l/mm) with electron excitation.[14] The B K and Mg L2,3 XES were measured with excitation energies far from the B and Mg thresholds (non-resonant spectra), with an energy resolution of 0.3 eV.
The Mg 2 absorption spectra were also measured at the beamline BL-12A at the Photon Factory in KEK using photons from a synchrotron source. The energy resolution near the Mg 2 threshold (50 eV) is 0.5 eV, using a 0.1 mm monochromator slit-width. For Mg 2 measurements, we used a Si filter despite the Si 2 absorption threshold at about 100 eV because at this beamline non-negligible 2nd order light is included in this energy region The absorption spectra were taken by recording the total electron yield (TEY) sample drain current. To remove surface contamination before the measurements, the sample was scraped with sandpaper and then striped off with vinyl tape repeatedly until the mark left on the tape was uniform. The vacuum was below torr and the measurements were carried out at room temperature.
In order to determine the position of the Fermi level and convert x-ray spectra to the binding energy scale of XPS (difference of measured XES energies and a selected XPS core level energy), B 1 and Mg 2 core levels were measured. As mentioned above, XPS for valence band states is very sensitive to surface contamination, nevertheless the binding energies of core levels can be determined after cleaning the surface. The XPS measurements have been carried out with an ESCA spectrometer manufactured by Physical Electronics (PHI 5600 ci). The monochromatized Al K radiation had an FWHM of 0.3 eV and combined with the energy resolution of the analyzer (1.5% of the pass energy) results in an estimated energy resolution of somewhat less than 0.35 eV. XPS measurements of a MgB2 sample fractured in high vacuum have shown less oxygen content on the surface than those of sintered material. Further reduction of the oxygen content was achieved by ion etching. After cleaning the surface, we obtained the following values for the binding energies associated with the core levels: B (185.5 eV) and Mg (49.5 eV). These results agree well with recent XPS studies of MgB2 (the Mg core level energy agrees within 0.2 eV) [15] which shows that the XPS core levels are not significantly influenced by oxidized surfaces, as shown in this study by comparing as-grown and etched surfaces in which the oxidized layer is effectively removed. This supports the use of these values in Fig. 3 to convert XES spectra to the binding energy scale.
III Results and Discussion
The states at the Fermi level derive primarily from B and so the resulting band structure can be understood in terms of the boron sublattice. Mg can be described as ionized (Mg2+) in this compound. However, the electrons donated to the system are not localized on the anions, but rather are distributed over the whole crystal. The () bonding states which have B pxy character are unfilled, in contrast to graphite where the states are completely filled and form strong covalent bonds. These states form two small cylindrical Fermi surfaces around the –A line and the holes at the top of the bonding bands are believed to couple strongly to optical B–B modes and to play a key role in the superconductivity of MgB2.
Using the full potential LAPW code WIEN97, [16] we calculated the near edge absorption and emission spectra. According to the final-state rule formulated by von Barth and Grossmann, [17] accurate XES and XAS of simple metals may be obtained from ordinary one-electron theory if the relevant dipole matrix elements are calculated from valence functions obtained in the potential of the final state of the x-ray process: in other words, a potential reflecting the fully screened core hole for absorption but not for emission. Because we neglected core relaxation effects in our calculations, we expect significantly better agreement between theory and experiment for emission spectra. The calculated spectra are Lorentz broadened with a spectrometer broadening of 0.35 eV, with additional lifetime broadening for emission spectra.
Theoretical B K emission and absorption spectra of MgB2, which according to dipole selection rules ( transition) probe B 2 occupied and unoccupied states, respectively, are presented in Fig. 1 (a, c). These calculations show that the intensity distributions of B K emission and absorption follow the B 2 partial density of states very closely because the radial dipole matrix elements are monotonically increasing functions of energy within the valence and conduction bands. The experimental B K emission and absorption spectra (Fig. 1 (b, d)) are in good agreement with the calculated spectra. Note that the position of the Fermi level of XAS cannot be determined with the help of XPS measurements of core levels due to the different final states. The experimental and calculated XAS spectra shown in Figs. 1–2 are compared by aligning the Fermi levels. Our results are also in good agreement with other recent experimental studies.[18, 19] Callcott et al. [18] have reported soft x-ray fluorescence measurements and also XAS for the -edge of B in MgB2. Comparing their results to our TEY (Fig. 1d) we find similar structures around 187 eV and 193 eV as observed in Ref. [18]. Similar results were also obtained by Nakamura et al. [19]. We do not find the peak labeled C in Ref. [18] around 195 eV, which was associated with boron oxide. We also obtained good agreement comparing our XES results with other B K-emission experimental data.[18, 19]
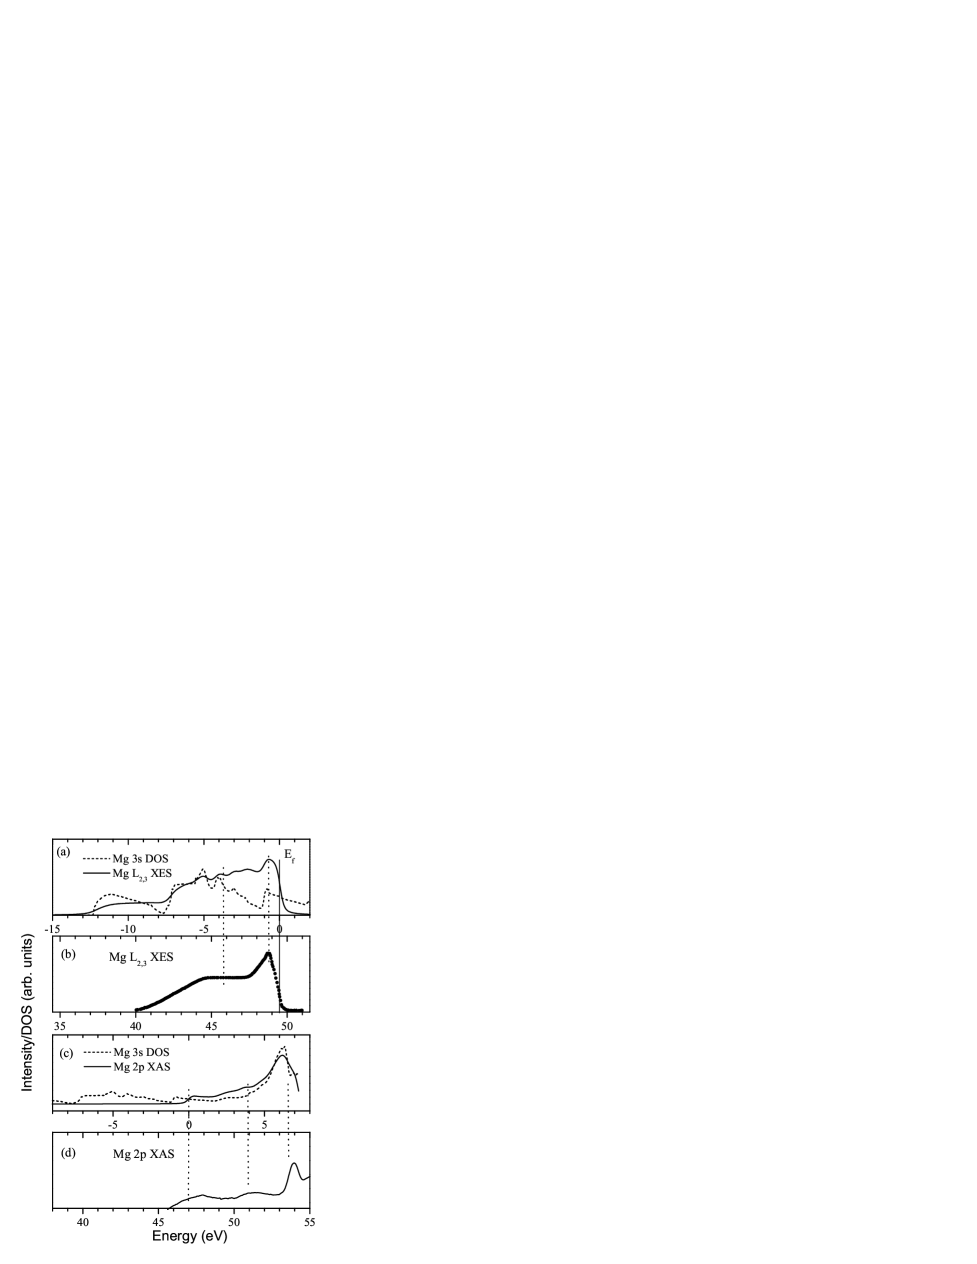
Calculated Mg L emission and absorption spectra which probe occupied and unoccupied Mg 3 states are shown in Fig. 2 (a, c). The intensity distribution associated with the Mg L emission differs somewhat from the Mg 3 partial DOS. The DOS is significantly changed by the dipole matrix elements which are necessary in order to recover the experimental XES shape. The contribution to the x-ray intensity is larger for states near the Fermi level relative to those at the bottom of the valence band, in accordance with the energy dependence of the radial dipole matrix elements. Again, we note reasonable agreement between the calculated (Fig. 2 (a, c)) and experimental spectra (Fig. 2 (b, d)).
All density-functional calculations appear to agree that Mg is substantially ionized [8, 9, 10]. In order to provide direct experimental evidence for charge transfer from Mg, we compared the Mg L emission spectrum in MgB2 to that in pure Mg metal. The shift of the Mg core -level with respect to the Fermi level contains this information and will be called chemical shift. This does not involve counting of electrons in order to obtain the chemical potential, which would depend critically on the shape of the bands. Normally, one would expect a core level shift towards higher binding energies (positive shift) in losing valence charge because less electrons screen the Coulomb potential weaker and therefore the electrons are bound stronger.
Band structure calculations reveal, the Mg level shows significant hybridization with the B level, which raises the former while lowering the latter, in difference to the simple picture outlined above. The mechanism is similar to an interacting two-level system, where new states are formed, one level is lowered in energy and the other level is pushed up in energy proportional to the overlap (hybridization) between the states.
A negative chemical shift of about 0.5 eV is found in the MgB2 spectrum with respect to that of pure Mg, which we hold as evidence for charge transfer from Mg to B atoms in this compound. The same negative chemical shift of 0.5 eV has been observed recently in XPS measurements [15] as well.
This is a very important effect because it lowers the () bands relative to the bonding () bands. This lowering of the B bands relative to the bands, compared to graphite, causes charge transfer and -band hole doping, driving the superconductivity in MgB2 [9]. To investigate this prediction further, we compared the K XES ( transition) for graphite, AlB2, and MgB2 by alignment of the Fermi levels which were determined in the binding energy scale using XPS measurements of core levels: B (MgB2)=185.5 eV, B (AlB2)=188.5 eV, [20] and C (graphite)=284.5 eV [20] (Fig. 3). As the figure shows, the major maximum originating from states is shifted in MgB2 towards the Fermi level with respect to that of graphite. AlB2 occupies an intermediate position due to the higher electron concentration compared to MgB2 which results in filling of the bands, decreasing and finally destroying superconductivity.
IV Conclusion
In conclusion, we have measured x-ray emission and absorption spectra of the constituents of the new superconductor MgB2 and found good agreement with results of band structure calculations and in particular calculations of intensities of x-ray spectra taking the necessary matrix elements into account. Further, according to our findings magnesium is positively charged in this compound, which supports the results of electronic structure calculations. The comparison of x-ray emission spectra of graphite, AlB2, and MgB2 supports the idea of superconductivity driven by hole doping of the covalent bands. While the experimental results of our study cannot give direct insight into the mechanism of the superconductivity, they do support and lend credence to the standard band structure methods used in the theoretical analysis of this new and exciting material. This information could prove important in understanding and answering the questions which still exist.
Acknowledgements.
We thank I. I. Mazin and O. Gunnarson for helpful discussions and comments and J. E. Pask for a critical reading of the manuscript. The Russian State Program on Superconductivity, Russian Foundation for Basic Research (Project 00-15-96575) and NATO Collaborative Linkage Grant supported this work. JK would like to thank the Schloeßmann Foundation for financial support. Funding by the President’s NSERC fund of the University of Saskatchewan is gratefully acknowledged.REFERENCES
- [1] J. Nagamatsu, N. Nakagawa, T. Muronaka, Y. Zenitani, and J. Akimitsu, Nature (London) 410, 63 (2001).
- [2] S.V. Vonsovsky, Yu.A. Izyumov and E.Z. Kurmaev, Superconductivity of Transitional Metals, Their Alloys and Compounds, Springer, Berlin 1982.
- [3] W.L. McMillan, Phys. Rev. 167, 331 (1968).
- [4] S.L. Bud’ko, G. Lapertot, C. Petrovic, C.E. Cunningham, N. Anderson, P.C. Canfield, Phys. Rev. Lett. 86, 1877 (2001).
- [5] D. K. Finnemore, J. E. Ostenson, S. L. Bud’ko, G. Lapertot and P. C. Canfield, Phys. Rev. Lett. 86, 2420 (2001); B. Lorenz, R. L. Meng, C. W. Chu,, Phys. Rev. B 64, 012507 (2001); P. C. Canfield, D. K. Finnemore, S. L. Bud’ko, J. E. Ostenson, G. Lapertot, C. E. Cunningham and C. Petrovic, Phys. Rev. Lett. 86, 2423 (2001).
- [6] R.K. Kremer, B.J. Gibson and K. Ahn, cond-mat/0102432; Y. Wang, T. Plackowski and A. Junod, Physica C 355, 179 (2001); F. Bouquet, R. A. Fisher, N. E. Phillips, D. G. Hinks and J. D. Jorgensen, Phys. Rev. Lett. 87, 047001 (2001).
- [7] G. Karapetrov, M. Iavarone, W. K. Kwok, G. W. Crabtree, and D. G. Hinks, Phys. Rev. Lett. 86, 4374 (2001); G. Rubio-Bollinger, H. Suderow, and S. Vieira, Phys. Rev. Lett 86, 5582 (2001); H. Schmidt, J. F¿ Zasadzinski, K. E. Gray, and D. G. Hinks, Phys. Rev. B 63, 220504 (R) (2001); A. Sharoni, I. Felner, and O. Millo, Phys. Rev. B 63, 220508 (R) (2001).
- [8] J. Kortus, I.I. Mazin, K.D. Belashenko, V.P. Antropov, L.L. Boyer, Phys. Rev. Lett. 86, 4656 (2001); A. Y. Liu, I.I. Mazin and J. Kortus, Phys. Rev. Lett. 87, 087005 (2001).
- [9] J.M. An and W.E. Pickett, Phys. Rev. Lett. 86, 4366 (2001).
- [10] Y. Kong, O.V. Dolgov, O. Jepsen, and O.K. Andersen, Phys. Rev. B 64, 020501 (R) (2001).
- [11] J.E. Hirsch, Phys. Lett. A282, 392 (2001).
- [12] T. Takahashi, T. Sato, S. Souma, T. Muranaka, and J. Akimitsu, Phys. Rev. Lett. 86, 4915 (2001).
- [13] J. .J. Jia, T. A. Callcott, J. Yurkas, A. W. Ellis, F. J. Himpsel, M. G. Samant, J. Stöhr, D. L. Ederer, J. A. Carlisle, E. A. Hudson, L. J. Terminello, D. K. Shuh, and R. C. C. Perera, Rev. Sci. Instrum. 66, 1394 (1995).
- [14] A.P. Lukirsky, Izvestia AN USSR, ser. fiz., 25 913 (1961).
- [15] R. P. Vasquez, C. U. Jung, M.-S. Park, H.-J. Kim, J. Y. Kim, and S.-I. Lee, Phys. Rev. B 64, 052510 (2001).
- [16] P. Blaha, K. Schwarz, and J. Luitz, WIEN97, A FLAPW package for calculating crystal properties (Vienna Austria, ISBN 3-9501031-0-4) 1999.
- [17] U. von Barth and G. Grossmann, Solid State Commun. 32, 645 (1979); U. von Barth and G. Grossmann, Phys. Rev. B 25, 5150 (1982).
- [18] T. A. Callcott, L. Lin, G. T. Woods, G. P. Zhang, J. R. Thompson, M. Paranthaman, and D. L. Ederer, Phys. Rev. B 64, 132504 (2001).
- [19] J. Nakamura, N. Yamada, K. Kuroki, T. A. Callcott, D. L. Ederer, J. D. Denlinger, R. C. C. Perera, Phys. Rev. B 64, 174504 (2001).
- [20] J.F. Moulder, W.F. Stickle, P.E. Sobol, and K.D. Bomben, Handbook of x-ray Photoelectron Spectroscopy, Perkin-Elmer Corp., Eden Praire, MN, 1992.