Extremely Small Energy Gap in the Quasi-One-Dimensional
Conducting Chain Compound SrNbO3.41
Abstract
Resistivity, optical, and angle-resolved photoemission experiments reveal unusual one-dimensional electronic properties of highly anisotropic SrNbO3.41. Along the conducting chain direction we find an extremely small energy gap of only a few meV at the Fermi level. A discussion in terms of typical 1D instabilities (Peierls, Mott-Hubbard) shows that neither seems to provide a satisfactory explanation for the unique properties of SrNbO3.41.
pacs:
PACS numbers: 71.10.Pm, 71.20.Ps, 79.60.-i, 78.20.-eA one-dimensional (1D) interacting electron system no longer exhibits the quasiparticles known from Fermi liquid theory and is instead a Tomonaga-Luttinger liquid (TLL) whose properties also include spin-charge separation and a power-law behavior of correlation functions [2]. This 1D theory does not, however, directly apply to real 1D materials since some coupling between the 1D entities (such as chains or similar) is always present, rendering the systems quasi-1D and facilitating 2D and 3D ordering effects. Real 1D materials are thus conducive to various instabilities masking the predicted TLL characteristics [3]. Electron-phonon coupling, for instance, can lead to a gapped charge-density wave (CDW) ground state (Peierls transition), and electron-electron interaction may cause the opening of a Mott-Hubbard (MH) gap at commensurate band filling.
Recently, a new quasi-1D material was synthesized [4] which belongs to the series SrNbO3.5-x of perovskite-related transition-metal oxides, with characteristics spanning a wide range: Depending on the oxygen stoichiometry, these niobium oxides exhibit quasi-1D metallic character (0.1) [5] or ferroelectricity (=0) with very high transition temperature [6]. In this Letter we focus on the unusual electronic properties of the quasi-1D metallic compound SrNbO3.41 which were determined by dc resistivity, optical spectroscopy, and angle-resolved photoemission (ARPES). Along the conducting chain direction, an extremely small energy gap of only a few meV, much smaller than for other quasi-1D compounds, is observed at the Fermi level. The gap is discussed in terms of a Peierls and a MH scenario.
SrNbO3.41 single crystals of typical size 320.2 mm3 were grown [4, 7] by the floating zone melting technique. The precise oxygen content was determined thermogravimetrically. The analysis of the room temperature (RT) x-ray powder diffraction pattern indicates single-phase composition with lattice constants Å, Å, and Å, in good agreement with earlier work [8]. The basic structural building blocks are NbO6 octahedra [see Fig. 1(a)] grouped into slabs which extend parallel to the () plane and for SrNbO3.4 are five octahedra wide along . Only along the axis the octahedra are connected continuously via their apical oxygen atoms, forming 1D chains.
The dc resistivity of SrNbO3.41 along the three axes was measured using a four-point configuration [7]. Polarized reflection measurements along the and axis were performed for frequencies 6-34 000 cm-1 by utilizing various spectrometers; for details see Ref. [9]. To accomplish the Kramers-Kronig analysis, we used a Hagen-Rubens extrapolation for 0 and a power law () at high frequencies. High-resolution (=15 meV) ARPES data were recorded with a Scienta ESCA-300 analyzer using the He I line of a discharge lamp. The samples were cleaved at RT and a base pressure of 1 10-10 mbar to expose an (001) surface, and cooled down to 25 K. By Laue diffraction the crystals were oriented to 1∘. The angular resolution was set to 0.5∘, and the Fermi level was determined to 1 meV accuracy from the Fermi cutoff of a freshly evaporated Au film recorded immediately afterwards at the same experimental conditions.
Fig. 1(b) shows the dc resistivity versus temperature of SrNbO3.41 along the three axes. It is highly anisotropic with very low, metal-like values along the direction ((300K)=4.610-4 cm) and a RT anisotropy of ::=1:102:104. The variation of with temperature is smaller within the () plane than along . In all directions a broad maximum or shoulder is seen between 200 and 50 K, and below 50 K we find an increase of , which in the range 20-40 K can be described by an activated behavior with activation energies =2-3 meV. In the range 60-130 K (along the chains) has a metallic dependence, whereas above 130 K it slightly decreases with increasing temperature
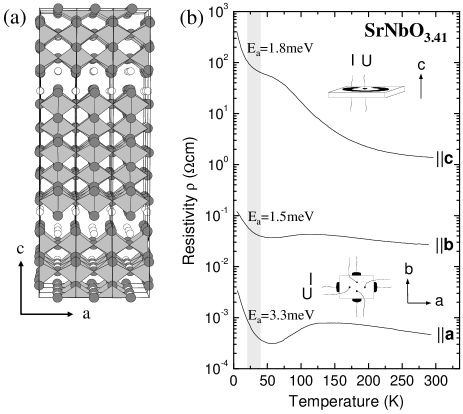
(thermally activated hopping between metallic strands may explain this). A similar temperature dependence is observed for , however, not as clearly developed. There are no signs of metallic behavior along .
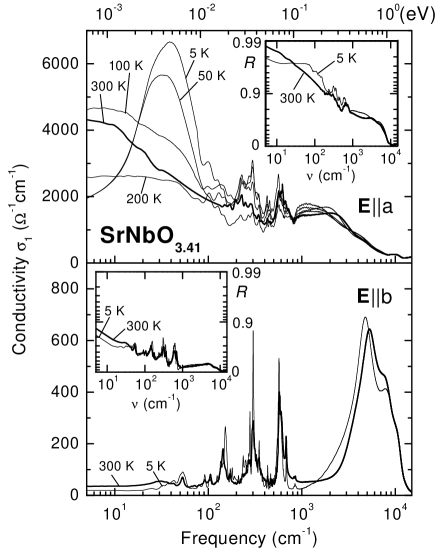
The anisotropy in the electrical properties of SrNbO3.41 is also clearly seen in the optical response (Fig. 2). The reflectivity displayed in the insets of Fig. 2 shows a sharp plasma edge for the polarization E with high values (1) at low frequencies, indicating metallic conductivity. In contrast, for E the material is insulating and we mainly see phonon contributions between 40 and 1000 cm-1 showing significant changes with temperature which will be discussed elsewhere [9]. For both polarization directions the low frequency (0) conductivity agrees, in general, well with the measured dc data (Fig. 1), reproducing its rather complicated temperature behavior. At RT the E conductivity contains a Drude-like contribution at low frequencies followed by several phonon lines between 100 and 1000 cm-1 and a broad mid-infrared band around 1500 cm-1. Upon reducing the temperature, exhibits substantial changes at frequencies lower than 100 cm-1, leading to the appearance of a peak around 40 cm-1, which is already quite strong at 50 K. At 5K, this peak has shifted slightly to higher frequencies and has grown even stronger. We ascribe this feature to single-particle excitations across an energy gap in the electronic density of states with 2(5 K)5 meV.
The momentum resolved electronic properties probed by ARPES reveal a quasi-1D band structure for Sr0.9La0.1NbO3.39 [5] as well as for SrNbO3.41 [9]: A dispersing band is found only along one high-symmetry line, -, parallel to the chain direction , and seems to cross ; a second band near does not show discernible dispersion. Neither band disperses along the transverse direction -. The Fermi surface (FS) is 1D [5], with nesting vector 2 of about 1/3 of the Brillouin zone.
Further insight is gained by band structure calculations in the local density approximation [5, 10] which demonstrate that among the three inequivalent Nb sites per slab a predominant [10] contribution to the density of occupied states at comes from the central Nb site; the contributions of the other two Nb sites rapidly fall off with distance away from the center. Distortion is small only for the NbO6 octahedra based on the central Nb sites, and one can thus clearly relate the quasi-1D character of the dispersing band to these chains of almost “perfect” octahedra in the middle of the slabs. The importance of the central chains is also demonstrated by comparing ARPES results for SrNbO3.41 with those for Sr0.8La0.2NbO3.50 [9], where the central chains are missing since there the slabs are only four octahedra wide: for the latter the 1D character of the band structure has almost vanished.
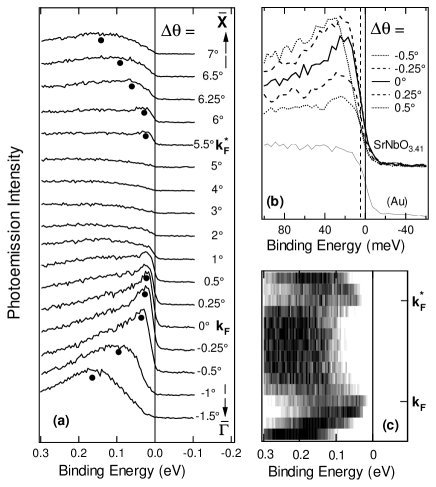
The quasi-1D FS with almost complete nesting makes SrNbO3.41 prone to instabilities opening a gap at , and we thus concentrate on the region around in order to very sensitively detect such signatures. Fig. 3 (a) shows the corresponding high-resolution ARPES spectra along - near . At the peak associated with the strongly dispersing band is located at 160 meV binding energy and is rather broad, but sharpens up as it approaches and appears to cross it. We define (0∘) as the emission direction for which the leading edge midpoint of the spectrum is closest to . Due to a 21 superstructure [5] the peak reappears already at =5.5∘ and disperses towards higher binding energies for increasing . Fig. 3 (b) depicts the ARPES spectra around for a narrow angular step size of 0.25∘ together with the Fermi cutoff of a Au film. Starting from and going to higher , the leading edge midpoint approaches but does not reach it for any of the spectra. At , the spectral weight at the Fermi level is significantly suppressed (by 40%) compared to the leading edge midpoint, and we find a gap between the leading edge midpoint and of (25 K)4 meV. Although this “leading edge” method is known to underestimate the gap size somewhat for a peak-like structure a fit (not shown) of the spectrum, similar to Ref. [11] and accounting for the peak structure, gives only a slightly larger result, (25 K)(52) meV, corroborating the leading edge result. Possible extrinsic effects such as charging or too coarse an angular step size can also be excluded as a source of the gap [12]. The gap is thus clearly established and with a size of about 5 meV is, in fact, the smallest one found in ARPES for any quasi-1D compound.
The intensity plot of high-resolution ARPES spectra in 0.5∘ steps and normalized for clarity to constant total intensity is shown in Fig. 3 (c). It indicates additional states between and , where the strongly dispersing band is unoccupied: beyond a “shadow band” is visible which disperses away from the gap edge and exhibits a symmetry consistent with the 21 superstructure. Its small intensity is compatible with the small gap size [13]. As shadow bands are rather weak in general a clear identification in experiment has been possible only for very few quasi-1D materials [13, 14].
The different experiments on SrNbO3.41 all yield clear evidence for an energy gap at along the conducting chains: a rise in the dc resisitivity, a strong peak in the optical conductivity, as well as a significant suppression of spectral weight in ARPES. All results lead to characteristic energies of a few meV – agreeing well enough to demonstrate that the gap does exist and suggesting a common origin. Some spread is present, as expected, due to the different nature of the excitation for the various techniques (the optical gap, e. g., is somewhat smaller, possibly due to excitonic effects).
Most surprising is the gap’s extreme smallness, making it unique among quasi-1D materials; the unusual properties of the gap, however, turn out to defy easy explanation: (i) A lattice superstructure with sufficiently small displacement amplitudes would of course be able to reproduce the gap and its small size. It cannot, however, plausibly explain why the gap should be situated right at , considering the large width (2 eV [5, 10]) of the quasi-1D band. The instabilities of quasi-1D systems, on the other hand, by their very nature cause a gap located at and thus are more likely candidates for an explanation of the gap properties observed for SrNbO3.41 – such as (ii) a MH-type insulating state with a gap at due to electron-electron interaction; for this, the filling level of the quasi-1D band would have to be commensurate, 1/3. This 1/3 filling, however, would require long-range interaction and a TLL parameter 1/3 for a MH gap to open [15], and the very strong correlation implied by the latter appears implausible for SrNbO3.41: correlation effects are generally small for systems like niobium oxides. The possibility of a MH gap is thus unlikely yet cannot be fully excluded based on our data as theoretical results for 1/3 filling are still scarce. (iii) A Peierls instability caused by electron-phonon coupling appears possible, too, leading to a CDW state for sufficiently low temperatures with a gap at [16, 17]. The gap size is related to the mean-field (MF) transition temperature , and in the weak-coupling limit 2(0) = 3.52; from the ARPES gap 2(25 K)10 meV one can then estimate 40 K [18]. Only below this temperature the gap (or its precursor, the fluctuation-induced pseudogap) can exist; in this sense strictly limits the temperature range where any gap-related features can possibly be observed. Yet for SrNbO3.41 one clearly sees the upturn in (Fig. 1) to start at 55 K, and the low-energy peak for E in optics (Fig. 2) is almost fully developed already at 50 K, suggesting an onset well above that temperature. A simple Peierls picture therefore is also insufficient to provide an explanation for the observed small gap [19]. Inconsistencies between the experimental results and theorical models have been found for other quasi-1D systems as well, like the paradigmatic (NbSe4)3I, (TaSe4)2I, and K0.3MoO3. The latter two are CDW systems yet show clear discrepancies to the Peierls picture (e. g., ARPES line shape and Fermi cutoff above TP), which were attributed to correlation effects [3, 20]. In contrast, quasi-1D SrNbO3.41 has no obvious Peierls transition, little tendency to correlation, and the relevant energy scale is drastically smaller. It seems to be a system with characteristics distinctly its own, thus expanding the parameter space where real 1D systems remain to be fully understood.
In summary, we consistently observe in ARPES, dc resistivity, and optics that SrNbO3.41 is a compound with 1D electronic characteristics around ; as expected for such a system, instabilities lead to an energy gap at . Most surprising is its small gap size: only a few meV by all techniques and thus much smaller than for other quasi-1D compounds. Further analysis shows the experimental findings to appear inconsistent with validity ranges for both the Peierls and Mott-Hubbard picture. These aspects promise more general implications for the understanding of real 1D systems.
We thank B. Götz, G. Hammerl, A. Loidl, L. Perfetti, C. Rojas, C. Schneider, R. Schulz, I. Vobornik, J. Voit, and H. Winter for valuable help and fruitful discussions. This work was supported by the DAAD, the BMBF (project No. 13N6918/1), and the DFG.
REFERENCES
- [1] [∗] Permanent address: General Physics Institute, Academy of Sciences, Vavilov 38, Moscow 117942, Russia.
- [2] J. Voit, Rep. Prog. Phys. 58, 977 (1995).
- [3] M. Grioni and J. Voit, in Electron spectroscopies applied to low-dimensional materials, edited by H. P. Hughes and H. I. Starnberg (Kluwer, Dordrecht, 2000).
- [4] F. Lichtenberg et al., Z. Phys. B 84, 369 (1991); T. Williams et al., J. Solid State Chem. 103, 375 (1993).
- [5] C. A. Kuntscher et al., Phys. Rev. B 61, 1876 (2000).
- [6] S. Nanamatsu et al., J. Phys. Soc. Jpn. 30, 300 (1971); S. Nanamatsu, M. Kimura, and T. Kawamura, J. Phys. Soc. Jpn. 38, 817 (1975).
- [7] F. Lichtenberg et al., Prog. Solid State Chem. 29, 1 (2001).
- [8] S. C. Abrahams et al., Acta Cryst. B 54, 399 (1998).
- [9] C. A. Kuntscher et al. (to be published).
- [10] H. Winter, S. Schuppler, and C. A. Kuntscher, J. Phys.: Cond. Matt. 12, 1735 (2000).
- [11] N. P. Armitage et al., Phys. Rev. Lett. 86, 1126 (2001).
- [12] Charging: With (25K) from Fig. 1, estimates of possible charging effects induced by the total photoemission current turn out to be 3 orders of magnitude smaller than the gap size observed. Angular step size: Simulated ARPES spectra within the Fermi liquid model for a band with the experimental dispersion near and accounting for the experimental angular and energy broadening show that (i) the gap indeed closes at , and that (ii) a step size of 0.25∘ (implying that the actual can be ”missed“ by 0.125∘ at most) is clearly sufficient to rule out that a gap with 1 meV could be due to this effect.
- [13] J. Voit et al., Science 290, 501 (2000).
- [14] V. Vescoli et al., Phys. Rev. Lett. 84, 1272 (2000); J. Schäfer et al., ibid. 87, 196403 (2001).
- [15] H. J. Schulz, in Strongly correlated electronic materials, edited by K. S. Bedell et al. (Addison-Wesley, Reading, MA, 1994).
- [16] R. Peierls, Quantum theory of solids (Oxford University Press, London, 1955).
- [17] The fact that no signatures for a transition are obvious in resistivity (Fig. 1) or detectable in thermal expansion (P. Nagel, V. Pasler, and C. Meingast, unpublished) may be due to the low number of electrons involved in the 1D character of SrNbO3.41; it does not by itself mean that a Peierls transition does not occur.
- [18] A BCS-type approximation for () was used for the estimate.
- [19] The structural affinity of SrNbO3.41 to ferroelectric SrNbO3.50 may be of importance: the central chains responsible for the 1D electronic character are coupled to a network of polarizable NbO6 octahedra structurally equivalent to those giving rise to the high dielectric constant in the ferroelectric, and a certain influence on the electronic properties of the chains is conceivable.
- [20] L. Perfetti et al., Phys. Rev. Lett. 87, 216404 (2001).