NMR and Relaxation in Superconductor
Abstract
NMR and nuclear spin-lattice relaxation rate (NSLR) are reported at 7.2 Tesla and 1.4 Tesla in powder samples of the intermetallic compound with superconducting transition temperature in zero field = 39.2 K. From the first order quadrupole perturbed NMR specrum a quadrupole coupling frequency of 835 5 kHz is obtained. The Knight shift is very small and it decreases to zero in the superconducting phase. The NSLR follows a linear law with = 165 10 (sec K) . The results in the normal phase indicate a negligible -character of the wave function of the conduction electrons at the Fermi level. Below the NSLR is strongly field dependent indicating the presence of an important contribution related to the density and the thermal motion of flux lines. No coherence peak is observed at the lower field investigated (1.4 T).
pacs:
74.25.Nf, 74.70.AdI Introduction
Magnesium diboride () is an intermetallic compound whose superconductivity with 39 K was recently discovered.[1] The observation of a significant boron isotope effect[2] strongly suggests that the system is a phonon-mediated BCS superconductor thus making this intermetallic compound very interesting for its remarkably high among conventional BCS superconductors.
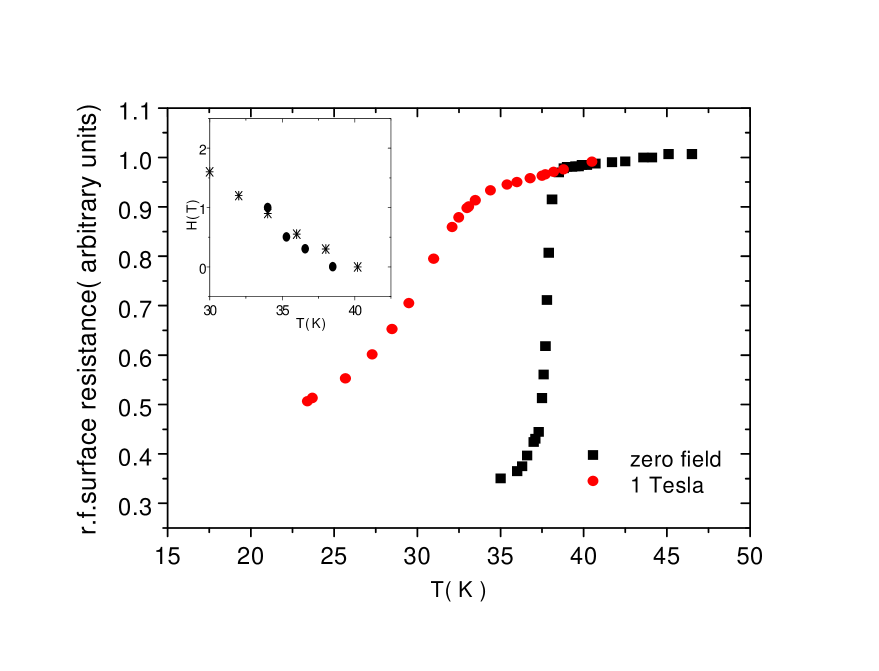
crystallizes in the hexagonal type structure, which consists of alternating hexagonal layers of atoms and graphite-like honeycomb layers of atoms. Powder samples of isotopically enriched were prepared with the method described in Ref. [2]. X-ray powder diffraction measurements confirmed the hexagonal unit cell of .[1, 2] Magnetization measurements done at = 25 Oe yield a transition temperature = 39.2 K with a shielding volume fraction close to 100%.[2, 3] We have investigated two different samples from different batches of polycrystalline enriched in order to check the reproducibility of the data. The two samples are referred to as sample 1 and sample 2. Both samples are in powder form with sample 1 having been ground to a smaller grain size. No substantial differences were observed in the NMR measurements on the two samples. The onset of superconductivity in sample 2 was determined by monitoring the detuning of the NMR circuit occurring at (see Fig. 1). This type of measurement corresponds to probing the temperature dependence of the radio frequency surface resistance. Thus, as the magnetic field is increased the transition region broadens due to the dissipation associated to flux lines motion below and at 7.2 Tesla no detuning can be observed although the magnetization measurements indicate a = 23 K at 7 Tesla. The temperature at which the detuning is first observed is plotted in the inset of Fig. 1 for the different magnetic fields and compared to the values obtained in Ref. [4] from magnetization measurements. From the good agreement between the two sets of data one can deduce that the onset of detuning in the NMR circuit occurs at the irreversibility line.
II NMR Results
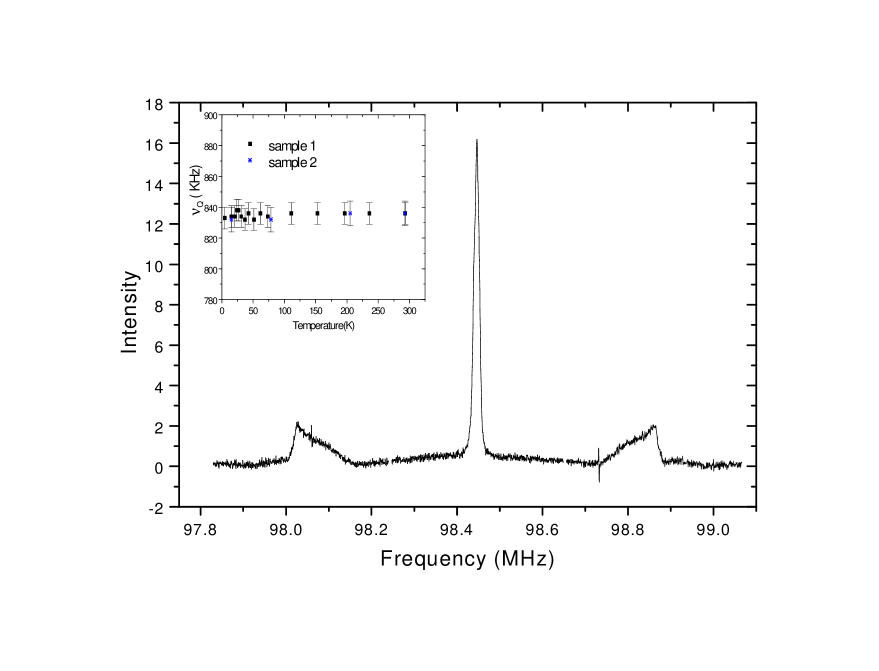
NMR and relaxation measurements were performed with a pulse Fourier transform spectrometer in an external magnetic field of 7.2 T and 1.4 T. Fig. 2 shows the spectrum obtained from the Fourier transform of half of the solid echo following a - pulse sequence. In order to cover the whole spectrum three separate spectra were recorded at resonance frequencies centered at the three lines and added together. The spectrum shows the typical powder pattern for a nuclear spin = 3/2 in presence of first order quadrupole effects with an axially symmetric field gradient.[5] The separation of the symmetric satellite lines is given by whereby for the powder singularities = 90∘ thus yielding kHz. The axially symmetric field gradient is consistent with the local hexagonal symmetry at the boron site. The quadrupole coupling constant is practically independent of temperature (see inset in Fig. 2) ruling out any structural distortion of the lattice in the temperature range investigated.
The full width at half maximum (FWHM) of the central line of the spectrum is about 16 kHz in the 7.2 T magnetic field and is temperature independent in the 4.2 - 300 K range. The second order quadrupole broadening of the central line at this high field can be estimated to be of the order of = 3.5 kHz and can thus be neglected. At 1.4 Tesla the contribution due to quadrupole broadening is 18 kHz. This is consistent with the observed NMR spectrum which dispalys an asymmetric central line as expected for a powder broadening due to second order quadrupole effects.
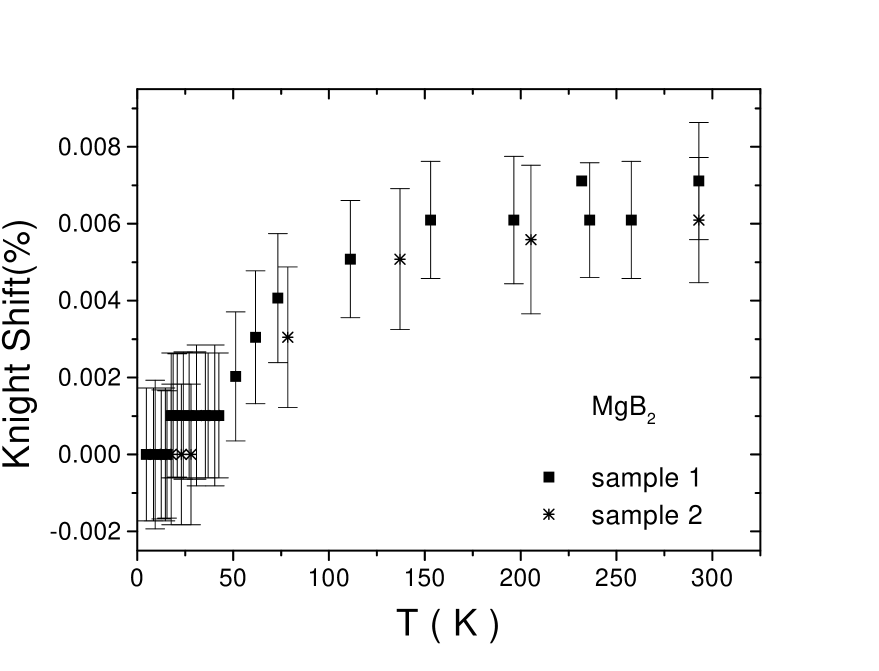
The NMR shift of the central line was measured with respect to the resonance frequency in aqueous solution at 7.2 T. Since the central line does not show at high field any detectable asymmetry the anisotropic shift must be negligible and the measured shift can be entirely ascribed to an isotropic Knight Shift (). The temperature dependence of is shown in Fig. 3. The large error bars are due to the small size of the shift with respect to the width of the line.
nuclear spin lattice relaxation rates (NSLR) were measured by saturating the central line only with a single pulse and monitoring the growth of the solid echo at variable delays.[6] The NSLR defined as was extracted from the fit of the data to the recovery law:
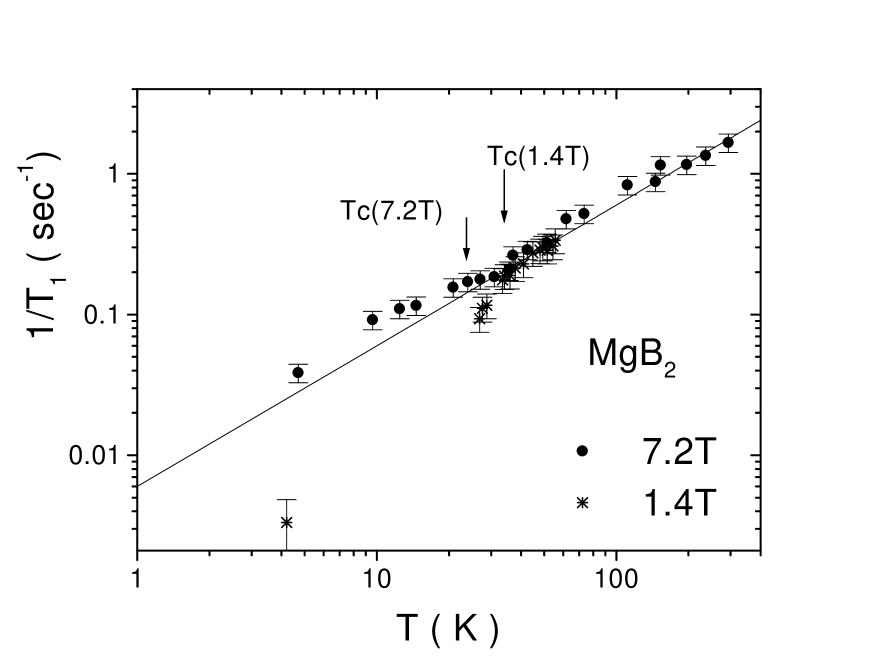
which is obtained from the solution of the master equations in case of a magnetic relaxation mechanism.[7] The temperature dependence of the NSLR is shown in Fig. 4. As can be seen a linear temperature dependence is observed in the normal phase that is independent of the applied magnetic field. Below the NSLR is very different for the two field values i.e. 7.2 T and 1.4 T.
III Discussion and Conclusions
A Normal State
The Knight Shift at the site is dominated by the contact hyperfine interaction due to -type electrons with negligible contributions from core polarization, exchange interactions and orbital terms.[8, 9] Thus, the very small value of at room temperature (see Fig. 3) indicates a very small -character of the wave function of the conduction electrons at the Fermi surface in . For comparison, in intermetallic compound, where the isotropic Knight Shift is almost one order of magnitude bigger than in ,[9] the ratio between the -type density of states at the Fermi level with respect to the total density of state was estimated to be = 0.013. Thus for one expects an even smaller ratio. Although the absolute value of such a small shift depends critically on the reference compound chosen we can conclude that the -type wave function at the Fermi level is negligible in . This conclusion is not inconsistent with the results of band structure calculations.[10]
In the normal state the NSLR follows a linear temperature dependence down to with = 165 10 sec K (see Fig. 4). The Korringa ratio[8] at room temperature is 0.2, much lower than the ideal value of unity for -electrons and is temperature dependent ( = 2.57 10-6 for with , the gyromagnetic ratios for the electron and nucleus respectively). This indicates that the NSLR is driven by a mechanism different from scattering with -type conduction electrons at the Fermi level. One possible explanation is that the NSLR is dominated by orbital contribution due to -electrons. This contribution is expected to be proportional to the density of p-states at the Fermi level and to temperature but does not obey the Korringa ratio.[8]
B Superconducting State
In conventional BCS -wave superconductors one expects a coherence peak below in the NSLR and an exponential decrease at low of both the Knight Shift and due to the opening of the superconducting gap.[11] Since the Knight Shift is small compared to the line width in a powder sample no quantitative information can be obtained here from the decrease of below (see Fig. 3). Regarding the NSLR the measurements in an external magnetic field are difficult to interpret because of the presence of a contribution to relaxation due to the flux lines.[12] Also, the size of the coherence peak can be drastically reduced by an external magnetic field, through a pair-breaking mechanism.[13]
At 7.2 Tesla the temperature dependence of in Fig. 4 does not show any coherence peak nor exponential drop but rather a slight enhancement with respect to the normal state which persists down to 4.2 K. At such a high field it is likely that the NSLR below is largely dominated by the relaxation of nuclei inside the vortex core. In fact, from the measurement of the upper critical field = 16.5 T[14] one can estimate a vortex size = 60 which can be compared with the intervortex spacing at 7.2 T for a triangular vortex lattice i.e. = 200 . In presence of spin diffusion process (short and long ) the measured NSLR is a weighted average of the relaxation in the vortex core where the metal is in the normal state and in the intervortex region whereby the short relaxation in the vortex core dominates the measured NSLR.[12] As a matter of fact the slight increase of the NSLR observed below at 7.2 T is similar to the effect due to thermal motion of flux lines previuosly observed in HTSC.[15]
At 1.4 Tesla the NSLR (see Fig. 4) in the normal state is the same as at 7.2 T as expected for a relaxation mechanism due to scattering with the conduction electrons. Below the superconducting transition temperature the signal becomes very weak due to the small penetration of the radio frequency. The few measurements we could perform indicate that there is no measurable coherence peak just below and that the NSLR at low temperatures is much longer than at 7.2 T confirming that the dominant contribution to relaxation in an external magnetic field is associated with the density of flux lines and their thermal fluctuations.[12, 15]
In conclusion, we compare our results with the NSLR data reported by Kotegawa et al.[16] Above both sets of data are in good agreement. Below our data at 7.2 T and at 1.4T are quite different from Kotegawa’s data taken at 4.42 T confirming the strong field dependence of in the superconducting phase that we ascribe to the contribution of fluxons. As a consequence, any conclusion regarding the coherence peak and the superconducting gap obtained from data taken in an external magnetic field appears dubious. One should either perform the measurements in zero field by a field cycling technique[11] or one should do a careful study of the field dependence in order to subtract off first the contribution due to flux lines. These studies, which require a long time to perform due to the weakness of the signal and the very long NSLR at low fields, are currently planned. Finally we compare our results with the results reported by Gerashenko et al.[17] The conclusions about the quadrupole perturbed NMR spectrum are in excellent agreement with our data. The differences in the Knight Shift values should be ascribed to the use of a difference reference sample. The data of NSLR below were taken by Gerashenko et al. in a magnetic field of 2.113 T and are in qualitative agreement with our data at 1.4T particularly regarding the absence of a coherence peak.
IV Acknowledgments
We would like to thank D. K. Finnemore and V. P. Antropov for useful discussions and D. Procissi and R. Vincent for experimental help. Ames Laboratory is operated for US Department of Energy by Iowa State University under contract No. W-7405-Eng-82. This work at Ames Laboratory was supported by the Director for Energy Research, Office of Basic Energy Science.
REFERENCES
- [1] J. Nagamatsu, N. Nakagawa, T. Muranaka, Y. Zenitani, and J. Akimitsu, Nature 410, 63 (2001).
- [2] S. L. Bud’ko, G. Lapertot, C. Petrovic, C. E. Cunningham, N. Anderson, and P. C. Canfield, Phys. Rev. Lett. 86, 1877 (2001).
- [3] P. C. Canfield, D. K. Finnemore, S. L. Bud’ko, J. E. Ostenson, G. Lapertot, C. E. Cunningham, and C. Petrovic, Phys. Rev. Lett. 86, 2423 (2001).
- [4] D. K. Finnemore, J. E. Ostenson, S. L. Bud’ko, G. Lapertot, and P. C. Canfield, Phys. Rev. Lett. 86, 2420 (2001).
- [5] A. Abragam, Principles of Nuclear Magnetism, Academic Press, Oxford, 1961.
- [6] E. Fukushima and S. B. W. Roeder, Experimental Pulse NMR, Addison-Wesley Pub.Co (1981).
- [7] E. R. Andrew and D. P. Tunstall, Proceedings of the Physical Society (London), 78, 1 (1961).
- [8] G. C. Carter, L. H. Bennet and D. J. Kahan, Metallic Shifts in NMR, Progress in Material Science Vol.20, Pergamon Press, 1977.
- [9] B. J. Suh, F. Borsa, D. R. Torgeson, B. K. Cho, P. C. Canfield, D. C. Johnston, J. Y. Rhee, and B.N.Harmon, Phys. Rev. B54, 15341 (1996).
- [10] J. Kortus, I. I. Mazin, K. D. Belashchenko, V. P. Antropov, and L.L. Boyer, cond-mat/0101446, 30 Jan 2001.
- [11] L. C. Hebel and C. P. Slichter, Phys. Rev. 113, 1504 (1959).
- [12] A. Rigamonti, F. Borsa, and P. Carretta, Reports on Progress in Physics 61, 1367 (1998).
- [13] Y. Masuda and N. Okubo, J. Phys. Society of Japan 26, 309 (1969).
- [14] S .L. Bud’ko, C. Petrovic, G. Lapertot, C. E. Cunnigham, P.C. Canfield, M-H. Jung, and A. H. Lacerda, cond-mat/0102413, 22 Feb 2001.
- [15] B. J. Suh, F. Borsa, J. Sok, D. R. Torgeson, M. Corti, A. Rigamonti, and Q. Xiong, Phys. Rev. Let. 76, 1928 (1996); see also M. Corti, B. J. Suh, F. Tabak, A. Rigamonti, F. Borsa, M. Xu, and B. Dabrowski, Phys. Rev. B54, 9469 (1996).
- [16] H. Kotegawa, K. Ishida, Y. Kitaoka, T. Murunaka, and J. Akimitsu, cond-mat/0102334 19 Feb 2001.
- [17] A. Gerashenko, K. Mikhalev, S. Verkhovskij, T. D’yachkova, A. Tyutyunnik, and V. Zubkov, cond-mat / 0102421 23 Feb 2001.