In-plane magnetic field-induced spin polarization and transition to insulating behavior in two-dimensional hole systems
Abstract
Using a novel technique, we make quantitative measurements of the spin polarization of dilute (3.4 to 6.8 cm-2) GaAs (311)A two-dimensional holes as a function of an in-plane magnetic field. As the field is increased the system gradually becomes spin polarized, with the degree of spin polarization depending on the orientation of the field relative to the crystal axes. Moreover, the behavior of the system turns from metallic to insulating before it is fully spin polarized. The minority-spin population at the transition is cm-2, close to the density below which the system makes a transition to an insulating state in the absence of a magnetic field.
pacs:
73.50.-h, 71.30.+h, 71.70.EjA fundamentally important property of a two-dimensional (2D) carrier system is its response to a parallel magnetic field. Thanks to the Zeeman coupling, the parallel field induces a partial polarization of the carriers’ spin and yields a system with two separate spin subbands. Although there have been no direct measurements of the spin subband populations so far, certain features of the parallel magnetoresistance have been interpreted as the onset of full spin polarization of the 2D system Okamoto99 ; Mertes99 ; yoon00 ; Stergios:2D ; Vitkalov . The response to a parallel field may also help us understand why a 2D system, long believed to have an insulating ground state gangoffour ; bishop , displays a metallic behavior at finite temperatures in a certain range of carrier densities at zero magnetic field Okamoto99 ; Mertes99 ; yoon00 ; Stergios:2D ; Vitkalov ; krav ; MIpapers ; Murzin ; Stergios:Sci ; yaish ; Stergios:symetry . The parallel field also causes a transition from metallic to insulating behavior, and it has been suggested that this transition may be related to the spin polarization of the 2D system Mertes99 ; Stergios:2D ; Vitkalov . But again, there have been no quantitative measurements assessing this connection.
Here we report direct and quantitative measurements of the spin polarization of dilute GaAs 2D hole systems (2DHSs) as a function of a strong parallel field (). We slowly rotate the sample in a large, almost parallel field [Fig. 1(a)], and measure its resistance as a function of the perpendicular component of the field (). The latter leads to Shubnikov-de Haas (SdH) oscillations in the resistance, which we Fourier analyze to find the population of the spin subband densities and therefore the spin polarization of the 2DHS. Our experiments allow a determination of the spin polarization in a parallel field and of the field, , above which the 2DHS becomes fully spin polarized. We find that both the spin polarization and depend on the orientation of relative to the crystal axes, thus confirming the anisotropy of the -factor in this system Stergios:2D ; Winkler:g . We also measure the temperature dependence of the resistance vs traces to determine the field () above which the system makes a transition from metallic to insulating behavior. Combining these results, we determine the population of the minority spin subband at the field . We find that in the density range of our study, the behavior turns insulating whenever the minority spin subband population drops below a threshold (cm-2), which is approximately independent of the total 2D hole density or the field . Interestingly, this threshold population is of the order of the density below which our 2DHS makes a transition to an insulating behavior at zero magnetic field.
We studied a Si-modulation doped GaAs quantum well grown on a (311)A GaAs substrate. The 2DHSs grown on GaAs (311)A substrates exhibit a mobility anisotropy stemming from an anisotropic surface morphology jean ; wassermeier . The interfaces between the GaAs and the AlGaAs are corrugated, with ridges along [33] direction, thus reducing the mobility for current parallel to [01]. We therefore used an L-shaped Hall bar aligned along [01] and [33] to allow simultaneous measurement of the resistivity along the two directions [Fig. 1(a)], and also deposited a metal front gate to control the density. We made measurements in pumped 3He at the temperature K. The sample was mounted on a single-axis tilting stage that can be rotated, using a computer controlled stepper motor, in order to change the angle () between the sample plane and the magnetic field. The measurements were done using low-frequency lock-in techniques. As grown, the sample has a density cm-2, and mobilities of 35 and 55 m2/Vs along the [] and [] directions, respectively.
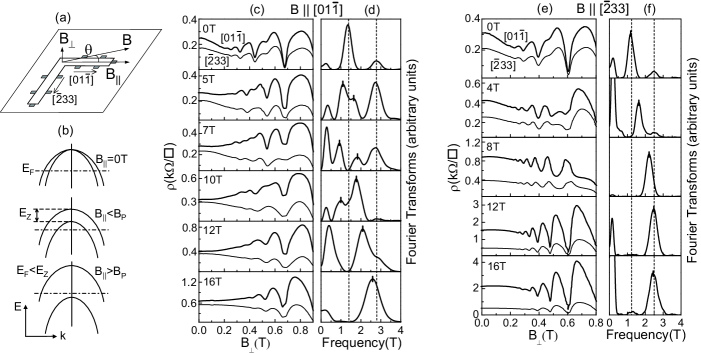
Application of a magnetic field parallel to the 2DHS separates the two spin subbands by the Zeeman energy, , as shown schematically in Fig. 1(b) R2 ; R4 . In our experiments [Fig. 1(a)], we apply a constant magnetic field (), slowly rotate the sample around to introduce a small , and measure both the longitudinal and Hall resistances. We use the Hall resistance to determine . We then analyze the SdH oscillations induced by , which give information about the Fermi surface of the 2DHS and the two spin subband densities. We emphasize that in our measurements, thanks to the high sample quality and the strength of the SdH oscillations, we are able to limit to sufficiently small values so that to better than 2.5% during the sample rotation.
In Fig. 1(c) we show plots of resistivity vs , all taken at a fixed density. In each box, two traces are shown, one for sample current along [01] (thick line) and the other for [33]. The traces in the top box were taken with fixed at and represent standard SdH measurements, i.e. T. From the corresponding Hall measurements (not shown), we determine a total hole density cm-2. The Fourier transform (FT) of the SdH oscillations for the [01] trace is shown in the top box Fig. 1(d); the FT of the [33] trace is similar and is not shown. The FT exhibits two peaks, one at 2.8T and another at half this value, at 1.4T R1 . The 2.8T peak, when multiplied by cmT, gives cm-2, equal to the total density of the 2DHS; this peak corresponds to the spin-resolved SdH oscillations, which are seen in the vs trace for T. The main FT peak at 1.4T stems from the spin-unresolved oscillations.
The traces in the rest of the boxes in Fig. 1(c) were taken at the indicated applied along [01] and by tilting the sample, as shown in Fig. 1(a). Note that in all traces, . With increasing , the lower (1.4T) peak in the FT spectrum splits into two peaks whose positions, when multiplied by , add up to the total density of the sample. We therefore associate these two peaks with the Fermi contour areas (populations) R3 of the two Zeeman split spin subbands of the 2DHS [Fig. 1(b)]. As increases, the majority spin subband peak merges with the total density (2.8T) peak, while the minority spin subband peak moves to very low frequencies and can no longer be resolved R1 .
The panels (e) and (f) in Fig. 1 show similar data, but here is along [33] and cm-2. The frequency of the FT peak associated with the majority spin subband density increases in value as is increased from 4T to 12T and saturates at a constant value for T. This saturation signals the complete depletion of the minority spin subband and full spin polarization of the 2DHS. The saturation value of the FT peak position agrees with the total density of the 2DHS.
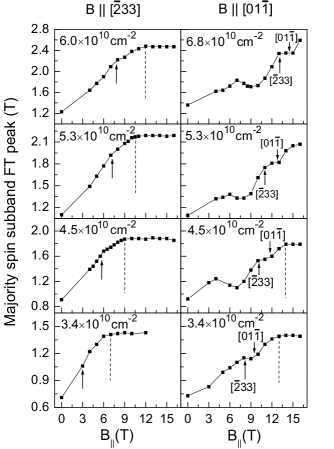
In Fig. 2, we summarize the positions of the FT peaks corresponding to the majority spin subband as a function of for the two cases examined in detail in Fig. 1 and for three additional densities. There are several remarkable trends in these data. With increasing , the spin polarization of 2DHS increases and saturates above a field , marked by dashed vertical lines in Fig. 2. The field signals the full spin polarization of the 2D system and, as expected, decreases with decreasing density R4 . However, , as well as the rate at which the minority spin subband population decreases with , depend critically on the orientation of relative to the crystal axes. When is applied along [33], the depopulation is monotonic and nearly linear with , but not so when is along [01]. Moreover, for a given density, the depopulation is faster (smaller ) when is parallel to [33]. These observations provide clear and quantitative evidence for the anisotropic dependence of the Zeeman energy and the -factor on the orientation of parallel field in this system.
The observed -factor anisotropy is also qualitatively consistent with the results of energy band calculations in this system Winkler:g . The measured fields , however, are about 2 to 3 times smaller than those calculated. We believe this discrepancy stems from the fact that many-body interactions are not included in the calculations. Such interactions are present in our dilute 2D system, and are expected to lead to an enhacement of the product Okamoto99 ; R4 and to lower the field at a given density. The non-monotonic -dependence of the spin polarization, for along [01], is also quite intriguing and may be a result of many-body interactions: while band calculations exhibit some non-linearities in the spin polarization vs curves Winkler:g ; Winkler:unpublished , they do not indicate the strong features observed in the measurements.
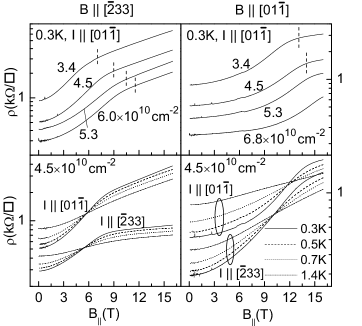
We now present magnetoresistance (MR) data, taken as a function of () and discuss their features in relation to the spin polarization data. Such MR data have been recently reported for a number of 2D systems Okamoto99 ; Mertes99 ; yoon00 ; Stergios:2D ; Vitkalov . In Fig. 3 we provide examples of MR traces taken on the present sample, at different densities, for various orientations of and current relative to the crystal axes. In agreement with previous measurements on GaAs 2DHSs yoon00 , these traces exhibit a strong positive MR. The MR has a functional form in the low field regime and at high fields; the parameters and depend on density and orientation of relative to the crystal axes. In Ref. Stergios:2D , the field around which the functional form changes is associated with the onset of full spin polarization. Our measured , marked with dashed vertical lines in Fig. 3 (top panels), are very close to the onset of the dependence and quantitatively validate the above association.
Of particular relevance to the anomalous metallic-like behavior in 2D systems is the -dependence of the MR Mertes99 ; yoon00 ; Stergios:2D . In Fig. 3 (bottom panels) we show examples of such data for our sample at a density of cm-2. The data, in agreement with previous results yoon00 ; Stergios:2D , reveal that the metallic behavior observed at zero magnetic field becomes insulating above a certain field, . For a given density, the field depends on the orientation of relative to both the crystal axes and the sample current direction [Figs. 2 and 3], but is always smaller than , i.e., the transition to the insulating phase occurs before the 2DHS is fully spin polarized. Our data allow us to answer an important question: What is the population of the minority spin-subband at , the onset of the insulating behavior? In Fig. 4 we present a plot of the minority spin population at determined from our data. This plot reveals a key result of our measurements: the insulating behavior starts when the minority spin population drops below a threshold, cm-2, approximately independent of either the total density of the 2DHS, or the orientation of relative to the crystal axes or the sample current direction! Also intriguing is the observation that, in the absence of an applied magnetic field, our 2DHS turns insulating when its total density falls below cm-2.
We conclude that the metallic behavior appears to be linked with the presence of two subbands whose populations are above a threshold. We suggest that a temperature dependent intersubband scattering mechanism may be responsible for the metallic behavior that we observe in this 2DHS at finite temperatures Murzin ; Stergios:Sci ; yaish ; Stergios:2D . When the density of one of these subbands falls below the cm-2 threshold, its mobility is sufficiently reduced so that it stops to play a role in transport. This deduction is in fact corroborated by our own data as we see no sign of SdH oscillations of the minority spin-subband when the density of this subband is below the threshold. It is also interesting to note that the dependence of spin-polarization on exhibits a kink near the field for both orientations of relative to the crystal axes (Fig. 2). We hope that further experiments will shed light on this aspect of the data.

To summarize, via a novel technique, we have measured, the spin subband populations of a 2D hole system as a function of a parallel magnetic field. The system gradually becomes spin polarized, with the rate of polarization and the field of full spin polarization depending on the orientation of the parallel field relative to the crystal axes. Moreover, the 2D system turns insulating before it is fully spin polarized, when its minority spin subband population drops below a threshold which is independent of the total density .
Our work was supported by ARO, DOE, and NSF. We thank R. Winkler for valuable discussions.
References
- (1) T. Okamoto et al., Phys. Rev. Lett. 82, 3875 (1999).
- (2) K. Mertes et al., Phys. Rev. B60, 5093 (1999).
- (3) J. Yoon et al., Phys. Rev. Lett. 84, 4421 (2000).
- (4) S.J. Papadakis, Phys. Rev. Lett. 84, 5592 (2000).
- (5) S.A. Vitkalov et al., Phys. Rev. Lett. 85, 2165 (2000); S.A. Vitkalov, cond-mat/0009454.
- (6) E. Abrahams et al., Phys. Rev. Lett. 42, 673 (1979).
- (7) D. Bishop et al., Phys. Rev. Lett. 44, 1153 (1980).
- (8) S.V. Kravchenko et al., Phys. Rev. Lett. 77, 4938 (1996).
- (9) D. Popović et al., Phys. Rev. Lett. 79, 1543 (1997); P.T. Coleridge et al., Phys. Rev. B 56, R12764 (1997); Y. Hanein et al., Phys. Rev. Lett. 80, 1288 (1998); M.Y. Simmons et al., Phys. Rev. Lett. 80, 1292 (1998); S.J. Papadakis and M. Shayegan, Phys. Rev. B 57, R15068 (1998).
- (10) S. Murzin et al., JETP Lett. 67, 113 (1999).
- (11) S.J. Papadakis et al., Science 283, 2056 (1999).
- (12) Y. Yaish et al., Phys. Rev. Lett. 84, 4954 (2000).
- (13) S.J. Papadakis et al., cond-mat/0008041.
- (14) R. Winkler et al., Phys. Rev. Lett. 85, 4574 (2000).
- (15) J. Heremans et al., J. Appl. Phys. 76, 1980 (1994).
- (16) M. Wassermeier et al., Phys. Rev. B51, 14721 (1995).
- (17) As a result of inversion asymmetry and strong spin-orbit coupling, the energy bands of GaAs 2D holes are spin-split even in the absence of a magnetic field (see, e.g., Ref. [11]). For completeness, we show this spin splitting in Fig. 1(b), even though the population difference between the two subbands is too small to be resolved in our samples, in the range of densities explored here.
- (18) In a simplified picture, without spin-orbit coupling, the difference between the spin subbands populations is , where is the Zeeman energy, the effective mass, and the effective g-factor. In such a picture, the 2D system becomes fully spin polarized at a field , where is the 2D density.
- (19) The peaks observed at very low frequencies (T) in Figs. 1(d) and 1(f) are artifacts.
- (20) This association may not be exact. In the case of spin-orbit induced subband splitting, the frequencies of SdH oscillations, multiplied by can deviate slightly from the spin-subband populations [R. Winkler et al., Phys. Rev. Lett. 84, 713 (2000)]
- (21) R. Winkler, unpublished.