Atomic Deuterium Adsorbed on the Surface of Liquid Helium
Abstract
We investigate deuterium atoms adsorbed on the surface of liquid helium in equilibrium with a vapor of atoms of the same species. These atoms are studied by a sensitive optical method based on spectroscopy at a wavelength of 122 nm, exciting the 1S-2P transition. We present a direct measurement of the adsorption energy of deuterium atoms on helium and show evidence for the existence of resonantly enhanced recombination of atoms residing on the surface to molecules.
pacs:
67.65.+z, 67.70.+n, 34.50.DyTriggered by the first observation of Bose-Einstein condensation (BEC) in atomic gases [1, 2], there has been a growing interest in the investigation of quantum degenerate behaviour of fermionic atoms. Attention has focused mainly on magnetically trapped gases of the fermionic isotopes 6Li and 40K. The latter isotope was the first atomic Fermi gas to be cooled to below the Fermi temperature [3].
An a priori candidate for the comparison between Bose and Fermi gases is the simplest atom of all: hydrogen (H), with its fermionic isotope deuterium (D). The appeal of these atomic gases lies both in the possibility of cryogenic precooling, which enables much larger samples to be cooled than with laser cooling techniques, and in the existence of a natural two-dimensional quantum gas on the surface of liquid helium. The H quantum gas has been extensively investigated and quantum degenerate behaviour (BEC) has been reported both in three dimensions [4] and in the two-dimensional (2-d) adsorbed gas [5]. The first optical observation of H atoms in the adsorbed phase was reported in 1998[6]. In that experiment Lyman- spectroscopy at a wavelength of 122 nm was used to excite the 1S-2P transition in a surface specific way. In this paper we will use Lyman- spectroscopy to investigate a three dimensional gas of atomic deuterium in contact with D atoms adsorbed on the surface of liquid helium. Deuterium atoms are easily distinguished from the hydrogen atoms that are always present as impurities, because of the large isotope shift of about 630 GHz.
In contrast to H, very few experiments with spin polarized D have been reported in the literature, mainly because spin-polarized D has been found to be significantly less stable than spin-polarized H and experiments are much harder [7, 8, 9, 10]. The key reason for the low stability of D is the high adsorption energy on the helium surface which reduces the overall lifetime because loss processes (molecule formation) occur primarily on the surface. Knowledge of both this binding energy as well as the rate constant governing the formation of molecules are essential ingredients for any experiment aiming at 2-d quantum degeneracy. To date the values of both these quantities are not beyond controversy. It has been suggested [10] that the recombination rate on the surface in finite magnetic field may be dominated by a resonant process similar to what was predicted for free D atoms [11]. This assumption has never been properly tested.
The aim of this paper is threefold: firstly, to provide a direct measurement of the absorption energy of a deuteron onto liquid helium, secondly to determine the rate constant for recombination (molecule formation) of atoms residing on the surface as a function of magnetic field, and finally to attempt to approach the regime of Fermi-degeneracy in the adsorbate of D atoms as closely as possible.
The adsorption energy for H on the surface of liquid helium K [8] is well established. For D the values reported in literature vary between K [7], measured in 8T, and in a zero-field [10]. The discrepancy between these values is significantly larger than the accuracy of the measurements. A possible explanation was put forward in ref. [10]: It is suggested that the presence of one or more Feshbach scattering resonances may influence the measurement of when performed in high magnetic field. In fact, measurements reported in ref. [7] and [10] rely on the assumption that the “cross length” governing the formation of molecules on the surface is independent of magnetic field and temperature. As we will explain below, this assumption may be wrong if Feshbach resonances are present.
All measurements of presented in literature for D atoms are based on a determination of the decay the atomic gas due to recombination of adsorbed atoms. A direct measurement of has not been performed to date. Such a direct measurement relies on the following simple relation, valid when a three-dimensional gas is in equilibrium with an adsorbed two-dimensional phase in the nondegenerate (Boltzmann) limit:
| (1) |
where and are the surface and bulk density, respectively, and is the thermal de Broglie wavelength. To obtain using this equation one needs to have experimental access to and simultaneously. Using optical spectroscopy we were able to measure and to obtain a fluorescence signal proportional to from the adsorbed atoms.
I Experimental methods
We first describe the experimental setup used for the experiments with H and D adsorbed on He. The heart of this setup is shown in Fig. 1. A volume (called the buffer) of approximately 30 cm3 is filled with D atoms, electron spin polarized into their high-field seeking states. These atoms are produced in a cryogenic discharge in helium vapor operated at a temperature of about 0.8K. The discharge cell contains solid D2 on the walls. These molecules are dissociated while the helium discharge is running. The produced monoatomic gas flows towards the buffer volume with a flux of typically s-1. We perform experiments while the discharge is running with the filling flux compensating the recombination losses. With the discharge switched off the D gas decays in a few seconds due to the formation of D2 molecules.
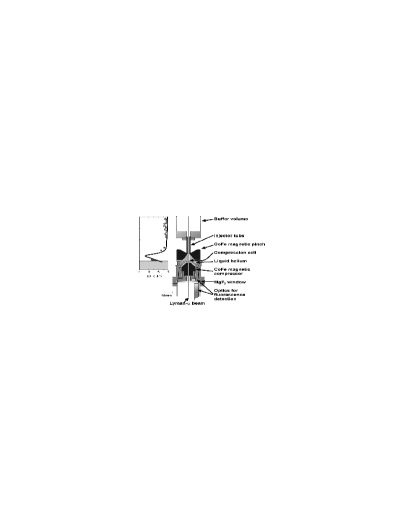
Below the buffer volume there is a second volume called the cell. The buffer is kept at a higher temperature than the cell to reduce absorption of D on its walls. The atoms adsorb primarily on the surface of a layer of bulk helium, located at the bottom of the cell. The temperature of the liquid helium is about 0.3K. The buffer temperature is typically between 0.4 and 0.45K. A strong field gradient (1.6 T/cm) in the cell pushes the atoms towards the helium surface, a principle known as magnetic compression. The cell is separated from the buffer by a magnetic barrier (a local field minimum) which limits the flux of atoms from the buffer to the cell. The cell and buffer are mounted inside the bore of a superconducting solenoid which produces a magnetic bias field of between 4 and 7 T. The magnetic compression and the barrier between buffer and cell are created with cobalt-iron pole pieces (see Fig. 1). We control the flux from the buffer to the cell by varying the temperature of the buffer volume. The flux is approximately given by:
| (2) |
where is the average thermal velocity of atoms in the buffer and is the Bohr magneton. and are the magnetic fields in the center of the buffer and at the magnetic barrier, respectively. is effective area of the aperture separating the buffer from the cell, which includes the Clausing factor of the tube taking into account the strong magnetic field inhomogeneity in the barrier region. From a Monte Carlo calculation we obtained mm2. The net flux from buffer to cell is where the back flux is given by the same expression Eq.(2) but with replaced by the cell density , replaced by the field at the bottom of the cell, and replaced by the cell temperature . The velocity is evaluated at the cell temperature in this case.
A few words of clarification are needed about the meaning of the cell density . As in Eq. (1) we use the subscript 3 (from 3-dimensional) for the cell density to distinguish it from the 2-dimensional density of atoms adsorbed on the surface. However, in contrast to the buffer where the field is nearly constant, the cell has a field gradient and a concomitant varying density. We will understand to mean the density just above the surface. The density decreases with height above the surface due to the strong field gradient, analogous to a barometric height distribution. We now introduce a field and temperature dependent effective volume . Here the integral is over the volume of the cell and is the field at the bottom of the cell (i.e. at the helium surface). is defined such that equals the number of atoms in the cell.
The atoms in the buffer, the cell, and the adsorbed phase, can all be observed independently using Lyman- spectroscopy. The light source we used to produce tunable narrowband 122 nm light is described elsewhere [6, 12]. As can be seen in Fig. 1 the light beam passes through the apparatus from the bottom to the top. We measure both the absorption of the light as well as the light-induced fluorescence (LIF) as a function of the incident light frequency. The atoms in the buffer are distinguished from those in the cell because they reside in a different magnetic field and the resonance lines experience different Zeeman-shifts. The LIF of adsorbed atoms can be distinguished from that of those in the vapor because the resonance lines are shifted by several hundred GHz relative to those of bulk atoms due to the interactions with the liquid helium.
II Experimental results
In this section we discuss the experimental results of spectroscopy of D atoms using Lyman- spectroscopy. The technique allows us to infer the three crucial parameters in the problem: ,, and . The temperatures and are measured directly with resistance thermometers. In earlier studies with H atoms [6] it was found that the LIF of the surface atoms takes the form of a broad feature shifted about 300GHz to the red of the spectral line of free atoms in the bulk gas.

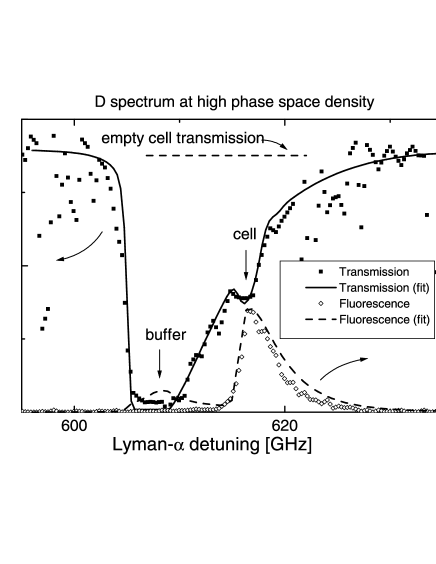
In the deuterium case the broadening of the surface line is even larger than for H. We have indication that the fluorescence is broadenend to more than 1 THz. We could not detect a frequency dependence over the 100 GHz lock range of our laser system and the fluorescence was visible when a D atoms were present at all frequencies between the H spectrum and a blue detuning of 100 GHz with respect to the D lines. We infer the surface density of D atoms by fixing the frequency of the light to a value close to where the peak of the surface-LIF of the D atoms is expected, about 400 GHz to the red of the free atom resonance. If there are adsorbed atoms this gives us a LIF signal proportional to the surface density. The vapor density above the surface can be measured from the LIF as well as from absorption spectroscopy at frequencies close to the free atom resonance. This is shown in Fig. 2. The fit to the LIF signal of the bulk atoms is based on a single-scattering model, which is a good approximation at the relatively low densities involved. The model takes into account the Zeeman and Doppler effects and the thermal distribution of atoms in the cell. The shape of the curve is additionally influenced by the solid angle to the detector. The fluorescence detector can be calibrated in an absolute way by comparing the fluorescence peaks with fits to the transmission spectrum. From this fit we obtain an absolute value for whereas is determined up to a constant factor. We have made these measurements over a range of temperatures, so that we can use Eq.(1) to directly obtain K. The result is given in Fig. 3. The range of temperatures is limited from above by thermal instabilities (fountain effect) of the helium in our apparatus, causing excess noise on the transmission and fluorescence detectors. At the lowest temperatures (for K-1), there is no thermal equilibrium between the (quickly recombining) adsorbed atoms and the bulk gas, and therefore Eq.(1) is not rigorously valid. We have discarded this temperature region from the fit. In Fig. 3. we also plotted (in fact we plot the fluorescence signal). It can be clearly seen that the temperature dependence is quite different from that of the ration , which indicate that the fluorescence is not a spurious artifact due to bulk atoms.
We can also use Eq. (1) to determine the maximally obtained phase space density , a measure of how far we are from Fermi degeneracy. Although the measurement of is not absolutely calibrated, the multiplicative factor follows directly from Eq. (1). We find that at the lowest temperature K the phase space density is . In 2-d this implies where is the Fermi temperature.
The value of K obtained from the fit in Fig. 3 is consistent with the 2.6(4) K measured by Silvera and Walraven [7] but lower than the value 3.97(7) K reported by Arai et al. [10]. In the latter paper it is suggested that the difference may be explained by the fact that their experiment is performed in zero field whereas Silvera and Walraven use a field of 8T. The way in which is measured in both these experiments is by determining the decay rate of the gas. At sufficiently low temperature this decay takes place almost exclusively by formation of molecules from adsorbed atoms on the surface. Consequently the natural way to describe the population dynamics would be in terms of an inelasic cross length governing the collisions between to adsorbed atoms which lead formation of a D2 molecule. The rate of the process is proportional to and to the effective surface area on which the binary collisions take place. This surface is defined analogous to as: , where the integral runs over the surface of the cell. The factor 2 appears in the exponent because two atoms are involved in the formation of molecules. Both and depend on temperature. Our recombination measurements are performed at K. At this temperature we have for our cell: cm3 and cm2.
The surface density is normally difficult to measure and as a consequence in the literature the decay is usually described in terms of an effective bulk recombination rate constant . If we assume that the gas has no nuclear polarization (equal population of all high-field seeking hyperfine states) we may write: [9, 10]:
| (3) |
where is the decay of the 3-d gas in the cell. The effective two body decay rate constant is given by:
| (4) |
Here is the average thermal velocity of adsorbed atoms. Eqs.(3) and (4) are based on the physical picture that atoms spend part of their time on the surface and that in equilibrium the fraction of particles on the surface is determined by Eq.(1). In the exponent a factor appears because molecules are formed in pair collisions, hence the process depends on . By measuring and as a function of one in principle obtains values for and . If one assumes that is independent of and one obtains the following relation between the in zero and finite fields [10]:
| (5) |
where with MHz the hyperfine frequency.
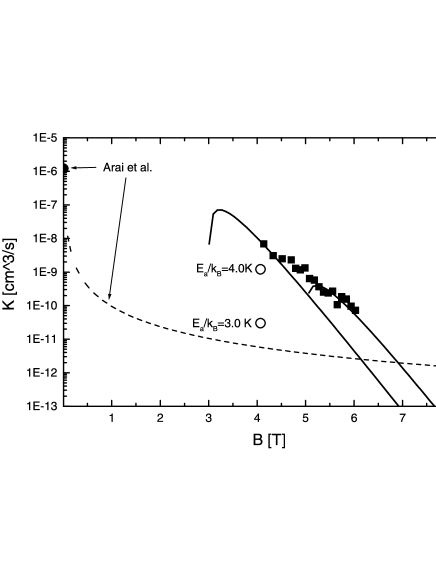
The way just described to determining is plagued by the uncertainty weather is in fact independent of and . Therefore we have independently measured and . We have measured the field dependence of in the following manner: The discharge is kept running, producing an approximately constant flux of D atoms. Some of the atoms recombine in the buffer volume but most escape over the barrier to the cell. The buffer density is measured by fitting the absorption spectrum of the buffer atoms. From this we calculate the escape flux from buffer to cell according Eq.(2). From the fluorescence spectrum of the cell we calculate which gives us , which is generally much smaller than . In steady state the quantity in Eq. (3) is equal to the net flux into the cell . From this, with Eq. (3) we obtain the rate constant . The result is plotted in Fig. 4 as a function of .
Since the result may be thought to depend exponentially on thermometry errors, we took spectra of the H which occurs as an impurity in our deuterium, simultaneously. Since the H does not recombine quickly, it can be used to check the balance of the fluxes: for H the flux into the cell must equal the return flux. We found the ratio of the density of H atoms in the buffer and the cell to be within the accuracy of the measurement. This indicates that possible thermometry errors (due to e.g. spurious thermometer magnetoresistance) cannot contribute more than a factor error to the measured field dependence while the data cover several orders of magnitude over the measures field range.
III Discussion
In Fig. 4 we compare our data to values obtained by other groups. The dotted line in the figure is an extrapolation to finite magnetic field of the zero field measurement of Arai et al. [10]. We have scaled their zero field measurement to correspond to our temperature (the cross in Fig. 4). To extrapolate their measurement to finite fields we used Eq. (5). All data compiled in Fig. 4 have been rescaled to correspond to our value of cm-1. It is clear that our data lie well above the curve of Arai et al. Moreover, there is a much stronger dependence on magnetic field. This can not be due a spurious effect of electron-spin relaxation as for our field range and temperature this lies many orders of magnitude below our measured range of values. It was suggested in ref.[10], on the basis on an analogy with the situation for free D atoms [11], that may be enhanced in finite field due to Feshbach resonances. Such a resonance occurs when the energy of a highly excited state of the singlet molecule coincides with the energy of triplet pair of deuterons in the high field seeking state; the two channels are then coupled by the hyperfine interaction. Near such a resonance we may write as:
| (6) |
Here denotes the dissociation energy of a singlet molecule into a pair of adsorbed atoms. Expression (6) is valid for fields higher than . The reaction time characterizes a two-step process: the formation of the excited singlet state molecule followed by its decay to lower lying levels.
For free D atoms two Feshbach resonances, 2 T apart, in which the rovibrational levels and of are involved, were predicted [11] in field range relevant for this experiment. This suggests that we compare our data with with curves corresponding to Eq.(6). Two such curves are plotted in Fig. 4 at the somewhat arbitrarily chosen field values of 3 and 5 T (with the vertical scale adjusted to match the data best). Above of a single resonance the rate will vary proportional to . The data vary slightly more smoothly with . It is to be expected that the free atom resonances are broadened in the presence of a helium substrate. One might expect a smearing of the same order of magnitude as , which would correspond to a width of more than 4 T, enough to wash out any structure in the resonance spectrum. Another possibility is that motion of the singlet molecule coming off the surface engenders a continuous spectrum of resonances for surface recombination. At any rate the strong observed field dependence supports the idea of resonance recombination.
Three other data points are included in Fig. 4. The measurement at 8 T taken from ref.[7], extrapolated to K using their measured temperature dependence and corrected for our value of , is consistent with the extrapolation of our data to higher field. The error results from the uncertainty in the value for quoted in ref.[7] which is reflected in the extrapolation to lower temperature. In fact our data indicate that the influence of the resonance hardly extends to a field of 8 T which explains why the value for K found in ref.[7] coincides with ours within the margin of error. The datapoints at 4.07T are taken from ref.[9]. We have extrapolated the measurements taken at their lowest temperature of 0.65K down to our cell temperture using two different values: 3.0 and 4.0 K, respectively, for the effective adsorption energy (asuming for the extrapolation). Both datapoints obtained in this way from ref.[9] lie below ours. The reason for this discrepancy is unclear.
In conclusion, the strong field dependence of the recombination cross length of deuterium revealed by our measurements does point towards a resonance recombination process on the surface. In higher field the recombination rate rapidly becomes smaller. Our results indicate that at fields above the resonant region (roughly T) the recombination cross lengths may become sufficiently rather small to make adsorbed D nearly as stable as adsorbed H. Hence one might hope that the interesting configuration of a degenerate, two-dimensional Fermi gas on the surface of a Bose liquid is attainable in this way.
We are grateful to Pavel Bushev, Tycho Sonnemans, and Jook Walraven for fruitful discussions and comments. This research is supported by the Stichting Fundamenteel Onderzoek van der Materie (FOM).
REFERENCES
- [1] M.H. Anderson, J.R. Ensher, M.R. Matthews, C.E. Wieman, and E.A. Cornell, Science 269, 198 (1995).
- [2] K.B. Davis, M.-O. Mewes, M. Andrews, N.J. van Druten, D.S. Durfee, D.M. Kurn, and W. Ketterle, Phys. Rev. Lett. 75, 3969 (1995).
- [3] B. DeMarco and D.S. Jin, Science 285 1703 (1999)
- [4] D.G. Fried, T.C. Killian, L. Willmann, D. Landhuis, S.C. Moss, D. Kleppner, and T.J. Greytak. Phys. Rev. Lett. 81, 3811 (1998).
- [5] A.I. Safonov, S.A. Vasilyev, I.S. Yasnikov, I.I. Lukashevich, and S. Jaakkola, Phys. Rev. Lett. 81, 4545 (1998).
- [6] A.P. Mosk. M.W. Reynolds, T.W. Hijmans, and J.T.M. Walraven, Phys. Rev. Lett 81, 4440 (1998).
- [7] I.F. Silvera and J.T.M. Walraven, Phys. Rev. Lett. 45, 1268 (1980).
- [8] I.F. Silvera and J.T.M. Walraven, Spin Polarized Atomic Hydrogen, in Progress in Low Temperature Physics, edited by D.F. Brewer, 10 139, (Elsevier, Amsterdam 1986).
- [9] I. Shinkoda, M.W. Reynolds, R.W. Cline and W.N. Hardy, Phys. Rev. Lett. 57, 1243 (1986).
- [10] T. Arai, M. Yamane, A. Fukuda, and T. Mizusaki, J. Low Temp. Phys. 112, 373 (1998).
- [11] M.W. Reynolds, M.E. Hayden, and W.N. Hardy, p.236, in Spin Polarized Quantum Systems, edited by S. Stringari (World Scientific, 1989).
- [12] O.J. Luiten, H.G.C. Werij, I.D. Setija, M.W. Reynolds, T.W. Hijmans, and J.T.M. Walraven, Phys. Rev. Lett. 70, 544 (1993).