Onset Temperature of Slow Dynamics in Glass Forming Liquids
Abstract
The behaviour of a model glass forming liquid is analyzed for a range of densities, with a focus on the temperature interval where the liquid begins to display non-Arrhenius temperature dependence of relaxation times. Analyzing the dynamics along with properties of local potential energy minima sampled by the liquid, a crossover or onset temperature is identified below which the liquid manifests slow dynamics, and a change in the character of typical local potential energy minima.
pacs:
PACS numbers:64.70.Pf, 64.60.My, 64.90.+b,61.20.Lc,63.50.+xThe phenomenology of glass formation, whereby a liquid cooled to low temperatures manifests increasingly sluggish dynamics, and at low enough temperature transforms into an amorphous solid, has come under increasing study in recent years[2, 3]. In addition to the glass transition temperature where the liquid transforms to a glass in the laboratory, much attention has been devoted to the Kauzmann or ideal glass transition temperature [4, 5, 6, 7, 8, 9, 10], which locates a putative thermodynamic phase transition underlying the observed glass transition, and the mode coupling critical temperature [11, 12, 13], which is now commonly viewed as marking the crossover to a regime of ‘activated dynamics’ discussed long ago by Goldstein[14]. Relatively less attention has been paid to the range of temperatures (or equivalently, a crossover temperature) where the nature of the dynamics changes from what may be termed as ‘normal’ to what is commonly referred to as ‘slow dynamics’[15, 16, 17]. The purpose of this letter is to demonstrate, on the basis of computer simultions of a model liquid, that such a crossover temperature can be identified by various indicators that mark a change in the nature of local potential energy minima the liquid samples, in addition to changes in the dynamics itself.
Results presented here are from molecular dynamics simulations of a model liquid which is a binary mixture consisting of type and type particles. The particles interact via the Lennard-Jones (LJ) potential, with parameters , , , and , and . This system has been extensively studied as a model glass former[12, 18, 15, 7, 9, 19]. The LJ potential is modified with a quadratic cutoff and shifting at [20]. All quantities are reported in reduced units, length in units of , volume in units of (density , where is the number of particles, in units of ), temperature in units of , energy in units of and time in units of , where is the mass of the particles. Molecular dynamics simulations are performed over a wide range of temperatures at each density, and local energy minimizations are performed for () or () configurations to obtain typical local energy minima or ‘inherent structures’[21] sampled by the liquid. Inherent structures are obtained for a subset of temperatures at intervals that vary between to near the crossover , which thus limit the precision of estimation, in addition to the inherent lack of sharp definition of a crossover temperature. Further details concerning the simulations may be found in [19], where a study of the dynamics and thermodynamics of this model was reported over a wide range of densities and temperatures.
Data from these simulations are analyzed here for five densities to study the crossover temperature where the liquid begins to manifest slow dynamics. The dynamics is probed by calculating the self intermediate scattering function for the particles, which is the Fourier transform at wavevector of the van Hove self correlation function
| (1) |
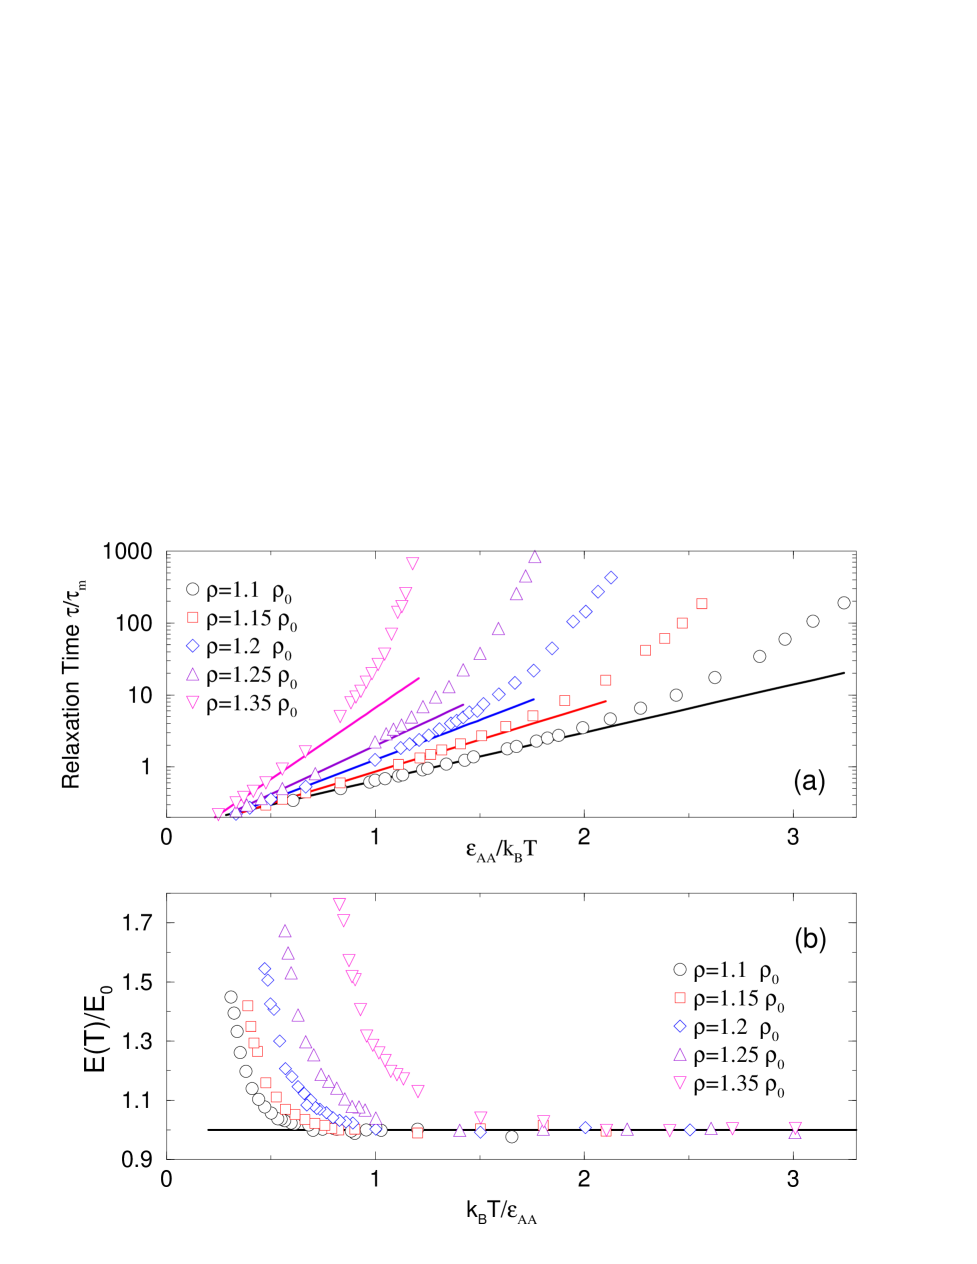
which describes the probability of finding at time a particle at distance from its location at . At each density, the wavevector studied is close to the first peak of the structure factor. Relaxation times are obtained as a function of temperature , at each density, from with the definition, . At high , display Arrhenius behavior (i. e., where and are constants) as shown in Fig. 1(a). Deviations from Arrhenius behavior can be seen clearly by defining a -dependent ‘activation energy’
| (2) |
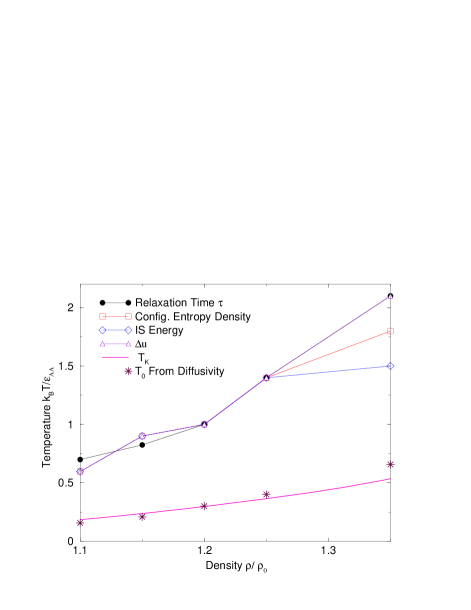
which has the constant value for where the Arrhenius form is valid. High values of are used to estimate and which are then used to transform the full data set, following the procedure in [15]. The resulting data (normalized to ) are shown in in Fig. 1(b), which display for all densities the crossover to non-Arrhenius behavior, similar to the finding in [15] for . The crossover identified this way are shown in Fig. 2. Also shown are the ideal glass transition line (‘’; from [19]) and the VFT temperature obtained from diffusivity data in [19]. The mode coupling temperatures have not been estimated as a function of density in this study, but will be presented in a future article. At , the value of estimated in [12] is , while from the present study, and . Therefore, the mode coupling at this density is less than half the onset temperature , and higher than the ideal glass transition temperature by roughly .
Properties of potential energy minima sampled by the liquid show a corresponding crossover behavior, which is now discussed. A number of recent studies[22, 7, 8, 9, 23, 24, 10, 19, 25] have focussed on analyzing the thermodynamics of glass forming liquids on the basis of a decomposition of the configurational space of the liquid into basins, as a route to estimating the configurational entropy, which is given by the multiplicity of such basins. In the inherent structure approach[21], basins are identified as basins of the local potential energy minima (inherent structures), which permits the partition function to be written as (details may be found in [7, 8, 19])
| (3) |
where is the potential energy per particle of the inherent structure, is the number of inherent structures in the range (), is given by the restricted partition function integral over the basin of an inherent structure of energy . The configurational entropy density is defined as and is related to the dependent configurational entropy by . The probability of sampling an inherent structure of energy is given by
| (4) |
The distribution of inherent structures sampled is calculated directly from simulations, by performing local energy minimizations for a sample of equilibrated configurations. In addition, the total free energy of the system (and hence ) is calculated from thermodynamic integration as outlined in [19]. Knowledge of the basin free energy is then sufficient to invert the above relationship to obtain the configurational entropy density . One must obtain the same estimates of from at different temperatures, in the range of values where the corresponding overlap. In previous work[7, 8, 25] it has been observed that one indeed obtains overlapping estimates from different temperatures at sufficiently low temperatures. Results in these analyses was based on evaluating the basin free energy with a harmonic approximation, wherein the basin free energy is given in terms of the frequencies which are related to the eigenvalues of the Hessian matrix (matrix of second derivatives of the potential, defined at the energy minima) by . The basin free energy is given in this approximation by:
| (5) |
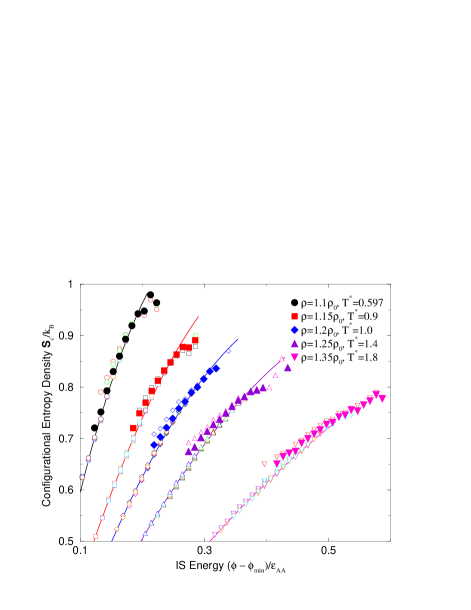
The eigenvalues are obtained numerically for the sample of inherent structures obtained at each temperature and density. Estimates of from different temperatures for each density are shown in Fig. 3. It is seen that at each density, the estimates from low temperatures overlap with each other, but estimates from higher temperatures fail to do so (each is not, however, individually labeled in the figure). The harmonic approximation for describing the properties of basins therefore fails at high temperatures, indicating a qualitative change in the nature of the basins sampled at temperatures below and above a crossover temperature. The crossover temperatures estimated in this fashion are shown in Fig. 2. The criterion used here, as well as in Fig. 4, 5, is stated in the figure caption.
It has been observed[8, 26, 25] that distribution of inherent structures is well described by a Gaussian (equivalently, the configurational entropy density by an inverted parabola). Figure 3 shows fits to at each density of the form,
| (6) |
The parameters , and depend on the density but not on the temperature . Based on the assumption of a Gaussian and a constant (with respect to ) in Eq. (3) it has been observed[26, 8] that the average inherent structure energy should vary with temperature as . However, the dependent component of (arising from the dependence of the frequencies on the basin occupied, indexed by its energy) is not constant but varies roughly linearly with [28] (see also [29, 30]). Hence, the form
| (7) |
where has no dependence, is employed to describe the and dependence of . Inclusion of this dependence does not alter the prediction of the dependence but redefines the quantitative expression to
| (8) |
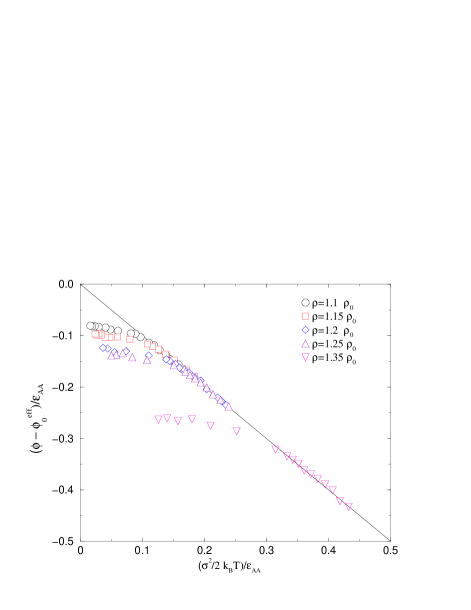
where the effective mean IS energy . It has been shown elsewhere[28] that Eq. (8) indeed describes well the average inherent structure energies, at low temperatures, calculated directly from simulations. However, at high temperatures, one observes deviations from the behavior (see also [25]). A scaled plot of vs. is shown in Fig. 4. In order to identify the crossover temperature as accurately as possible, the fit parameters involved, , , and have been estimated by fitting jointly the low temperature data sets of (Eq.(6)), (Eq.(7)) and (Eq.(8)). The fit parameters are shown in Table I. Crossover temperatures where exhibits deviations from the form are shown in Fig. 2. The analysis here makes more precise, and quantitative, the observation in [15] of a correlation between the onset of non-Arrhenius relaxation and a change from nearly constant to dependent values of the average inherent structure energies.
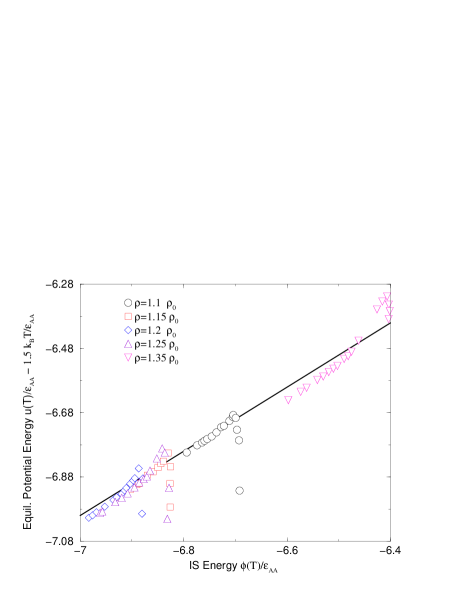
When inherent structure basins sampled by the liquid are well described by a harmonic approximation, one must expect that the potential energy per particle of the equilibrated liquid is related to the inherent structure energy by . Thus significant differences between the quantity and also indicate anharmonicity of the basins sampled[31, 25]. Fig. 5 shows plotted against for each of the studied densities. The range of inherent structure energies sampled is non-monotonic in density, with the lowest energies obtained at . For each density, there is a low energy range for which the harmonic expectation (indicated by the solid line) is met to a good extent (the deviations from the harmonic expectation in this range is less than in all cases). At higher energies, it is seen that a fairly sharply defined energy (or temperature) exists where the two quantities deviate significantly. Such deviation permits the identification of a crossover temperature. The crossover temperatures so obtained are plotted in Fig. 2.
Comparison of the various crossover temperatures in Fig. 2 identified from characterizing the dynamics (Fig. 1) and the inherent structures sampled (Fig.s 3, 4, 5) show that the crossover from ‘normal’ to ‘slow’ dynamics is associated with a change in the nature of local potential energy minima the liquid samples. The crossover is particularly broad for which correspondingly shows the poorest agreement between different estimates. The correspondence of changes in IS properties with liquid structure was studied in [17], and more recently in [30] for water. Some analysis of this crossover has been made for spinglass models, e. g. [24, 32]. In [24] it is shown that finite range spin glass models show behavior of average energies of local minima which are similar to liquids. Similar findings for the nearest neighbor spinglass model have been reported in [32]. Analysis of the free energy landscape for the hard sphere fluid[33] identify a crossover density where glassy free energy minima come into existence, which may be related to the crossover discussed here. Frustration limited domain theory[16] discusses an avoided critical point temperature, which has been identified with the crossover temperature discussed here.
Nevertheless, the precise nature of the crossover is at present unclear. Although Fig.s 3–5 indicate a change from ‘harmonic’ basins at low temperature to those that are anharmonic at above the crossover , detailed analyses[34, 31, 35] indicate that at temperatures between mode coupling and the crossover temperature , the dynamics appears via motion along directions in configuration space with negligible energy barriers, the barriers being instead entropic[33]. Therefore, even though the dynamics in the range of to is ‘landscape influenced’[15] it is ‘landscape dominated’ only below [14]. Notwithstanding the quantitative measures presented here, the precise sense in which the harmonicity of local minima changes across is unclear. Very little theoretical effort has been directed at understanding the nature of the crossover at . Results presented here, along with related evidence cited, call for a focus on phenomena pertaining to the onset temperature of slow dynamics, in addition to more thoroughly studied phenomena at lower temperatures.
1.10 1.020 -6.579 0.312 0.616 1.15 0.963 -6.680 0.379 0.603 1.20 0.921 -6.700 0.470 0.455 1.25 0.875 -6.642 0.550 0.350 1.35 0.860 -6.080 0.870 0.159
TABLE I: Fit parameters quantifying the distribution of inherent structures, and the dependence of vibrational free energy on the inherent structure energy, described in Eq.s (Eq.(6)) and (Eq.(7)).
REFERENCES
- [1] Email: sastry@jncasr.ac.in
- [2] Some recent reviews are articles in Science 267, (1995) and M. D. Ediger, C. A. Angell and S. R. Nagel, Supercooled Liquids and Glasses. J. Phys. Chem. 100, 13200 (1996).
- [3] Proceedings of Unifying Concepts in Glass Physics, Trieste, 1999, J. Phys. Cond. Mat. 12 (2000).
- [4] J.H. Gibbs and E. A. Di Marzio J. Chem. Phys. 28, 373 (1958).
- [5] G. Adam and J.H. Gibbs J. Chem. Phys. 43, 139 (1958).
- [6] T.R. Kirkpatrick, D. Thirumalai, Phys. Rev. B, 36, 5388 (1987); T.R. Kirkpatrick, P. G. Wolynes, Phys. Rev. B, 36, 8552 (1987); T.R. Kirkpatrick, D. Thirumalai, and P. G. Wolynes Phys. Rev. A, 40, 1045 (1989).
- [7] F. Sciortino, W. Kob and P. Tartaglia, Phys. Rev. Lett. 83, 3214 (1999).
- [8] S. Buechner and A. Heuer, Phys. Rev. E 60, 6507 (1999); Phys. Rev. Lett. 84, 2168 (2000).
- [9] B. Coluzzi, G. Parisi and P. Verrocchio, J. Chem. Phys. 112 2933 (2000); B. Coluzzi, G. Parisi and P. Verrocchio, Phys. Rev. Lett. 84, 306 (2000); B. Coluzzi, M. Mezard, G. Parisi and P. Verrocchio, J. Chem. Phys. 111, 9039 (1999); M. Mezard and G. Parisi, Phys. Rev. Lett. 82, 747 (1999).
- [10] A. Scala, F. W. Starr, E. La Nave, F. Sciortino and H. E. Stanley, Nature 406, 166 (2000).
- [11] W. Götze and L. Sjögren, Rep. Prog. Phys. 55, 241 (1992); U. Bengtzelius, W. Götze, and A. Sjölander, J. Phys. C 17, 5915 (1984); E. Leutheusser, Phys. Rev. A 29, 2765 (1984).
- [12] W. Kob and H. C. Andersen, Phys. Rev. E 51, 4626 (1995); K. Vollmayr, W. Kob and K. Binder J. Chem. Phys. 105, 4714 (1996).
- [13] P. Gallo, F. Sciortino, P. Tartaglia, and S.-H. Chen Phys. Rev. Letts 76, 2730 (1996); L. Fabbian, A. Latz, R. Schilling, F. Sciortino, P. Tartaglia, and C. Theis Phys. Rev. E. 60, 5768 (1999).
- [14] M. Goldstein, J. Chem. Phys. 51, 3728 (1969).
- [15] S. Sastry, P. G. Debenedetti and F.H. Stillinger, Nature 393, 554 (1998).
- [16] S. A. Kivelson, D. Kivelson, X. Zhao, Z. Nussinov, and G. Tarjus, Physica A 219, 27 (1995); G. Tarjus, D. Kivelson and P. Viot, J. Phys. Cond. Mat. 12, 6497 (2000).
- [17] H. Jonsson and H. C. Andersen Phys. Rev. Lett. 60, 2295 (1988).
- [18] W. Kob, C. Donati, S. J. Plimpton, P. H. Poole and S. C. Glotzer, Phys. Rev. Lett. 79, 2827 (1997).
- [19] S. Sastry, Phys. Rev. Lett. 85 590 (2000).
- [20] S. D. Stoddard and J. Ford, Phys. Rev. A 8, 1504 (1973).
- [21] F.H. Stillinger and T.A. Weber, Phys. Rev. A 25, 978 (1982); Science 225, 983 (1984); F.H. Stillinger, Science 267, 1935 (1995).
- [22] R. J. Speedy, Mol. Phys. 80 1105 (1993); R. J. Speedy and P. G. Debenedetti, it Mol. Phys. 81 237 (1994);R. J. Speedy and P. G. Debenedetti, it Mol. Phys. 88 1293 (1996); R. J. Speedy, Mol. Phys. 95 169 (1998).
- [23] L. Angelani, G. Parisi, G. Ruocco and G. Viliani, Phys. Rev. Lett. 81 4648 (1998).
- [24] A. Crisanti and F. Ritort, Europhysics Lett. 51, 147 (2000).
- [25] S. Sastry, J. Phys. Cond. Mat. 12, 6515 (2000).
- [26] R. J. Speedy, J. Phys. Chem. B 103, 4060 (1999).
- [27] A. Heuer and S. Buechner, J. Phys. Cond. Mat. 12, 6535–6543 (2000).
- [28] S. Sastry, Nature (in press)/http://arXiv.org/abs/cond-mat/0011317.
- [29] F. Sciortino and P. Tartaglia, http://arXiv.org/abs/cond-mat/0007208.
- [30] F. W. Starr, S. Sastry, F. Sciortino, H. E. Stanley, Phys. Rev. E (in press)/http://arXiv.org/abs/cond-mat/0001296; F. W. Starr, S. Sastry, E. La Nave, A. Scala, H. E. Stanley, F. Sciortino, Phys. Rev. E (in press)/http://arXiv.org/abs/cond-mat/0007487.
- [31] K. Broderix, K. K. Batthacharya, A. Cavagna, A. Zippelius and I. Giardina, http://arXiv.org/abs/cond-mat/0007258.
- [32] S. C Glotzer, N. Jan and P. H. Poole, J. Phys. Cond. Mat. 12, 6675 (2000).
- [33] C. Dasgupta and O. T. Valls, J. Phys. Cond. Mat. 12, 6553 (2000).
- [34] T. B. Schröder, S. Sastry, J. Dyre and S. C. Glotzer, J. Chem. Phys 112, 9834 (2000).
- [35] L. Angelani, R. Di Leonardo, G. Guocco, A. Scala, F. Sciortino, http://arXiv.org/abs/cond-mat/0007241.