Fermi surface of Sr2RuO4 from angle resolved photoemission
Abstract
We investigated the low-energy electronic structure of Sr2RuO4 by angle-resolved photoemission spectroscopy (ARPES) focusing, in particular, on the controversial issues of the Fermi surface (FS) topology and of the extended van Hove singularity (evHs). A detailed study of temperature and photon energy dependence demonstrates the surface-state nature of the electronic band responsible for the evHs, and may suggest the presence of ferromagnetic correlations at the surface. In addition, we detected a replica of the primary FS that indicates a surface reconstruction, as confirmed by LEED. In light of these findings, the FS determined by ARPES is consistent with LDA and de Haas-van Alphen (dHvA) results, and it provides additional information on the detailed shape of the , and sheets. Also, at this stage, because of the strong sensitivity of the cleaved surface, we could not find any robust signature of the crossover from 2D to 3D Fermi liquid behavior in our ARPES measurements for K.
keywords:
Sr2RuO4; Photoemission; ARPES; Fermi surface; Electronic structure,
The determination of the Fermi surface topology of Sr2RuO4, by ARPES has been matter of intense debate. The resolution of this controversy is important not only for the physics of Sr2RuO4 per se, but also as a reliability test for FSs determined by ARPES, especially on those correlated systems where photoemission is the only available probe. In this context, Sr2RuO4 is a particularly interesting material because it can also be investigated with dHvA experiments, contrary to the cuprates, thus providing a direct test for the ARPES results. Whereas dHvA analysis [1], in agreement with LDA band-structure calculations [2, 3], indicates two electron pockets , and centered at the point, and a hole pocket at the X point [as sketched in 1/4 of the projected zone (PZ) in Fig.1], early ARPES measurements suggested a different picture: one electronlike FS () at the point and two hole pockets (, and ) at the X point [4, 5]. The difference comes from the detection by ARPES of an intense, weakly dispersive feature at the M point just below , that was interpreted as an evHs singularity pushed down below by electron-electron correlations [4, 5]. The existence of the evHs was questioned in a later photoemission paper [6], in which the feature detected at the M point was suggested to be a surface state (SS). Very recently [7], it has been proposed that ARPES could be probing ferromagnetic correlations of the surface, which would result in two -FS with different topology (hole and electronlike, respectively, for majority and minority spin direction).
We investigated in detail the electronic structure of Sr2RuO4. By varying the incident photon energy and the temperature at which the samples were cleaved, we confirm the SS nature of the near- peak detected at the M point, and we identify an additional dispersive feature related to the ‘missing’ electronlike FS (). Full understanding of the data can be achieved only by recognizing the presence of shadow bands (SB), due to a surface reconstruction (as confirmed by LEED). The FS thus determined by ARPES is consistent with the dHvA results [1]. A detailed temperature dependent analysis is complicated by the strong sensitivity of the surface: the latter rapidly degrades upon increasing temperature. At this stage, we could not find in our ARPES spectra any reliable signature of the crossover from 2D to 3D Fermi liquid behavior, reported for K [8, 9].
High energy (14 meV) and angular () resolution ARPES data was taken at SSRL, on the normal incidence monochromator beam line equipped with a SES-200 electron analyzer. Sr2RuO4 single crystals were oriented by conventional Laue diffraction, and then cleaved in situ with a base pressure better than 5x10-11 torr. More details on the experiment and on the normalization methods can be found in Ref. [10].
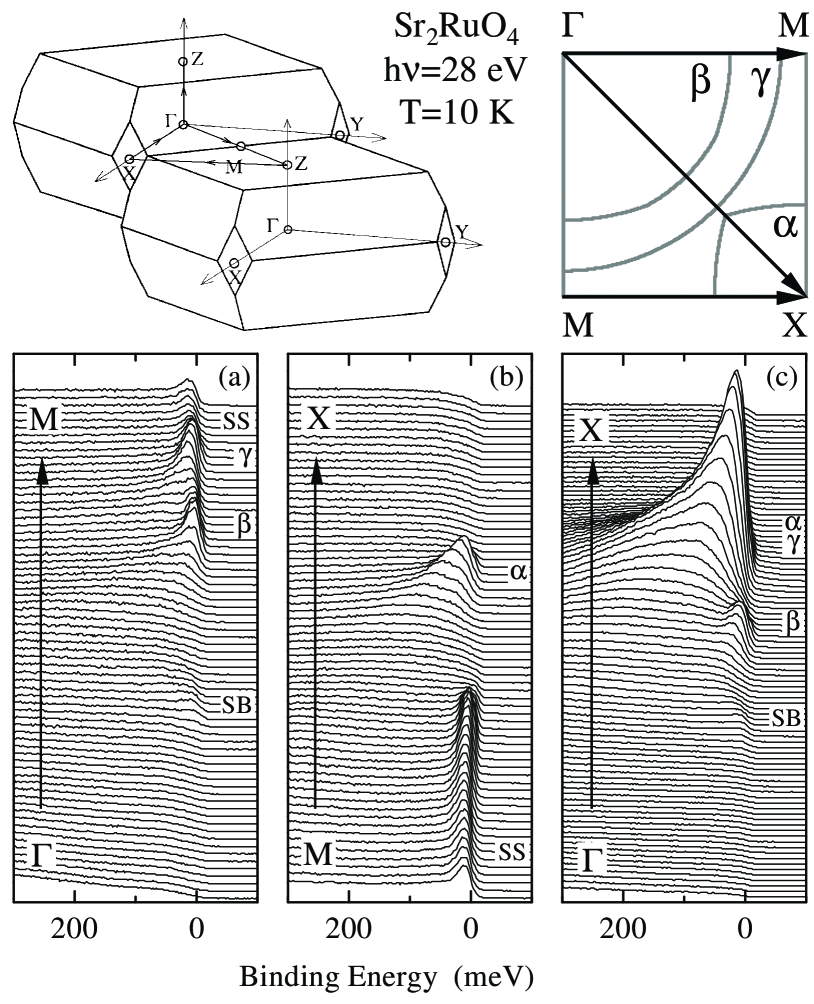
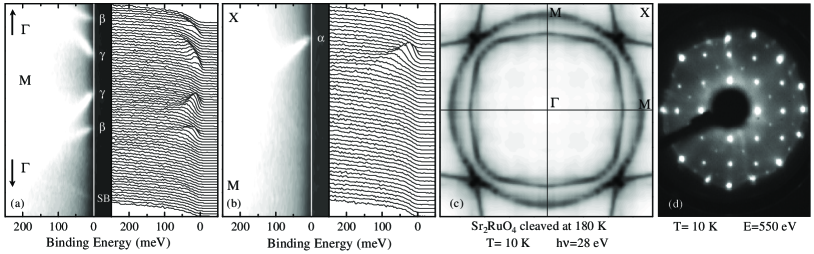
Fig.1 presents, for Sr2RuO4 cleaved and measured at 10 K, energy distribution curves (EDCs) along the high-symmetry directions (all detected features are labeled following the assignment given in the paper). Along -M, two peaks emerge from the background, disperse towards , and cross it before the M point, defining and electronlike pockets (Fig.1a). Along M-X, a peak approaches and crosses before the X point defining, in this case, the hole pocket centered at X (Fig.1b). Similar results were obtained along -X (Fig.1c): the pocket is clearly resolved, while and crossings are almost coincident. In addition, we identify a weak feature that shows dispersion opposite to the primary peaks along -M and -X (SB, see below). Around the M point, we can observe the sharp peak (SS) that was initially associated to a holelike sheet of FS centered at X [4, 5].
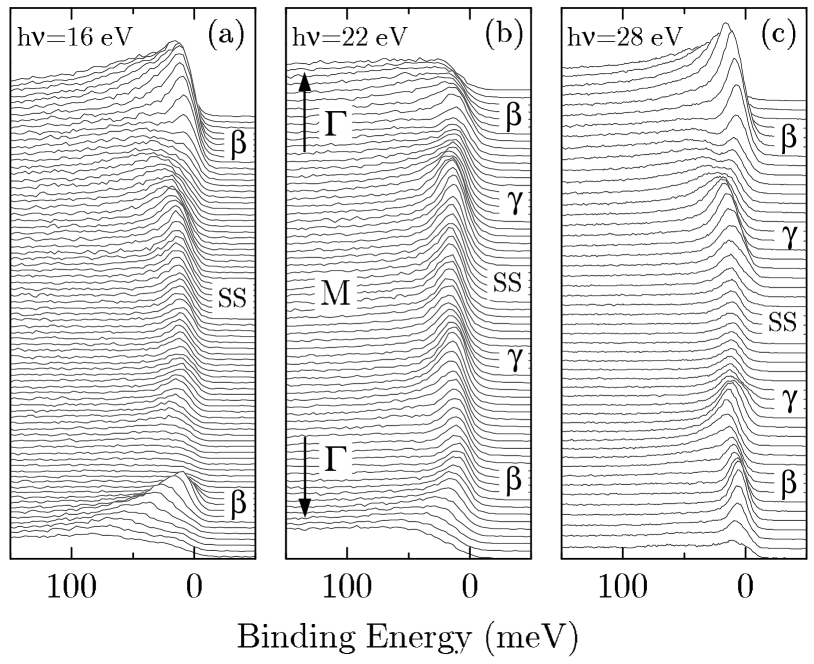
In the following discussion, we will concentrate on the features observed near the M point, which are relevant to the controversy concerning the character of the sheet of FS. In particular, we will show that working with sufficient momentum resolution, both the and electronlike pockets (predicted by LDA calculations [2, 3]) are clearly resolved in the ARPES spectra. In order to address this issue, we measured the M point region (with cuts along -M-) varying the incident photon energy between 16 and 29 eV, in steps of 1 eV. Here, we covered the location of and pockets in both first and second zone (i.e., four crossings ought to be observed). From the EDCs shown in Fig.2 for 16, 22, and 28 eV, we can see that the cross sections of SS, and in particular exhibit a strong (and different) dependence on photon energy. At 28 eV, and crossings can be individually identified in the EDCs. Owing to the high momentum resolution we can now follow the dispersion of the peaks until the leading edge midpoints are located beyond . After that, the peaks lose weight and disappear, defining the vectors for the electronlike pockets. Right at we can resolve a double structure which then reduces to the non dispersive feature (SS) located 11 meV below . The difference between the 28 eV results and those obtained at 16 or 22 eV is striking. At low photon energies, the crossings are still clearly visible. On the other hand, we can follow only the initial dispersion of the peaks, before they merge with the SS feature, giving the impression of an evHs. At 16 eV it is impossible to identify the crossings. At 22 eV the location of the leading edge midpoints is at best suggestive of the presence of the crossings.
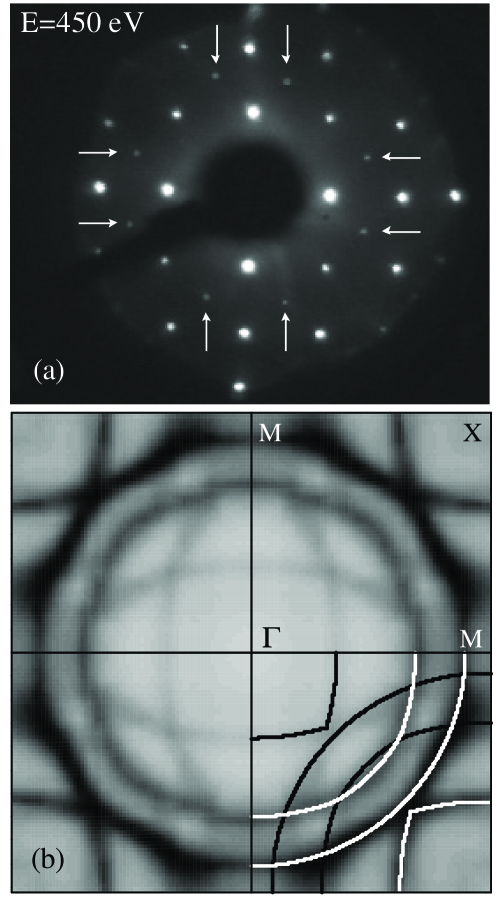
In order to have a full picture of the relevant issues to be addressed, let us proceed to the discussion of the FS mapping obtained by integrating the EDCs over a narrow energy window about . As the electron spectral function, multiplied by the Fermi function, reaches its maximum at when a band crosses the Fermi energy, the FS is identified by the local maxima of the intensity map. Fig.3b shows the intensity map obtained at 28 eV on a Sr2RuO4 single crystal cleaved and measured at 10 K. The actual EDCs were taken over more than a full quadrant of the PZ with a resolution of 0.3∘ (1∘) in the horizontal (vertical) direction. EDCs were then integrated over an energy window of meV about the chemical potential. The resulting map was then symmetrized with respect to the diagonal -X (to compensate for the different resolutions along horizontal and vertical directions). The , , and sheets of FS are clearly resolved, and are marked by white lines in Fig.3b. In addition, Fig.3b shows some unexpected features: besides the diffuse intensity around the M point due to the presence of the SS band, there are weak but yet well defined profiles (marked in black). They can be recognized as a replica of the primary FS, and are related to the weak SB features detected in the EDCs along the high-symmetry lines (Fig.1a and 1c). This result is reminiscent of the situation found in Bi2Sr2CaCu2O8 where similar shadow bands are possibly related to AF correlations, or to the presence of two formula units in the unit cell. On the other hand, in Sr2RuO4 the origin of the SB is completely different: inspection with LEED reveals superlattice reflections corresponding to a surface reconstruction (see Fig.3a), which is responsible for the folding of the primary electronic structure with respect to the M-M direction. Quantitative LEED analysis of the surface structure shows a 9∘ rotation of the RuO6 octahedra around the surface normal, which leads to the enlargement of the in-plane unit-cell dimensions by over that of the bulk [11]. This reconstruction, which is absent in the cuprates, reveals an intrinsic instability of the cleaved surface of Sr2RuO4, and should be taken into account as the origin of possible artifacts also in other surface sensitive measurements like, e.g., scanning tunneling microscopy.
By inspecting the M point (Fig.3b), it becomes now clear why the investigation of this k-space region with ARPES has been so controversial: in addition to the weakly dispersive SS feature (Fig.1 and 2), there are several sheets of FS (primary and ‘folded’). At this point, the obvious question is: what is the exact nature of the SS feature? In order to verify that this feature indeed arises from a surface state [6], we investigated its sensitivity to surface degradation by cycling the temperature between 10 and 200 K.
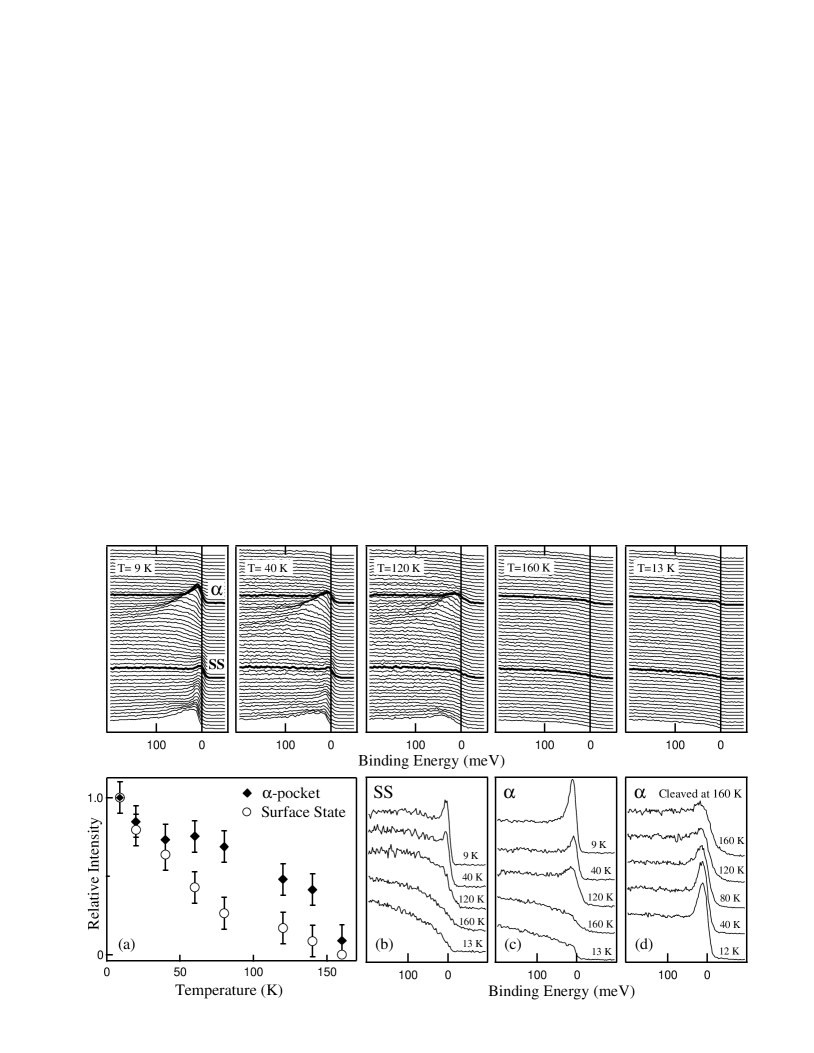
In Fig. 4 (top panels), where EDCs measured along M-X are presented, we can observe both -pocket and SS peaks. Upon increasing the temperature from 9 to 160 K, both peaks show a large and monotonic decrease of spectral weight and eventually disappear [an enlarged view of the EDCs for SS and pocket, at the positions marked by thick lines in the top panels, is given in Fig. 4b and 4c, respectively]. At this point one may wonder whether this is an intrinsic effect reflecting the 2D-3D crossover reported for K [8, 9]. In that case the intensity of the peaks should once again increase upon reducing the temperature. Unfortunately this check shows that the observed effect is irreversible and only reflects the reactivity of the surface of Sr2RuO4: EDCs re-taken at 13 K are completely featureless, indicating the complete degradation of the surface (see Fig. 4, top right panel). Furthermore these results, as emphasized by the relative peak intensity of SS and pocket plotted versus temperature in Fig. 4a (data normalized at 9 K), show the higher sensitivity of the SS to surface degradation and, therefore, demonstrate the surface state nature of this feature. In order to gain more insights on the issue of the 2D-3D crossover, we repeated the experiment upon decreasing the temperature, on a sample cleaved at 160 K (Fig. 4d presents EDCs relative to the -pocket). The data shows a considerable temperature dependence which, however, seems to be mostly due to the thermal broadening of the Fermi function, although additional effects can not be fully excluded at this stage. As a peak is clearly present already at 160 K (i.e., well above the 2D-3D crossover temperature of 130 K), it seems a fair statement to say that no strong effect due to the crossover is detected in the ARPES spectra.
Because the SS peak is suppressed much faster than all other features, by cleaving the crystals at 180 K and immediately cooling to 10 K, we suppressed the SS, while only weakly affecting the intensity of the other electronic states. A more sizable effect is observed on the SB, confirming a certain degree of surface degradation. However, the latter was not too severe, as demonstrated by the LEED pattern taken after the measurements which still clearly shows the surface reconstruction (Fig.5d). EDCs measured near the M-point at 10 K (on a sample cleaved at 180 K), and corresponding intensity plots are shown in Fig.5a and 5b. No clear signature of the SS is detected, and the identification of the Fermi vectors of , , and pockets is now straightforward.
Performing a complete mapping on a sample cleaved at 180 K, we obtained an extremely well defined FS (Fig.5c). With the surface slightly degraded, we expect to see less of the relative intensity coming from SB and SS. At the same time, we might have expected the primary FS to be less well defined, which is precisely opposite to what is observed. The FS shown in Fig.5c is in very good agreement with LDA calculations [2, 3] and dHvA experiments [1]. The number of electrons contained in the FS adds up to a total of 4 (within an accuracy of 1%), in accordance with the Luttinger theorem (for the FS determined on samples cleaved at 10 K the accuracy in the electron counting reduces to 3% due to the additional intensity of folded bands and surface state).
Our results confirm the surface state nature of the SS peak detected at the M point. The comparison of Figs.3b and 5c suggests that a surface contribution to the total intensity is responsible also for the less well defined FS observed on samples cleaved at 10 K. At this point, one might speculate that these findings are a signature of the surface ferromagnetism (FM) recently proposed for Sr2RuO4 [7]. In this case, two different FSs should be expected for minority and majority spin directions [7], resulting in: (i) additional -weight near M due to the presence of a holelike pocket for the majority spin; (ii) overall momentum broadening of the FS contours because the , and sheets for the two spin populations are slightly displaced from each other in the rest of the BZ. In this scenario, a slight degradation of the surface might suppress the signal related to FM correlations, due to the introduced disorder. The resulting FS would then be representative of the non-magnetic electronic structure of the bulk (Fig.5c). The hypothesis of a FM surface seems plausible because the instability of a non magnetic surface against FM order is not only indicated by ab initio calculations [7], but it may also be related to the lattice instability evidenced by the surface reconstruction.
In summary, our investigation provides direct evidence for the surface state nature of the weakly dispersive feature detected at the M point (a possible fingerprint of a FM surface). From both ARPES and LEED, we found that a surface reconstruction occurs in cleaved Sr2RuO4, resulting in the folding of the primary electronic structure. Taking these findings into account, the FS determined by ARPES is consistent with dHvA results, providing additional information on the detailed shape of , and pockets. No clear evidence was found in favor of a crossover from 2D to 3D Fermi liquid behavior for .
We gratefully acknowledge C. Bergemann, M. Braden, Ismail, and T. Mizokawa for useful discussions. SSRL is operated by the DOE office of Basic Energy Research, Division of Chemical Sciences. The office’s division of Material Science provided support for this research. The Stanford work is also supported by NSF grant DMR9705210 and ONR grant N00014-98-1-0195.
References
- [1] A.P. Mackenzie, S.R. Julian, A.J. Diver, G.J. McMullan, M.P. Ray, G.G. Lonzarich, Y. Maeno, S. Nishizaki, and T. Fujita , Phys. Rev. Lett. 76 (1996) 3786.
- [2] T. Oguchi, Phys. Rev. B 51 (1995) 1385.
- [3] D.J. Singh, Phys. Rev. B 52 (1995) 1358.
- [4] D.H. Lu, M. Schmidt, T.R. Cummins, S. Schuppler, F. Lichtenberg, and J.G. Bednorz , Phys. Rev. Lett. 76 (1996) 4845.
- [5] T. Yokoya, A. Chainani, and T. Takahashi, H. Ding, J.C. Campuzano, H. Katayama-Yoshida, M. Kasai, and Y. Tokura , Phys. Rev. B 54 (1996) 13311.
- [6] A.V. Puchkov, Z.-X. Shen, T. Kimura, and Y. Tokura, Phys. Rev. B 58 (1998) R13 322.
- [7] P.K. de Boer, and R.A. de Groot, Phys. Rev. B 59 (1999) 9894.
- [8] T. Katsufuji, M. Kasai, and Y. Tokura, Phys. Rev. Lett. 76 (1996) 126.
- [9] Y. Maeno, K. Yoshida, H. Hashimoto, S. Nishizaki, S.-I. Ikeda, M. Nohara, T. Fujita, A.P. Mackenzie, N.E. Hussey, J.G. Bednorz, and F. Lichtenberg, J. Phys. Soc. Jpn. 66 (1997) 1405.
- [10] A. Damascelli, D.H. Lu, K.M. Shen, N.P. Armitage, F. Ronning, D.L. Feng, C. Kim, Z.-X. Shen, T. Kimura, Y. Tokura, Z.Q. Mao, and Y. Maeno, Phys. Rev. Lett. 85 (2000) 5194.
- [11] R. Matzdorf, Z. Fang, Ismail, Jiandi Zhang, T. Kimura, Y. Tokura, K. Terakura, and E.W. Plummer, Science 289 (2000) 746.