Towards identifying the world stock market cross-correlations:
DAX versus Dow Jones
Abstract
Effects connected with the world globalization affect also the financial markets. On a way towards quantifying the related characteristics we study the financial empirical correlation matrix of the 60 companies which both the Deutsche Aktienindex (DAX) and the Dow Jones (DJ) industrial average comprised during the years 1990-1999. The time-dependence of the underlying cross-correlations is monitored using a time window of 60 trading days. Our study shows that if the time-zone delays are properly accounted for the two distant markets largely merge into one. This effect is particularly visible during the last few years. It is however the Dow Jones which dictates the trend.
PACS numbers: 01.75.+m Science and society - 05.40.+j Fluctuation phenomena, random processes, and Brownian motion - 89.90.+n Other areas of general interest to physicists
1 Introduction
The fundamental feature of the time-evolution of self-organizing complex dynamical systems, such as financial markets, is a permanent coexistence and competition between noise and collectivity. Noise is ubiquitous and overwhelming, and therefore it seems natural that majority of eigenvalues of the stock market correlation matrix agree very well [1, 2] with the universal predictions of random matrix theory [3]. This perhaps can be traced back to similar characteristics observed already on the level of human’s brain activity [4] Collectivity on the other hand is much more subtle but it is this component which is of principal interest because it accounts for system-specific non-random properties and thus potentially encodes the system’s future states.
In the correlation matrix formalism collectivity can be attributed to deviations from the random matrix predictions. Our related recent study [5] based on both, the Deutsche Aktienindex (DAX) and the Dow Jones (DJ) industrial average point to a nontrivial time-dependence of the resulting correlations. As a rule, the drawdowns are found to be always accompanied by a sizable separation of one strong collective eigenstate of the correlation matrix which, at the same time, reduces the variance of the noise states. The drawups, on the other hand, turn out to be more competitive. In this case the dynamics spreads more uniformly over the eigenstates of the correlation matrix.
All the above mentioned results are based on studies of the single stock markets, in isolation to all the others. An every day experience indicates, however, an increasing role of effects connected with the world globalization, which seems also to affect the financial markets. It is therefore of great interest to quantify the related characteristics. Besides their significance for understanding the mechanism of evolution of the contemporary stock markets they may also be relevant for practical aspects of the theory of optimal portfolios and risk management [6]. On a way towards exploring this issue below we study the cross-correlations between all the stocks comprised by DAX and by Dow Jones. Both include the same number (30) of the companies and in space terms represent two distant and at the same time leading markets in their area. Mixing them up results in 60 companies which determines the size of the correlation matrix to be studied.
2 DAX + DJ correlation matrix
In general for an assets labelled with and represented by the price time-series of length one defines a parallel time-series of normalized returns
| (1) |
where
| (2) |
are unnormalized returns,
| (3) |
is the volatility of and denotes the time lag imposed. For stocks the corresponding time-series of length are then used to form a rectangular matrix . Then, the correlation matrix is defined as
| (4) |
where the tilde denotes the transposed matrix. In our specific case of the two stock markets the matrix is formed from the time-series of both the DAX and the Dow Jones normalised returns. Then the corresponding global correlation matrix can be considered to have the following block structure:
| (5) |
As our previous study shows [5] the dynamics of the stock market correlations shows a very nontrivial time-dependence. In order to detect such effects the preferred time window is to be as small as possible. However, in order not to artificially reduce the rank of the correlation matrix, and thus in order not to introduce any spurious collectivity, needs to be at least equal to . This sets the lowest limit on a time window which can be used to study the time-dependence of correlations. In the present case of incorporating all the stocks traded by DAX and by Dow Jones based on the daily price changes ( trading day) this corresponds to trading days. The total time-interval explored here covers the years 1990-1999.
3 Results
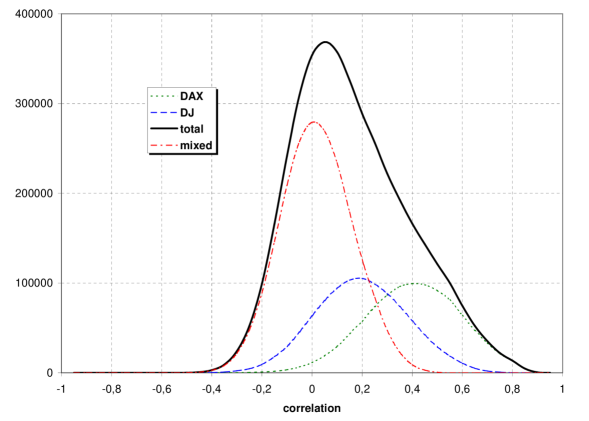
To begin with when inspecting the nature of correlations it is instructive to look at the distribution of matrix elements of . For such a distribution obtained by averaging over all the time windows is displayed by the solid line in Fig. 1. Contrary to the single stock market case it visibly deviates from a pure Gaussian-like shape. Decomposing this distribution into its components originating from the internal correlations between the DAX , the Dow Jones and from the cross-correlations between the two ( and ), explains the global structure. All the individual distributions are Gaussian-shaped but centered at different locations. Consistent with our previous study [5] which points to stronger collectivity effects in DAX relative to Dow Jones the distribution associated with DAX is shifted more to positive values as compared to the Dow Jones. The distribution of matrix elements connecting these two stock markets is centered at a value which is much closer to zero. This can be interpreted in terms of a significantly weaker strength and more random character of such cross-correlations than the ones inside DAX and Dow Jones respectively.
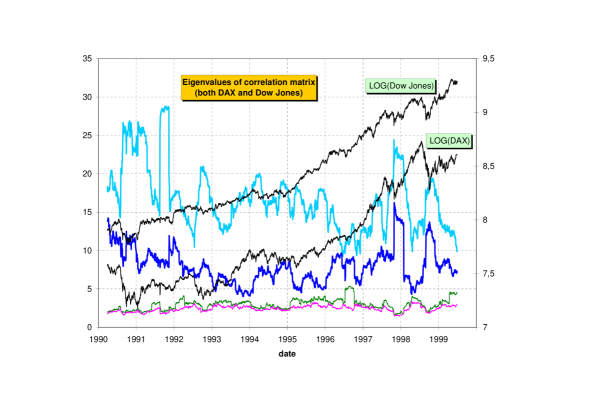
The above observations remain in accord with the following more detailed study in terms of the time-dependence of eigenspectrum of calculated with the time step of one trading day over the time interval of the past 60 trading days. Such a time-dependence of the four largest eigenvalues versus the corresponding two indices (DAX and DJ) is illustrated in Fig. 2. In contrast to a single stock market case where dynamics is typically dominated by one outlying eigenvalue here one can systematically identify the two large eigenvalues. The range of variation of the remaining eigenvalues is on average compatible with the limits prescribed [7] by entirely random correlations:
| (6) |
where and equals to the variance of the time series. In our case both these quantities equal unity which results in .
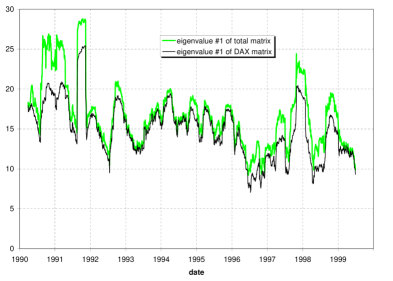
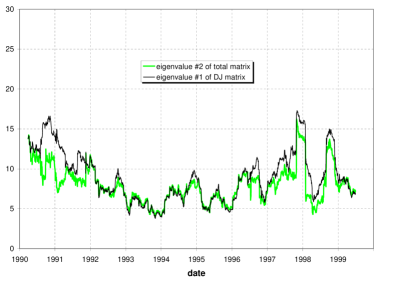
In fact the two largest eigenvalues represent the two stock markets as if they were largely independent. Comparing the time-dependences of the largest eigenvalue of with the largest eigenvalue of and the second largest eigenvalue of with the largest eigenvalue of , as is shown in Fig. 3, clearly points to such a conclusion. In formal terms the structure of eigenspectrum thus indicates that the two submatrices, and , remain largely disconnected and this in fact is compatible with the (not far from zero centered) Gaussian distribution of the connecting matrix elements of and . At the same time however and (similarly as and ) go in parallel as far as their time-dependence is concerned, especially over the last few years. This in turn signals sizable correlations between them which in fact seems natural because the DAX and the Dow Jones increases and decreases respectively display significant correlations in time as can be seen from Fig. 2.
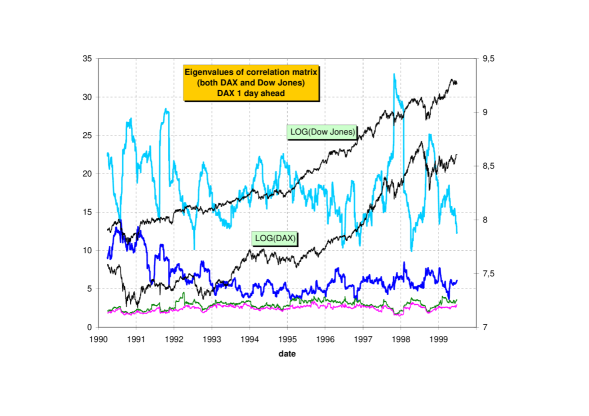
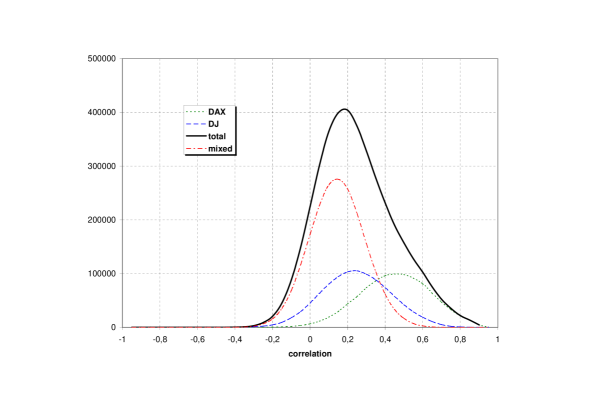
From the technical perspective reconciling these somewhat confliciting conclusions turns out more straightforward than expected and at the same time leads to a new very interesting result. By constructing the correlation matrix from and , i.e., the DAX returns are taken one day advanced relative to the Dow Jones returns, one obtains the eigenspectrum whose structure significantly changes. Its resulting time-dependence is shown in Fig. 4. Now, except for the early 90’s, one large eigenvalue dominates the dynamics which means that a sort of a one common market emerges. Consistently, it also obeys the characteristics observed before [5] for the single markets: as a rule the collectivity of the dynamics is weaker (smaller ) during increases than during decreases. The origin of such a significant change of the eigenspectrum when going from the situation of Fig. 2 to the one of Fig. 4 is of course associated with the matrix elements connecting the two markets. As shown in Fig. 5 their distribution is now more asymmetric relative to zero which leads to an amplified coupling between and .
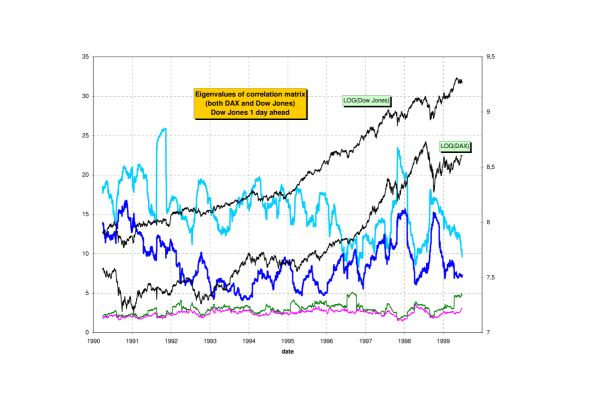
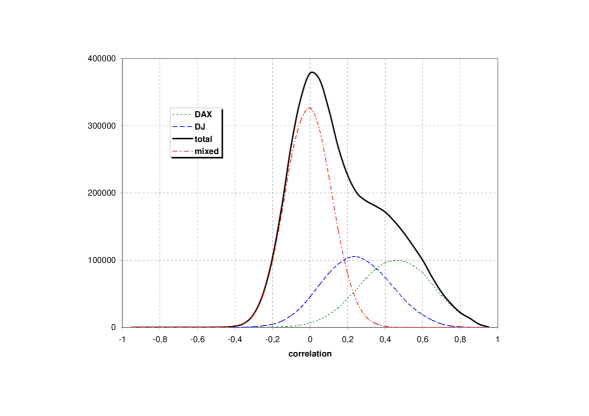
The significance of this result can be appreciated when looking (Fig. 6) at the eigenspectrum of the correlation matrix where time-ordering between DAX and Dow Jones is interchanged, i.e., is built up from and . The reminders of correlations that can still be claimed to be present in the case described by Fig. 2 are now seen to be completely washed out and the two sectors become almost entirely uncorrelated. This fact is also globally expressed by the distribution of the corresponding matrix elements shown in Fig. 7. Those connecting DAX and Dow Jones are now centered basically at zero.
4 Summary
In summary, the present study of the time-dependence of cross-correlations between all the stocks comprised by DAX and by Dow Jones points to a significant novel element associated with dynamics of the contemporary financial evolution. By properly taking into account the time-zone delays both these markets largely merge into a single one. This becomes particularly spectacular in the last few years. At the same time an emerging global market preserves the distinct difference in the mechanism governing increases and decreases, respectively. Similarly as for single markets [5] the increases also in this case are less collective and more competitive than decreases. This study also documents that it is the Dow Jones which takes a leading role in this emerging global market. As an interesting problem for further study it seems likely that such a global world market involves many other markets as well.
References
- [1] L. Laloux, P. Cizeau, J-.P Bouchaud and M. Potters, Phys. Rev. Lett. 83, (1999) 1467
- [2] V. Plerou, P. Gopikrishnan, B. Rosenow, L.A. Nunes Amaral and H.E. Stanley, Phys. Rev. Lett. 83, (1999) 1471
-
[3]
E.P. Wigner, Ann. Math. 53, (1951) 36;
M.L. Mehta, Random Matrices (Academic Press, Boston, 1999) - [4] J. Kwapień, S. Drożdż and A.A. Ioannides, Phys. Rev. E 62, (2000) 5557
- [5] S. Drożdż, F. Grümmer, A. Górski, F. Ruf and J. Speth, Physica A 287, (2000) 440
-
[6]
H. Markowitz, Portfolio Selection:
Efficient Diversification of Investments
(J. Wiley and Sons, New York, 1959);
E.J. Elton and M.J. Gruber, Modern Portfolio Theory and Investment Analysis (J. Wiley and Sons, New York, 1995) -
[7]
A. Edelman, SIAM J. Matrix Anal. Appl. 9, (1988) 543;
A.M. Sengupta and P.P. Mitra, Phys. Rev. E60, (1999) 3389